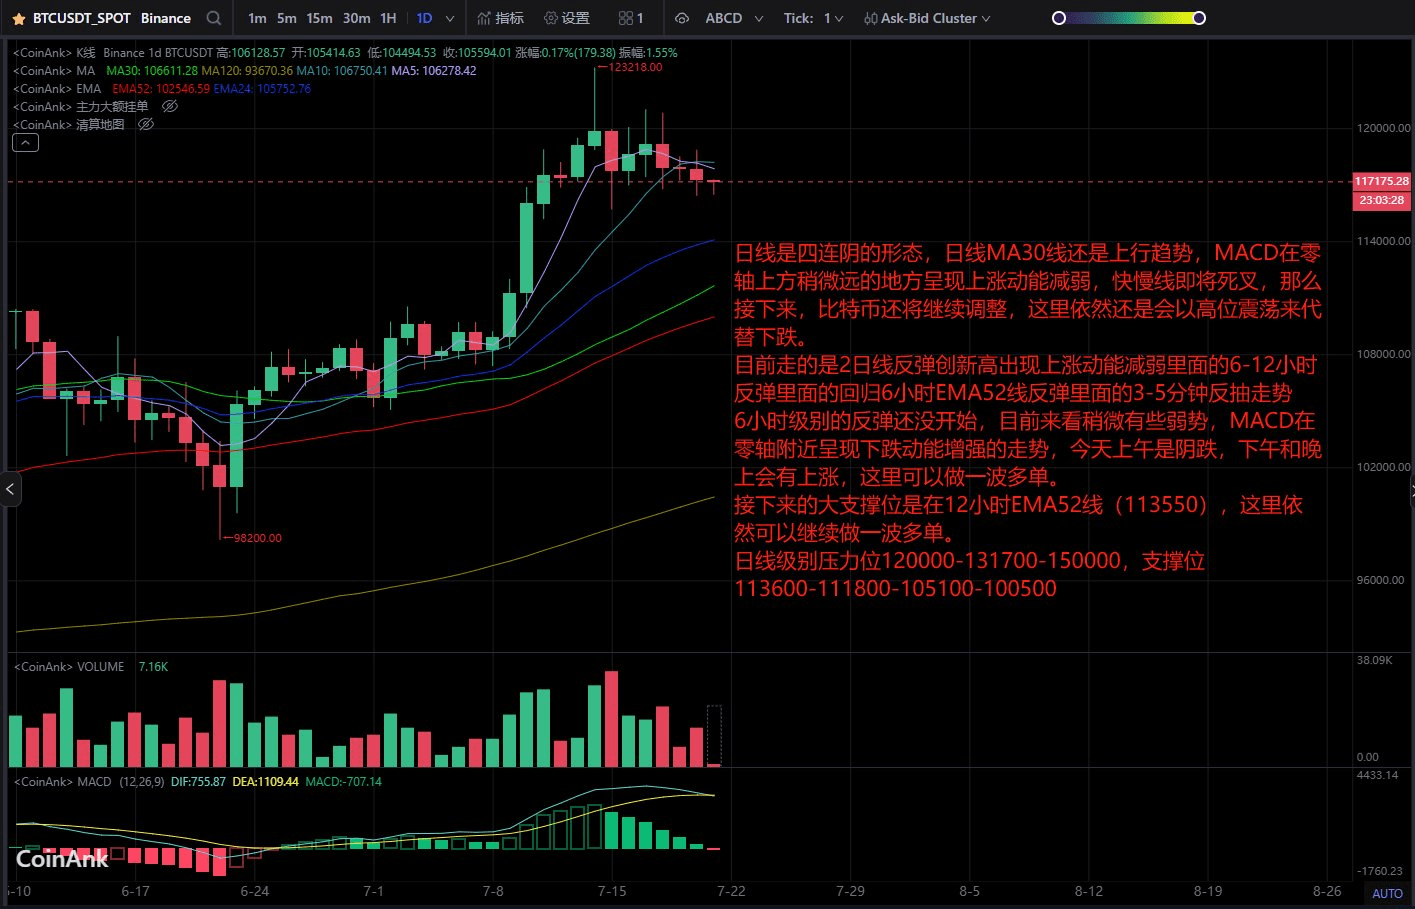
The weekly chart shows a small bearish candle with a long upper shadow and a short lower shadow, and the trading volume has increased by about 30% compared to last week.
The weekly MA30 line shows a slight upward trend, and the MACD is exhibiting a strengthening upward momentum above the zero axis. If this week continues to show a bearish candle, it will indicate insufficient upward momentum, and further adjustments will be needed.
The pullback range is between 112000 and 109700.
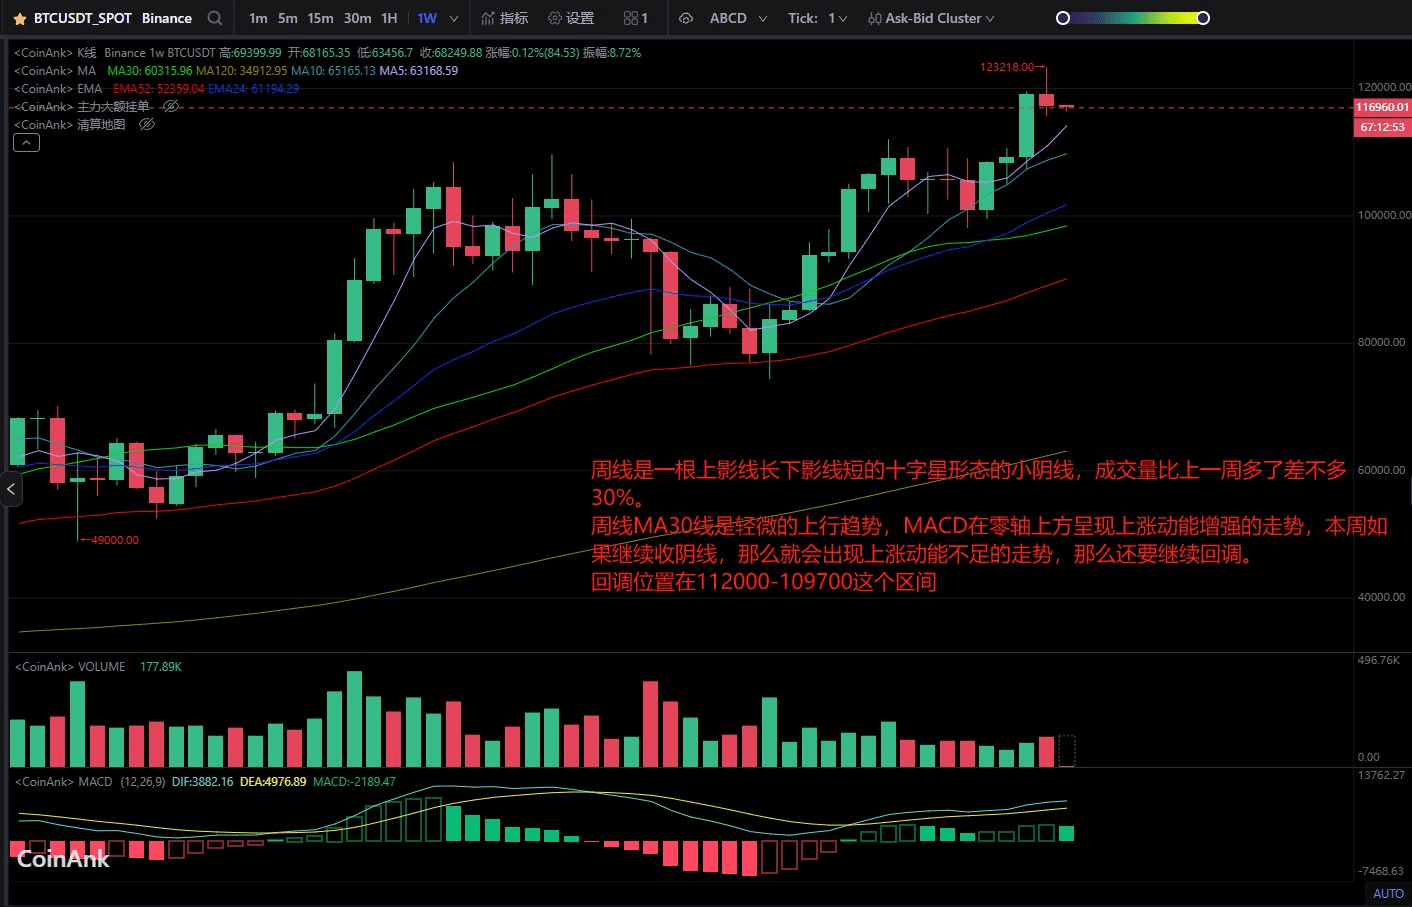
The daily chart shows a four consecutive bearish candle pattern. The daily MA30 line is still in an upward trend, and the MACD is showing weakening upward momentum slightly away from the zero axis, with the fast and slow lines about to cross. Therefore, Bitcoin will continue to adjust, and high-level fluctuations will replace the downward trend.
Currently, it is showing a rebound on the 2-day chart with a new high, indicating a weakening upward momentum within the 6-12 hour rebound, along with a return to the 6-hour EMA52 line rebound and a 3-5 minute pullback trend.
The 6-hour rebound has not started yet, and it appears slightly weak at the moment. The MACD is showing strengthening downward momentum near the zero axis. This morning showed a slow decline, but there will be an upward movement in the afternoon and evening, so one can make a long position here.
The next major support level is at the 12-hour EMA52 line (113550), where one can still make a long position.
Daily resistance levels are at 120000-131700-150000, and support levels are at 113600-111800-105100-100500.