
1.
What is a moving average?
Moving averages are stock indicators commonly used in technical analysis that help create a constantly updating average price.
Having a clear grasp of moving averages (MAs) is crucial to better understanding golden crosses and death crosses. Typically, moving averages are calculated to determine the trend direction of an asset or to determine its support and resistance levels.
MA is a technical indicator that refers to the average price of a specific asset over a specified period. The MA indicates whether an asset is moving in a bullish (positive, upward) or bearish (negative, downward) direction.
MA provides useful signals when trading cryptocurrency charts in real time. They can also be adjusted to different periods, such as 10, 20, 50, 100 or 200 day periods. These periods highlight market trends, making them easy to identify.
Traders also use different types of MAs. The first is the simple moving average (SMA), which divides an asset's average price over a specific period by the total number of periods.

The other is a weighted moving average, which, as the name suggests, assigns more weight to recent prices. This makes the value more reflective of recent changes in the market. Exponential moving averages, on the other hand, while giving more weight to recent prices, do not align with the rate of decline between a particular price and its previous price.
Moving averages, also known as "lagging indicators," are based on historical prices. Traders use MAs as signals to guide them in buying and selling assets, with the 50-day and 200-day periods being the ones crypto traders watch most closely.
2.
What is the Golden Cross?
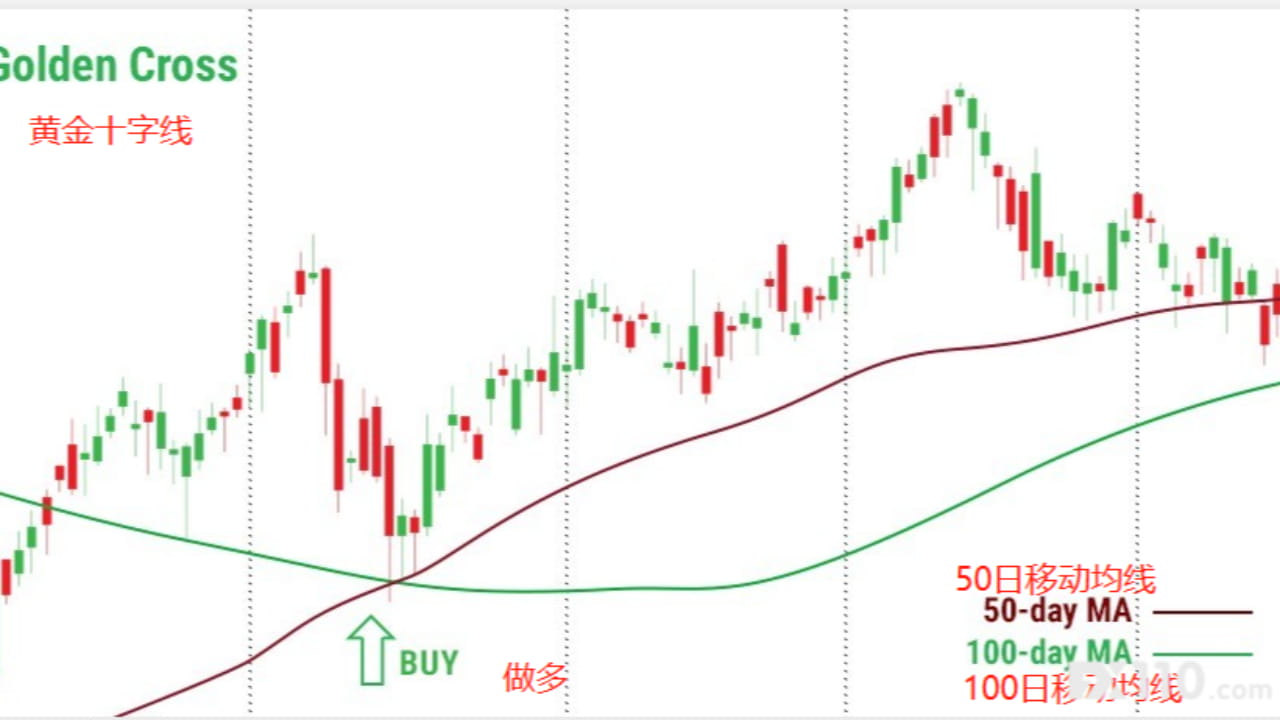
A so-called "golden cross" occurs when the short-term MA and the major long-term MA cross upward. Golden crosses indicate rising prices and an upward trend in the market.
The short-term MA moves upward much faster than the long-term MA until market conditions push them to cross. In the case of simple moving averages, a golden cross occurs when the 50-day SMA crosses above the 200-day SMA, indicating a confirmed uptrend.

The Golden Cross pattern is usually divided into three phases. When selling is exhausted, it usually marks the end of a downtrend and therefore the beginning of a golden cross. The next phase is when the short-term MA crosses the long-term MA. This is followed by the final phase, marked by a sustained upward trend that usually results in higher prices.
No two golden crosses are exactly the same, but these three phases are often unique events that mark the occurrence of a golden cross. Let's understand each stage in more detail.
In the first phase, buyers are controlling the downtrend. Short-term weakness at the 50-day moving average signals the beginning of a golden cross. This is because the resulting power usually comes from buyers starting to take control while short-term sellers are drying up.
There is a plateauing on the chart, with buyers pushing prices higher as they try to gain control. The resulting momentum gradually pushes the 50-day EMA above the 200-day EMA, at which point the two cycles cross over. When the 50-day EMA crosses above the 200-day EMA, traders are often on high alert to determine if an uptrend is occurring or if this is just a false alarm.
The final phase occurs when the 50-day EMA continues to rise, indicating momentum. This also often leads to overbuying, albeit only in brief bursts.
3.
What is the Cross of Death?
In contrast to the golden cross, the death cross involves a downward MA crossover. This signals a clear market downturn and usually occurs when the short-term MA is trending downward, crossing the long-term MA.
In short, it is the exact opposite of the Golden Cross. Death crosses are often interpreted as bearish signals. The 50-day moving average usually crosses below the 200-day moving average, indicating a downtrend.
Three stages mark a death cross. The first occurs during an uptrend when the short-term MA remains above the long-term MA. The second phase is characterized by a reversal, during which the short-term moving average crosses below the long-term moving average. This is followed by the start of a downtrend, as the short-term moving average continues to move downward, remaining below the long-term moving average.

Just like golden crosses, no two death crosses are the same, but specific indicators indicate their occurrence. Each stage of Death Cross is detailed here. The first stage of a death cross is usually marked by an asset in an uptrend. This was followed by a weakening of the 50-day EMA, the first sign that bearishness may be coming. The short-term MA diverges from the long-term MA as the price begins to fall after peaking.
The second phase sees the 50-day EMA crossing below the 200-day EMA. This is a key point as it indicates that the asset may be entering a downtrend. As the price continues to fall, the difference between the two MAs becomes more pronounced. At this stage, the death cross begins to take shape more clearly.
The final phase is marked by the 50-day moving average continuing its downward trend below the 200-day moving average. This indicates that a downtrend is indeed underway. Death crosses often lead to further selling pressure as traders close out positions in anticipation of further price declines.
However, if the downtrend does not continue, it may mean that the momentum is short-lived and the price rebounds quickly, in which case the death cross is considered a false signal.
4.
What is the difference between a golden cross and a death cross?
The main difference between Golden Cross and Death Cross is that the former indicates an uptrend while the latter indicates a downtrend.
As mentioned before, the two are essentially opposites in terms of how they appear on charts and the signals they send out. Since the MA is a lagging indicator, the two crossovers are only used to confirm the occurrence of a trend reversal, not to predict it. Therefore, they should be used in conjunction with other technical indicators to better understand market conditions.
Golden crosses and death crosses are usually confirmed by high trading volume. Other technical indicators that analysts may focus on are the Moving Average Convergence Divergence and the Relative Strength Index.
Death crosses often herald the beginning of a long-term bear market, not just in the cryptocurrency market but in the stock market as a whole. The death cross has heralded the coming of major economic crises in the past, such as the Black Monday stock market crash of 1929 and the 2008 financial crisis.
That said, a death cross can also represent a false signal and is not 100% accurate. For example, there are examples of markets recovering after a death cross.
On the other hand, a golden cross signals the arrival of a long-term bullish market. However, despite its apparent predictive power in predicting previous great bull markets, golden crosses can also produce false signals.

5.
How do traders use golden crosses and death crosses in their trading strategies?
Traders typically buy during the golden cross and sell during the death cross.
Different traders have different approaches to crossover signals. Some traders may wait for a confirmed golden cross or death cross before entering or exiting a trade. Others may use the crossover as a confirmation signal in conjunction with other technical indicators.
Generally speaking, however, golden crosses and death crosses can be used as trend reversal signals. If traders see a golden cross forming, they may purchase the asset in anticipation of a price increase. Likewise, if traders see a death cross forming, they may sell the asset in anticipation of a price drop.
Of course, always be cautious when trading crossover signals, as blindly following them can lead to losses. As mentioned before, false signals can occur and it is important to confirm any cross signals with other technical indicators before entering a position.
Experienced traders also know to look at the big picture and consider multiple readings. For example, a golden cross may occur on an hourly time frame, but zooming out to see daily or weekly time frames may indicate that a death cross is actually in play.
Volume is also something to pay attention to when trading crossover signals, as volume spikes can very well confirm or deny the validity of a signal.