
I have used this method for six years. From an initial capital of less than 10,000 in the cryptocurrency space, I have now earned over 8 million!

How can retail investors survive in the market?
First, when trading cryptocurrencies, look at the market environment and the overall trend, and abandon the mindset of 'light on the overall market, heavy on individual coins'. Follow the trend as king. Understand that making money is only because the market is strong, losing money is only because you are being overconfident.
Do not hold coins 365 days a year, 24 hours a day, trading every day. This is okay in a bull market, but definitely not in a bear market. You should be out of the market when you need to be and hold coins when you should; leave the market when necessary, and align with the overall market rhythm. Focus on swings and trends, and avoid frequent chasing highs and cutting losses in short-term trading.
1. Buy
The timing of buying is crucial; do not buy at high points, do not cut losses at low points, only intervene when the trend is established.
2. Sell
The timing of selling is equally crucial; do not be greedy for the last bit of profit, do not harbor a sense of luck, and take profits when they are good.
3. Stop Loss
Setting stop-loss is an art, not ruthlessness. Set stop-loss points and execute strictly to avoid small mistakes turning into big ones.
4. Take Profit
Taking profit is wisdom; do not blindly chase the highest point. Once the expected returns are achieved, lock in profits in a timely manner.
5. Patience
Patience is golden; do not trade frequently, do not blindly follow trends, and wait for the best timing.
6. Discipline
Discipline is ironclad; do not be swayed by emotions, do not violate trading plans, and adhere to rules.
7. Information
Information is wings; pay attention to market dynamics, capture policy trends, and gain insights into industry changes.
8. Mindset
Mindset is fundamental; do not be swayed by temporary ups and downs, maintain peace, and treat things rationally.
9. Learning
Learning is the source; continuously enrich yourself, enhance your analytical abilities, and adapt to market changes.
10. Risk Control
Risk control is vital; do not borrow money to trade cryptocurrencies, do not heavily invest in a single type of coin, and diversify risks.
No more needless chatter, let's get to the point.
What is a moving average?
Types and Formulas of Moving Averages
How to add moving averages to charts
Trading Applications of Moving Averages
Combination Application of Multiple Moving Averages
How to choose moving average parameters
Advantages and Disadvantages of Moving Averages
Summary
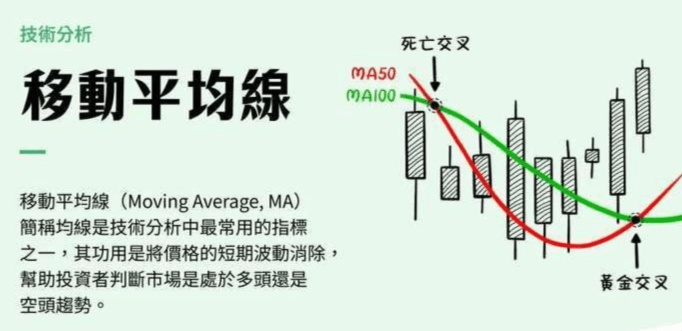
The moving average, as a technical indicator's stepping stone, is a must-learn technical analysis for every trading novice, and it is one of the most widely used technical indicators on the market. In this chapter, we will explore what exceptional aspects moving averages have, how they assist investors in making trading decisions? This article will delve into the meaning, types, calculation methods of moving averages, and their practical applications in trading. Finally, we will give advice on how to adjust one's moving average parameters. What is a moving average? A moving average (MA) is one of the most commonly used indicators in technical analysis, used to help traders smooth price fluctuations for a clearer observation of price trends. It eliminates short-term price fluctuations by calculating the average closing prices over a certain period, helping investors determine whether the market is in a bullish or bearish trend.
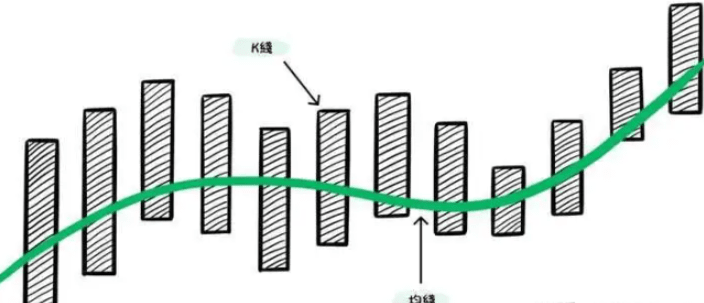
In the diagram, it can be seen that moving averages smooth out the fluctuations of K-line prices. So why do moving averages with larger parameters smooth the price more? This is related to their formulas; let's understand how moving averages are formed next.
Types and Formulas of Moving Averages
The calculation of the moving average is based on the closing prices of K-lines over a certain period, calculated as a weighted or unweighted average. Common moving averages include:
Simple Moving Average (SMA)
Exponential Moving Average (EMA)
Weighted Moving Average (WMA).
1. Simple Moving Average (SMA)
Simple Moving Average (SMA) is the most basic moving average. The following is the calculation formula for SMA:
SMA = Sum of closing prices over n days / n
By dividing the sum of closing prices over a specific range by the number of days n, the day's SMA can be calculated. SMA gives equal weight to all data, so price fluctuations are smoother.
Example:
Assuming a certain stock's closing prices for the last 5 days are: 100, 102, 101, 104, 103.
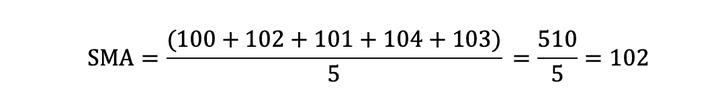
Calculation result: 5-day SMA is 102.
This type of moving average is relatively simple to calculate, but it references the average price, so it reacts more slowly to recent price fluctuations. As n increases, the relationship of the simple moving average to the current situation weakens, and it may sometimes not align with the present conditions.
2. Exponential Moving Average (EMA)
Exponential Moving Average (EMA) assigns different weights to closing prices from different periods during the calculation, where more recent K-line closing prices have higher weights, thus EMA responds more sensitively to price changes and the data will be closer to market prices than SMA.
EMA is suitable for volatile markets, or when traders want to capture short-term trends.
EMA = (Today's closing price x a) + [Yesterday's EMA x (1 - a)]
The smoothing coefficient a is a tuning parameter determined by the number of days n:
a = 2 / (n + 1)
Calculation Steps:
Step 1: Calculate a. Assuming n = 10, then a = 2 / (10 + 1) = 0.182.
Step 2: Use SMA as the value of the first day's EMA.
Step 3: From the second day onward, use the EMA calculation formula. Example:
Assuming a certain stock's closing prices for the last 3 days are 100, 102, and 104, calculate the 3-day EMA (simplified process):
Day 1:
SMA = (100 + 102 + 104) / 3 = 102 (as the starting EMA). Second day's EMA:
a = 2 / (3 + 1) = 0.5
Today's price = 102, yesterday's EMA = 102.
EMA = (102 x 0.5) + (102 x 0.5) = 102. Third day's EMA:
Today's price = 104, yesterday's EMA = 102.
EMA = (104 x 0.5) + (102 x 0.5) = 103
3. Weighted Moving Average (WMA)
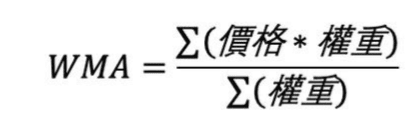
Weighted Moving Average (WMA) is similar to EMA, but it does not use exponential decay; instead, it allocates weights in a linearly decreasing manner. WMA is suitable for moderately volatile markets where traders want to smooth out prices but still follow trends quickly.
For example, in a 5-day WMA, the weight for day 1 is 1, the weight for day 2 is 2, and so forth, with the weight for day 5 being 5.
Example:
Assuming a certain coin's closing prices for the last 3 days are 100, 102, and 104, calculate the 3-day WMA:
Weights are 1 (Day 1), 2 (Day 2), 3 (Day 3).
Calculation formula: WMA = ((100 * 1) + (102 * 2) + (104 * 3)) / (1 + 2 + 3) = 616 / 6 = 102.67.
Calculation result: 3-day WMA is 102.67.
Trading Applications of Moving Averages
As one of the most commonly used technical indicators in financial markets, moving averages have various trading applications. The roles of moving averages in trading are:
Used for trend judgment
As a reference for support and resistance
Used to discover trend reversal points
1. Used for trend judgment
Trend is one of the cores of trading; moving averages can visually reflect the direction of price trends, helping traders confirm whether the current market is in an upward or downward trend.
When the price remains above the moving average, it is likely to indicate an upward trend.
When the price remains below the moving average for a prolonged period, it is likely to indicate a downward trend.
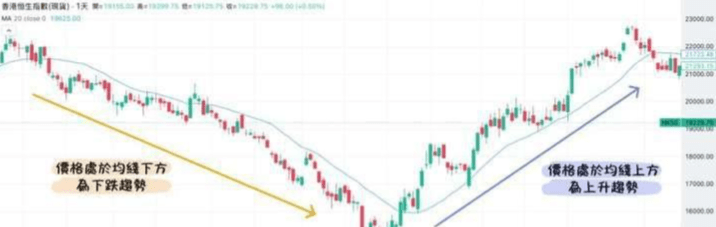
Taking the Hong Kong Hang Seng Index HK50 as an example, we can see that when the price is below the 20-day moving average and the moving average shows a downward trend, asset prices exhibit a clear downward trend; conversely, when the price is above the 20-day moving average and the moving average shows an upward trend, asset prices exhibit an upward trend.
2. As Support and Resistance
In different market conditions, moving averages can act as dynamic support or resistance levels, helping traders identify potential rebound or breakout points.
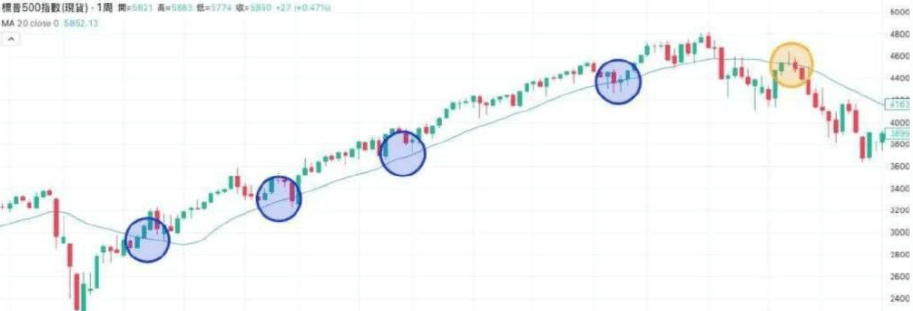
From the example of the Standard & Poor's 500 above, we can see that when asset prices drop near the moving average, they receive a certain level of support; however, when prices fall below the moving average, that moving average becomes a resistance level.
3. Use Golden Cross + and Death Cross + to judge trend reversals
The crossover points of moving averages are often used as buy or sell signals. Common crossover strategies include golden crosses (when short-term moving averages break upwards through long-term moving averages) and death crosses (when short-term moving averages break down through long-term moving averages).
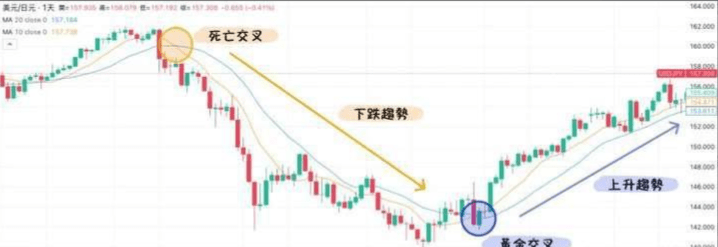
Taking the USD/JPY as an example, when the 10-day SMA falls below the 20-day SMA, it rapidly declines, forming a clear downward trend; conversely, when the 10-day SMA breaks above the 20-day SMA, this trend reverses, changing the downward trend to an upward trend.
Combination application of multiple moving averages
Moving averages can be used in conjunction with multiple lines, which can help traders more clearly judge market trends.
1. Bullish Arrangement of Moving Averages
Short-term, medium-term, and long-term moving averages are arranged from bottom to top, all showing an upward slope, indicating a strong bullish trend.
Trading application: Consider holding long positions and adding to positions when short-term moving averages pull back.
2. Bearish Arrangement of Moving Averages
Short-term, medium-term, and long-term moving averages are arranged from top to bottom, all showing a downward slope, indicating a strong bearish trend.
Trading application: Consider holding short positions and adding to positions when short-term moving averages rebound.
3. Moving Average Entanglement
When multiple moving averages tend to be parallel and intertwined, it indicates that the market may be in a consolidation phase or about to experience a breakout.
Trading application: Observe the direction of price breakthroughs of moving average entanglements to choose entry points.
How to choose moving average parameters
The setting of moving average parameters is very important in trading, as different parameters directly affect the generated trading signals. So how should we choose moving average parameters?
1. Classification of Moving Average Time Periods
Based on time periods, moving averages can be roughly divided into three categories:
Short-term moving averages (5-day, 10-day)
Characteristics: Reacts quickly and is sensitive to market changes. Suitable for short-term traders for intraday trading or short-term swing operations.
Application Scenario: Capture short-term price movements, such as breakouts, pullbacks, and rebounds.
Medium-term moving averages (20-day, 50-day)
Characteristics: Balances sensitivity and stability, effectively identifying swing trends. Suitable for swing traders who want to capture a complete trend.
Application Scenario: Judging the stability of market trends, filtering out short-term noise.
Long-term moving averages (100-day, 200-day)
Characteristics: Reacts slowly but better reflects long-term market trends. Suitable for long-term investors.
Application Scenario: Used to judge bull or bear markets and as main support or resistance levels.
2. Choose parameters based on trading style
Day traders
Recommended moving average parameters: 5-day EMA, 10-day EMA
Reason: Day trading requires quick responses, hence short-term EMA is more suitable for capturing immediate price fluctuations.
Application: When the 5-day EMA crosses above the 10-day EMA, it triggers a buy signal; conversely, it triggers a sell signal.
Short-term swing traders
Recommended moving average parameters: 10-day EMA, 20-day EMA
Reason: Short-term swing trading requires balancing sensitivity and stability; the 20-day EMA can reflect recent trends and filter out short-term noise.
Application: Consider buying when the price stabilizes above the 20-day EMA; consider selling when it breaks below the 20-day EMA.
Medium to long-term investors
Recommended moving average parameters: 50-day SMA, 100-day SMA, 200-day SMA
Reason: Long-term investment focuses on major trend judgments, and the 200-day SMA is an important bull-bear dividing line.
Application: When the price crosses above the 200-day SMA, it indicates entering a long-term bullish market, suitable for buying on dips; when the price crosses below the 200-day SMA, it indicates that the market is weakening, so caution is advised.
3. How to Choose Parameters Based on Market Characteristics
High volatility markets (such as cryptocurrencies, tech stocks)
In a market with severe volatility, it is suitable to use moving averages with high sensitivity, such as short-term EMA (5, 10 days).
Reason: EMA can reflect market changes more quickly, allowing traders to adjust strategies in a timely manner.
Low volatility markets (like large-cap blue chips, stable assets)
In a stable market, it is suitable to use moving averages with good smoothness (20, 50, 200 days).
Reason: SMA can filter out unnecessary short-term noise, allowing traders to focus on medium to long-term trends.
Fluctuating market
During price consolidation and fluctuations, moving averages can be frequently crossed.
Recommendation: Combine multiple moving averages (such as 5, 10, 20-day SMA) to observe if the moving averages are entangled and the direction after price breaks through the entanglement.
Advantages and Disadvantages of Moving Averages
While moving averages are one of the most widely used technical indicators in financial markets, they are not without flaws. Next, we will take a look at the advantages and disadvantages of moving averages.
1. Advantages of Moving Averages
Smooth price fluctuations, filter noise
Moving averages filter out short-term price fluctuations by smoothing price data over a period, helping traders focus on the main trend.
High flexibility, suitable for different time periods
Moving averages can be set with parameters for different trading periods, from short-term (like 5-day, 10-day) to long-term (like 100-day, 200-day).
For example, short-term traders can choose 5-day or 10-day moving averages to capture short-term fluctuations, while long-term investors can choose the 200-day moving average to determine the bull-bear dividing line.
Provide clear trading signals
The crossover of moving averages (such as golden crosses and death crosses) and price breakout strategies can provide clear buy and sell signals. These signals can assist traders in forming clear entry and exit plans, reducing indecision.
2. Disadvantages of Moving Averages
Strong lagging, slow response
Moving averages are calculated based on past price data and cannot predict the future; they can only reflect past trends. When the market undergoes a rapid reversal, moving averages lag, leading to delayed entry or exit signals.
For example, when the market rises rapidly or plummets, the price may have already completed a round of fluctuations, while the crossover signals of moving averages are only just appearing, causing traders to miss the best trading opportunities.
Cannot cope with fluctuating markets; easily generates false signals.
In sideways consolidation or fluctuating markets, prices frequently cross moving averages, leading to the frequent occurrence of false signals, easily causing traders to enter and exit frequently, increasing trading costs.
For example, in a consolidation range, short-term MA (like 5-day or 10-day) frequently crosses the price, but the actual trend is not clear, leading to losses.
Difficult to capture extreme market events or sudden market changes
Moving averages cannot cope with sudden market events or severe fluctuations, potentially missing significant trends or reversal signals.
For example, when major news causes the market to suddenly surge or plummet, the trading signals from moving averages often lag behind the price.
Summary
The moving average is one of the most commonly used indicators in technical analysis, used to judge market trends and provide trading signals through smoothing price fluctuations. It includes types such as Simple Moving Average (SMA), Exponential Moving Average (EMA), and Weighted Moving Average (WMA), and can be used for trend judgment, support and resistance analysis, and discovering trend reversal points. Short-term moving averages are suitable for traders who need to react quickly, while medium to long-term moving averages help capture stable trend movements. Although moving averages are easy to understand and effectively filter out noise, their lagging nature and false signals in fluctuating markets must be approached with caution. To gain a deeper understanding and adjust moving averages, one must continuously try and explore.

What strategies are there for holding coins in the cryptocurrency space?
In the cryptocurrency world, there is a phenomenon where traders account for a large proportion, while holders are few. But ultimately, those who can truly profit in the cryptocurrency space
Often, it will be these holders.
Essentially, trading cryptocurrencies is about buying and selling for price differences through short-term transactions, while holding coins is different; it focuses on the investment value of a particular coin.
Continuously buy and wait for appreciation.
Due to the low threshold for trading cryptocurrencies, it is relatively easy to start and can easily yield profits in a short period, most investors, especially novices, will
More prefer to trade cryptocurrencies rather than hold coins. Looking at the entire investment market, this phenomenon is almost universal; short-term trading is the choice of most people.
Once they experience a bit of sweetness, they become obsessed with trading cryptocurrencies. Humans inherently possess this gambler's mentality; just earning a little can lead to overconfidence.
Increasing the position size. Conversely, losing a bit leads to constant anxiety, and the mindset nearly collapses, falling into a vicious cycle, ultimately resulting only in
Can be used to cut losses.
Holding coins requires more technical knowledge; you need to make correct judgments and understand the market situation. Once you find the right time to accumulate, you can have quite significant
The observed profit is that the transition from bear to bull market will take longer, requiring more patience.
What strategies are there for holding coins?
First, do not hold too many types of coins; try not to exceed six types, aiming to hold three to four super mainstream coins that are unlikely to die off.
If you cannot select good assets or do not know how to select, just hold Bitcoin+.
Second, holding coins should be moderately diversified; do not hold just one type; you can choose three to six types to avoid black swan events.
Third, when holding coins, refer to the types of coins that major holders are accumulating, as they have some reference value. Many major holders have been in since 2012 or 2013.
Elders have experience.
Fourth, when holding coins, try to choose regular investments, starting regular investments in Bitcoin during long-term low-volume consolidation or at the beginning of an arc bottom, and try to avoid
Downward trend.
Fifth, the mindset for holding coins should have a pessimistic expectation; in a bear market or early bull market, holding coins means buying dips and being prepared for potential losses, so keep a long-term perspective.
This is to prepare for a bountiful harvest in a bull market two years later. Therefore, try to use spare money that does not affect your living. Even if Bitcoin falls another 40%,
80% is also a possibility. But as long as you hold Bitcoin, there will be a day when it rebounds.
Sixth, do not use leverage when holding coins or use very little leverage. Currently, centralized exchanges + contract leverage are full of unfairness and insider information; holders should avoid using leverage as it can easily lead to sudden liquidations. If leverage is necessary, it must be used with spot.
Three things long-term holders should avoid
1. One-step completion, holding coins at too high a price.
To hold long-term, maintaining a good mindset is very important. If it is not through regular investment, but rather a single high-position purchase, no matter how much you comfort yourself that it is a long-term investment, the anxious feelings before a paper loss are still hard to shake off.
2. Self-doubt, giving up halfway
In every bear market, there are very few people entering the market. Even if the asset value of Bitcoin is 'halved' or 'slashed', those willing to buy Bitcoin at three thousand dollars are far fewer than those willing to buy it at ten thousand dollars. Regular investment also faces torment. In such situations, the biggest problem is not the bearish market but whether entering the market was a result of your own thinking or merely following the 'success stories' shared by prominent figures or friends. For long-term investors, it is essential to have your own views, execute according to plans, not fear going against the tide, assess the situation, and incorporate your understanding into your judgments, ultimately validating your cognition through actions.
3. Improper storage, loss of private keys.
There are many long-term holders who eventually forget their private keys. Although Bitcoin is now valuable, millions of bitcoins have become irretrievable for various reasons.
The difference between trading cryptocurrencies and holding coins is akin to the difference between short-term and long-term stock trading. Holding onto a stock for the long term reduces risk compared to short-term trading. Holding Bitcoin long-term is likely to be profitable. Short-term trading, on the other hand, carries significant risk, easily leading to total loss. Hence, it is said that 'trading cryptocurrencies isn't as good as holding coins.' Trading cryptocurrencies is short-term trading in the secondary market, while holding coins involves buying low and selling high.
#Strategy增持比特币 #山寨季何时到来?
$BTC