

At 3 a.m., the harsh liquidation alarm woke me from my dreams. I was drenched in cold sweat as I stared at the screen—within just 3 hours, 6 million in assets had vanished into thin air, and my account balance turned into a shocking red negative. At that moment, I slumped in front of my computer, as if nailed to the cross of failure...
This unforgettable night completely changed my understanding of the cryptocurrency space. I finally understood: this is not a casino, but a battlefield that devours people without spitting out bones. In desperation, I borrowed 200,000 from a friend and began my path of revenge.
Studying candlestick patterns during the day, recording trading logs late at night, etching every failure deep into my bones... After three months of hellish training, I finally honed a trading system that turned my fate around. With this method, I rolled 200,000 in capital into over 20 million in 90 days, with every penny of profit soaked in blood and tears of lessons learned.
Today, I want to share with you all the experiences I have gained through hard-earned money without reservation...

Remember these 8 iron rules gained with hard-earned money; each one is priceless:
1. When the market crashes, if your coin only sees a slight pullback, it indicates that there are major players protecting it. Such coins often perform well afterward and are worth holding onto.
2. Beginners can follow this simple rule: for short-term trading, look at the 5-day moving average; hold if the price is above it, sell if it falls below; for medium-term holdings, look at the 20-day moving average, similarly holding above and exiting below. The method doesn’t need to be complex; the key is strict execution.
3. In a main upward trend, if the volume is moderate during the rise, decisively enter. Continue holding if the volume increases; don’t panic if it pulls back on low volume but the trend remains intact. However, if there’s a significant volume drop breaking the trend line, you must immediately reduce your position. For short-term trades, if there’s no increase in three days, consider exiting; if losses reach 5%, strict stop-loss is necessary.
4. When a coin pulls back more than 50% from its peak and continues to decline for over a week, it often signals an impending rebound from oversold levels, at which point you can start to position yourself appropriately.
5. Leading coins are always the first choice; they lead when they rise and resist when they fall. Don’t buy just because the price is low, nor fear because it has risen a lot. The real trick is to enter when the trend is established and exit when it’s crazy.
6. The trend is your best friend. Buying at the 'right' position is more important than buying at a 'cheap' position. Don't easily try to catch a falling knife in a downtrend; promptly cut losses on weak coins.
7. Don’t let occasional profits cloud your judgment; sustaining stable profits is real skill. Review daily: was this profit due to luck or skill? Building a trading system that suits you is the long-term solution.
8. Rest when you are uncertain. Being in cash is also a form of wisdom. The primary goal of trading is to preserve capital, and only then to pursue profits. Quality always trumps quantity; ten small profits do not equal one large loss.
These experiences were gained at the cost of huge losses; I hope you can avoid detours. Remember, in this market, surviving longer is much more important than making quick profits.
Dear friends, today I will detail the three classic application techniques of the EMA indicator; mastering these methods will significantly enhance your trading decision-making ability.
1. Trend determination rule—Zero Axis Crossing Method
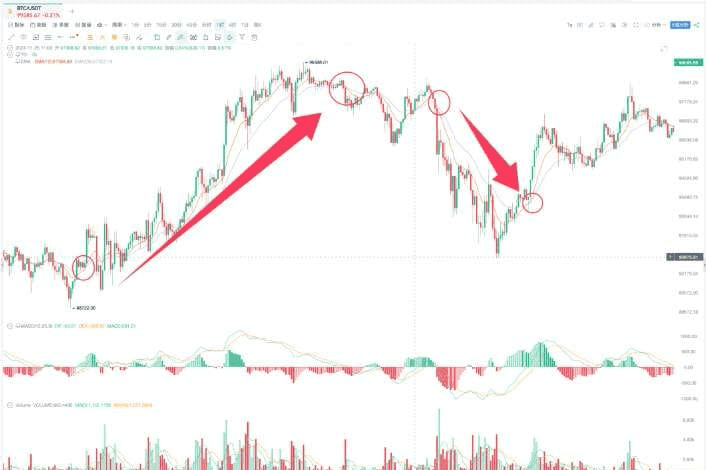
For determining trend direction, the 'Zero Axis Crossing Method' is the simplest and most efficient analysis tool. This method only requires observing the DIF line, the core indicator, to reach a judgment level equivalent to that of professional analysts. Taking Bitcoin (BTC/USD) as an example, when we set the EMA(12,26) parameter combination in a 1-hour timeframe, we can clearly observe that each time the DIF line forms a golden cross signal, it often corresponds to a high-quality entry opportunity.
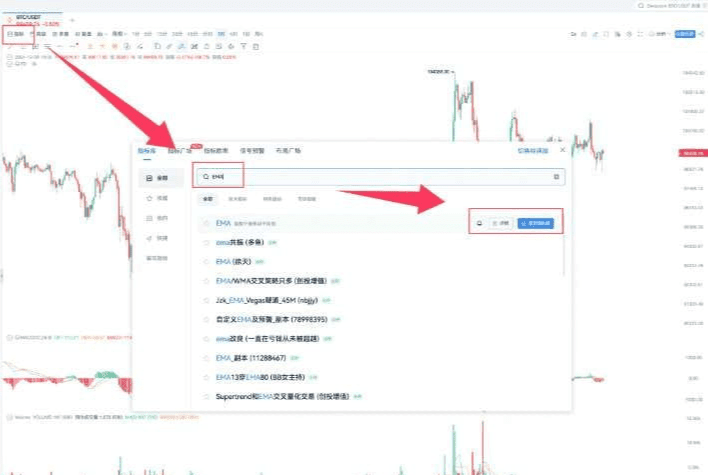
Taking Bitcoin (BTC/USDT) as an example, set the EMA(12,26) parameter combination for analysis in a 1-hour timeframe.
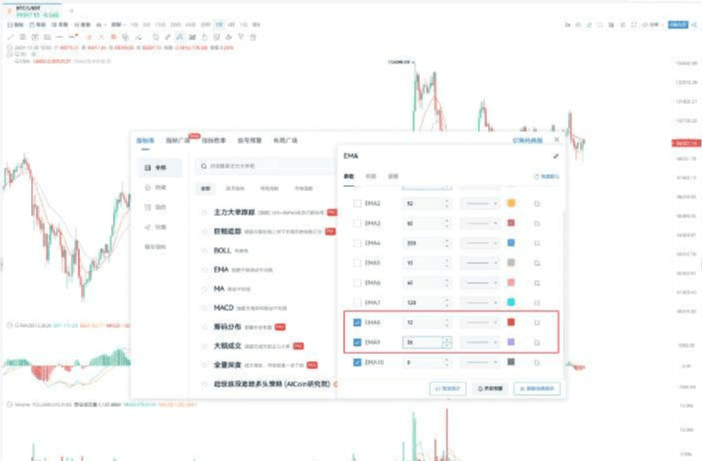
You will find that every time a golden cross appears, it often represents a good entry opportunity.
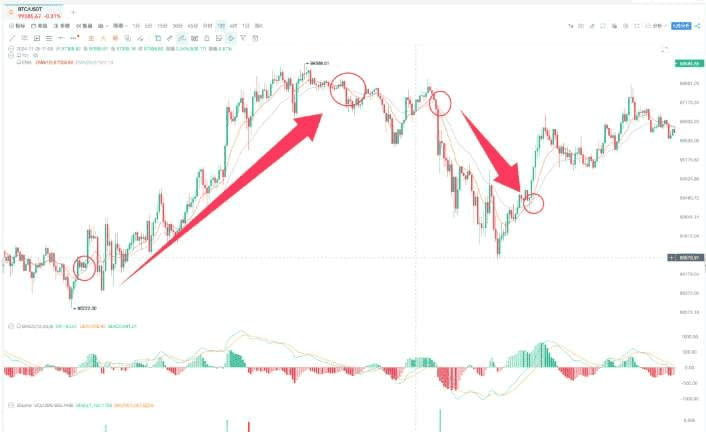
In short, the DIF line generated by the EMA(12,26) indicator can effectively capture mid-term trends. When a golden cross or death cross signal appears, the market often unfolds a trend.
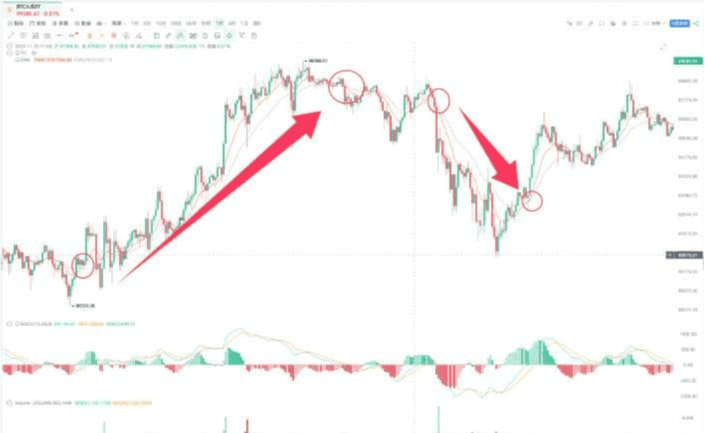
In fact, the performance of this EMA parameter set is entirely consistent with the DIF line of the MACD.
If you want something simpler, you can directly look at the DIF line in the MACD to analyze the market.
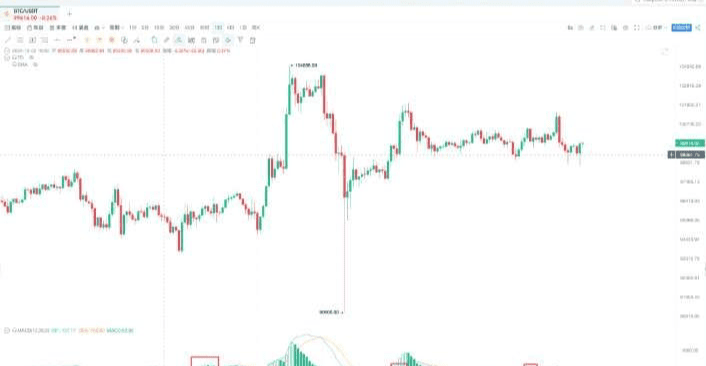
It’s important to remember: the larger the chart timeframe, the more accurate the trend indication from the DIF line. For example, switching to a 4-hour chart and using the DIF line to determine direction is more reliable.
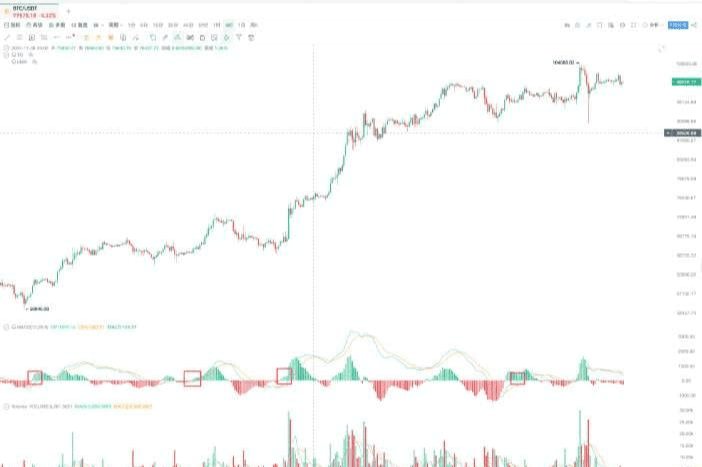
When the DIF line falls below the zero axis, you can reduce your position and observe; when it breaks above the zero axis, combined with volume and other signals, you can boldly go long. Crossing the zero axis indicates a trend formation, and there will be multiple opportunities afterward.
The DIF line is essentially the difference between EMA12 and EMA26. Many people misunderstand that EMA is lagging. It gives more weight to recent prices and can quickly reflect changes, with 1-2 candlesticks able to convey price movements.
Simply remember: look at the 4-hour chart for the DIF line; go long above the zero axis and short below it. Pairing it with volume analysis increases accuracy, but don’t expect 100% accuracy; the key is to understand the characteristics of the indicators.
Find EMA signals
1. Resonance signals
This is a very robust trading method.
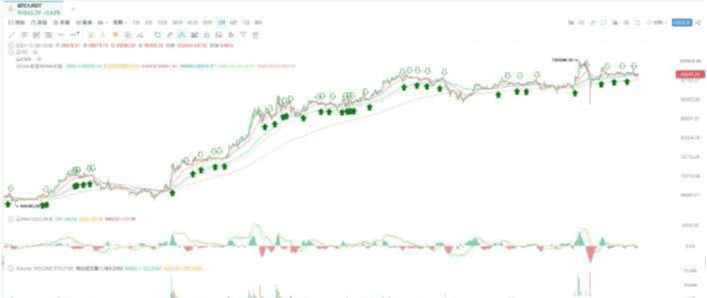
My EMA resonance trading system provides clear signals, with precise entry and exit points.
Solid green arrows = bullish initiation signals, hollow arrows = bullish termination signals.
In an uptrend, these signals can decisively prompt you to go long; in a downtrend, the system will also provide short signals in sync.
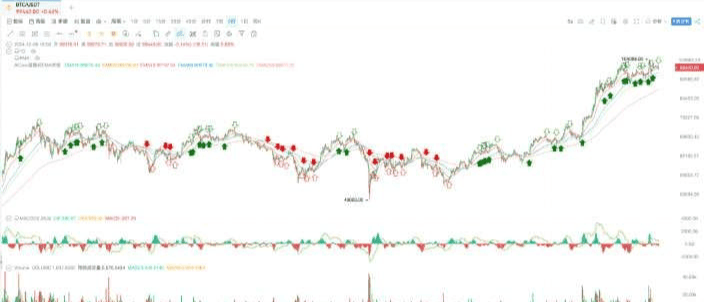
It is recommended to first use the DIF line to determine the trend direction, then operate based on the resonance indicator.
Currently, I am using a combination of 6 sets of EMA parameters; everyone can adjust the parameter configuration themselves.
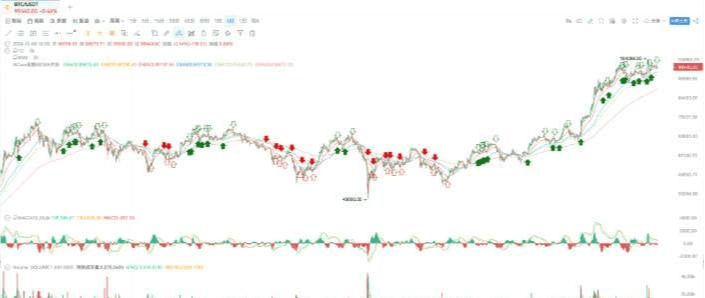
This EMA resonance indicator is very simple to use: go long when all EMA lines are in a bullish arrangement, and go short when they are in a bearish arrangement. It provides clear trading signals, especially suitable for those who are always hesitant or easily anxious during trading. Clear entry and exit signals can help you overcome psychological barriers when trading.
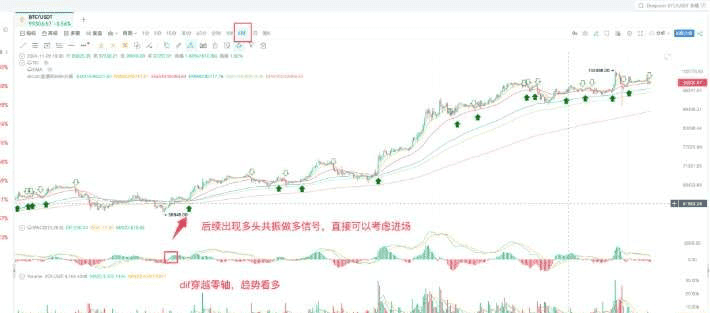
It can help you accurately capture the best entry timing. The specific operation is: first use the DIF line to determine the trend direction, then use resonance signals to determine specific entry points. The combination of the two can significantly improve trading win rates.
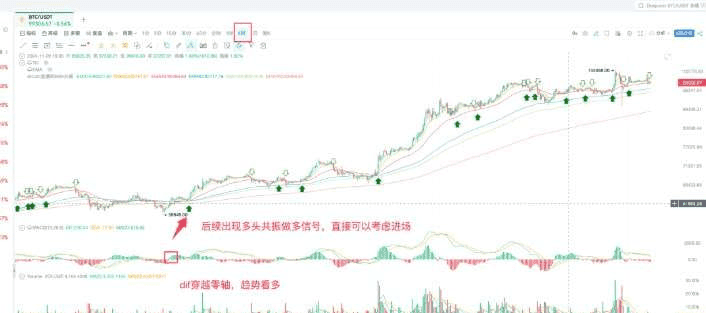
I am @老顾财经 , specializing in short to medium-term contract trading, sharing investment tips and detailed strategy teaching #BTC120kVs125kToday #StrategyBTCPurchase