


Here are 8 of the best swing trading indicators.
1. Relative Strength Index (RSI)
RSI is often used to measure whether an asset is overbought or oversold, and its value range is between 0 and 100.
RSI>70 is often considered an overbought condition and could signal an impending pullback.
RSI<30 is often considered an oversold condition, which could signal an impending rebound.
It should be noted that RSI is not an absolute indicator. Under a strong trend, RSI may remain at a high or low level for a long time.
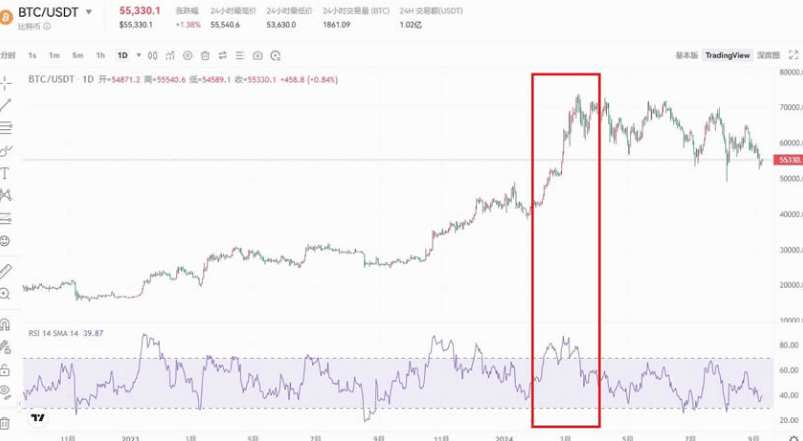
As shown in the above figure, in the BTC daily chart, BTC started a strong upward trend from the end of January to mid-March this year. Although the BTC daily RSI once reached 80, there were few retracements during the rise, and the upward momentum was strong. Until mid-March, the daily RSI finally reversed the trend and fluctuated downward after maintaining a high level close to 90.
2. Moving Average (MA)
MA helps traders identify and confirm market trends by smoothing price data by calculating the average price over a certain period of time. The main types are:
Simple Moving Average (SMA): A simple arithmetic average of all prices over a specified period.
Exponential Moving Average (EMA): Gives more weight to recent prices and reacts faster to market changes.
Weighted Moving Average (WMA): Calculates the average based on a custom weight.
When prices are above the MA, it is usually considered an uptrend. When prices are below the MA, it is usually considered a downtrend.
When multiple MA lines converge, it may indicate that a large move is imminent.
MA is often seen as a dynamic support or resistance level. When a crossover signal occurs, such as a short-term MA crossing a long-term MA, it may indicate a trend change.
As shown in the figure below, after the 9-day EMA on the BTC 4-hour chart crossed the 26-day EMA from below, BTC entered an upward trend in the short term. This intersection is called a "golden cross" and is usually regarded as a buy signal. On the contrary, the intersection is called a "death cross" and is usually regarded as a sell signal.
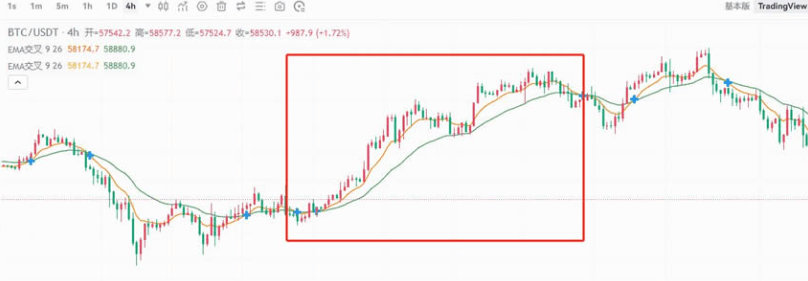
However, it should be noted that MA works better in trending markets, but in volatile markets, MA may generate a large number of false signals. Therefore, traders should not rely solely on MA, but should combine it with other technical indicators such as trading volume for comprehensive analysis.
3. Bollinger Bands
Bollinger Bands were created by John Bollinger in the 1980s to measure market volatility and possible price ranges.
The composition of Bollinger Bands:
Middle track: usually the 20-period simple moving average (SMA).
Upper track: middle track plus two standard deviations.
Lower track: Middle track minus two standard deviations.
Bollinger Bands are a volatility indicator. A wider band indicates increased volatility, while a narrower band indicates decreased volatility. When the Bollinger Bands are extremely narrow, it usually indicates that a large volatility is about to occur.
In a volatile market, Bollinger Bands can be viewed as an “oversold or oversold” signal:
Prices approaching or breaking through the upper band may indicate overbought. ● Prices approaching or breaking through the lower band may indicate oversold.
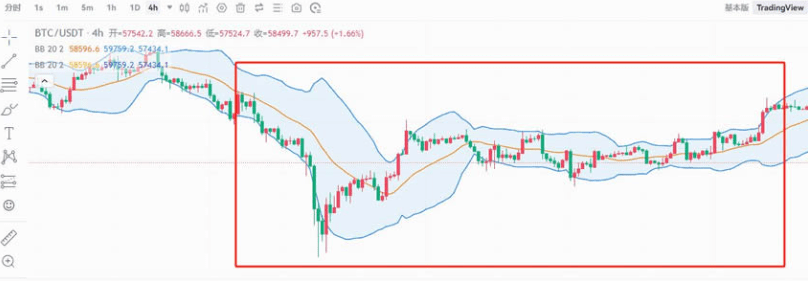
It is important to note that the Bollinger Bands behave differently in trending markets and volatile markets. In a trending market, asset prices may remain above or below the Bollinger Bands for a long time, so it should not be simply regarded as a "sell or buy" signal at this time.
As shown in the figure below, BTC 4-hour chart, its price trend has been fluctuating between the lower track and the upper track.
4. Moving Average Convergence Divergence (MACD)
MACD consists of two lines: the MACD line (fast line) and the signal line (slow line), whose crossovers and relationship with the zero line can provide trading signals.
· MACD line crosses the signal line: it may be a buy signal · MACD line crosses the signal line: it may be a sell signal
· MACD histogram turns from negative to positive: it may indicate that the upward momentum is increasing. The divergence between MACD and price may indicate a trend reversal.
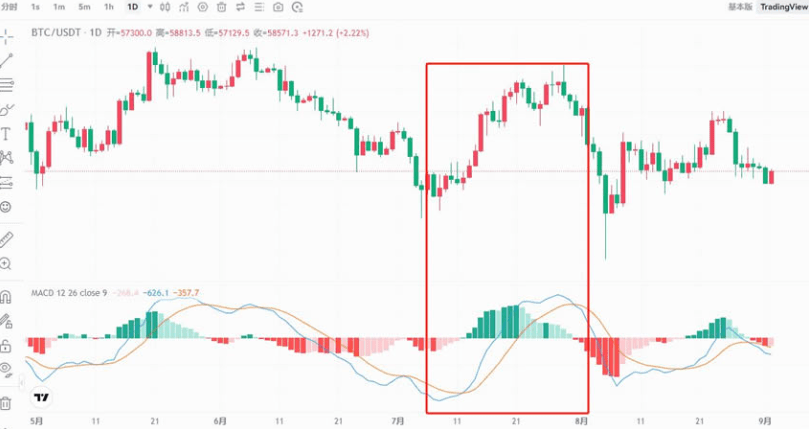
For example, as shown in the red box in the figure below, the MACD line on the BTC daily chart crosses the signal line, and the MACD histogram turns positive. At this time, BTC's upward momentum increases and continues to rise.
5. Volume
Although trading volume is not a complex technical indicator, it is extremely important and can verify the strength of price trends.
Rising prices with increasing volume: usually seen as a strong uptrend Falling prices with increasing volume: may indicate strong selling pressure Price changes with low volume: may indicate a lack of trend sustainability Sudden surges in volume: may indicate important market turning points
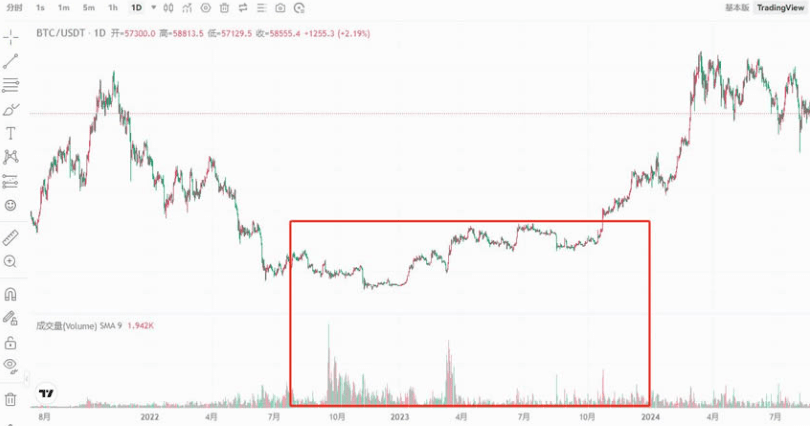
Looking at the BTC daily chart, several subsequent BTC moves with significant increases in volume have seen sharp fluctuations.
6. Stochastic
The stochastic indicator is a momentum indicator that includes the %K line and the %D line, which is used to determine the price position within a certain period. It works similarly to the RSI indicator, but the calculation method is different.
K line crosses D line: may be a buy signal
K line crosses D line: may be a sell signal. Index value over 80: may be overbought. Index value below 20: may be oversold.
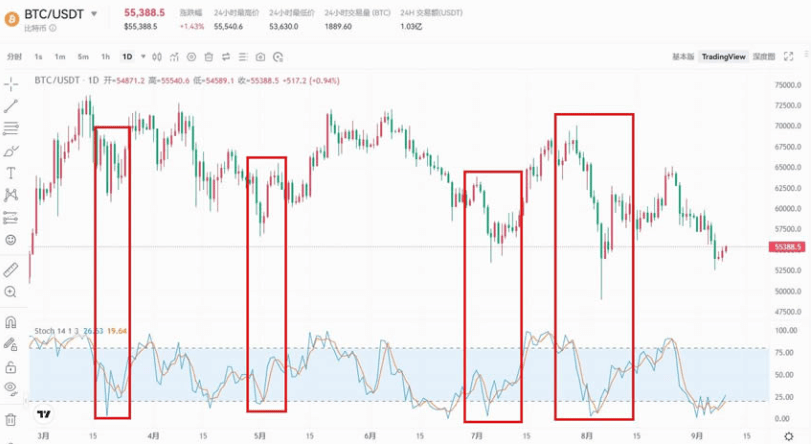
As shown in the figure above, in the BTC daily chart, when the stochastic indicator is below 20 for many times, BTC is also at a stage bottom, indicating that the market is oversold and there is a need for a rebound. However, it should be noted that although the stochastic indicator is a useful tool, it is not omnipotent. Traders should use it in combination with other technical analysis indicators and fundamentals to improve the accuracy of judgment.
7. Fibonacci Retracement
Fibonacci retracements are based on the Fibonacci sequence and are used to identify potential support and resistance levels. Commonly used retracement levels include 23.6%, 38.2%, 50%, and 61.8%.
In an uptrend, these levels may act as supports for pullbacks. In a downtrend, these levels may act as resistance for rebounds.
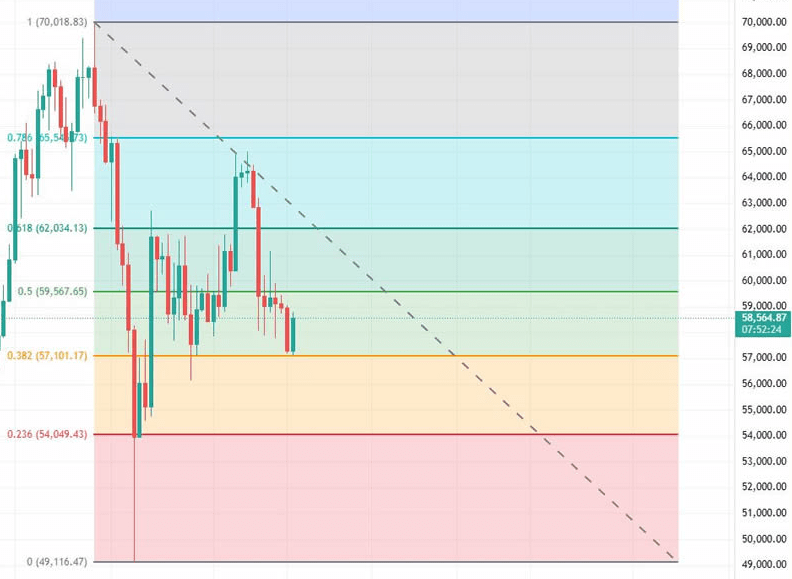
For example, in BTC's most recent plunge, the price fell from $70,018 to $49,116. According to the commonly used Fibonacci level, when BTC rebounded later, it received support at the 38.2% position many times, and the 61.8% position became a rebound resistance level.
8. Average True Range
ATR is a volatility indicator developed by J. Welles Wilder Jr. It measures the average price fluctuation of an asset over a specific time period, regardless of price direction, and can help traders set stop-loss levels and target price levels.
High ATR values: Indicate high volatility and may indicate important market turning points or breakouts
Low ATR values: indicate low volatility and may indicate consolidation or the end of a trend
Used to set stop loss: For example, you can set the stop loss outside the entry price at 2 times ATR
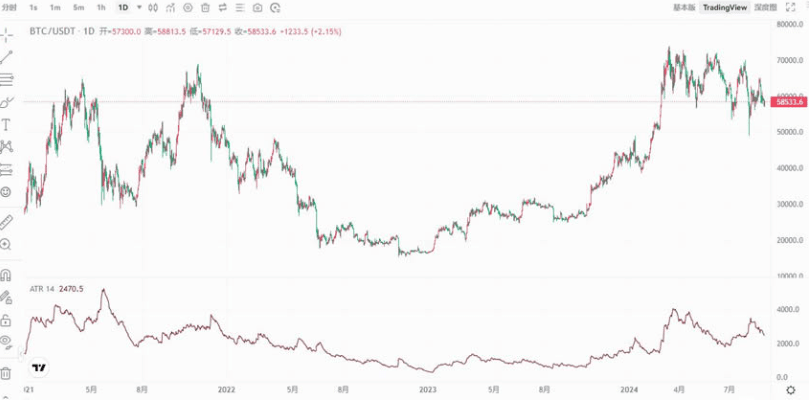
For example, the current price of BTC is 58,500 USD, and the daily ATR is 2470, which means that the average daily price fluctuation of BTC is about 2470 USD. Then the stop loss point can be set at the entry price minus 2 times ATR, which is about 53560 USD (58500-2470*2).
The importance of volume
After understanding the technical indicators, there is one more thing to pay attention to, which is "volume". Just now I mentioned that technical indicators are data calculated based on price and volume, and also reflect the total number of buying and selling activities in the market. Therefore, high volume usually means that the reliability of decision-making based on technical analysis methods is higher, while low volume may mean that the price trend lacks support.
Volume can also help us verify price trends. For example, during a price increase, if the volume increases significantly, this usually means that the trend is likely to continue; if the volume decreases, it means that the trend may be about to reverse.
Advantages and Disadvantages of Cryptocurrency Technical Analysis
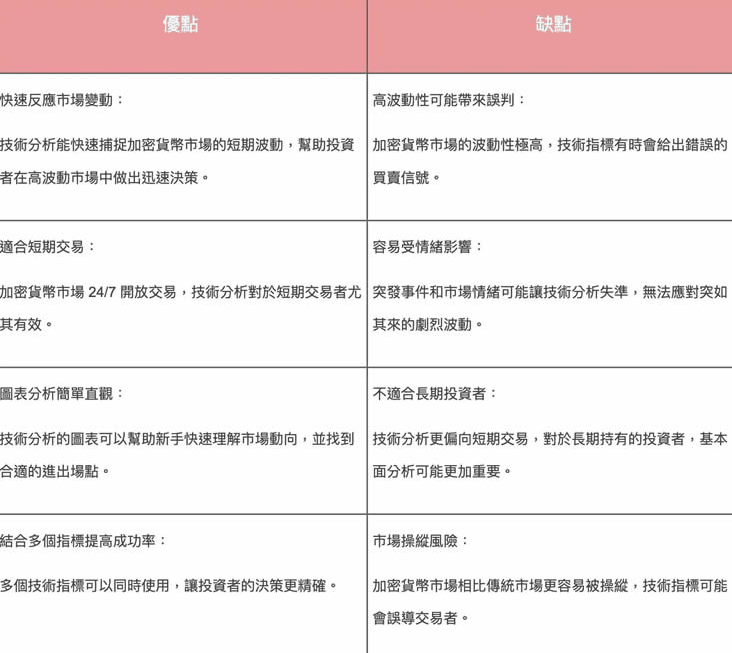
Neither technical analysis nor fundamental analysis is absolutely foolproof, and because technical analysis focuses on the market, it still has several shortcomings. The following is a table of the advantages and disadvantages of technical analysis to give novice investors an overview of the advantages and disadvantages of technical analysis.
Summarize
Technical analysis is not a tool to predict future prices, but a method to assist decision-making. It can increase the probability of investors making correct trading decisions, but it also needs to be combined with market sentiment and fundamental analysis, and learn to manage risks and set stop-loss points.
During the investment process of all loyal fans, Kui Ge will not only provide investors with market analysis ideas, basic knowledge of market analysis, and methods of using various investment tools, but also bring everyone wonderful fundamental interpretations, sorting out the chaotic international situation, and identification of various investment forces.
Continue to follow: $ETH $BTC #币安HODLer空投LA #币安钱包TGE