


Five major investment rules:
1. Consider and observe the project from multiple perspectives. Do not simply follow the crowd. Many scam projects have appeared in the crypto space; once the founder runs away, there is no way to hold them legally accountable.
2. Understand blockchain-related knowledge, know the industry pain points solved by blockchain, and then enter the crypto space.
3. For the projects you want to invest in, you must have a comprehensive understanding, know if the project truly employs blockchain technology, whether the founder has disclosed their identity and background accurately, if the business logic of the project is closely tied to the token, and whether there are similar projects in the same industry solving industry pain points. If the project successfully lands, does it have the ability to generate profits in real life?
4. If you cannot accurately judge the prospects of the cryptocurrency project, do not invest more than 20% of your assets in blockchain investments, and do not put all your eggs in one basket.
5. Quality projects will also experience rises and falls. Approach with a calm mind; for investment projects you believe in, do not worry too much about prices in the short term, but pay attention to whether the development progress of the team is consistent with the white paper. Additionally, only by holding long-term will you ultimately earn more returns.
Stable investment plan:
Position control, never easily go all in; this is why you shouldn't go all in.
The first point is risk control. You cannot guarantee that the price will rise immediately after you buy. If you encounter a waterfall decline, your assets will significantly discount, and you won't be able to average down.
The second point is mindset control. I have experienced this myself; after fully investing, I would constantly stare at the market, severely affecting my mentality. I can't even sleep well.
The third point is the risk of being cut off, having a gambling mentality, always wanting to see changes in your profits. After fully investing, if you see that your cryptocurrency hasn't risen and others have, or if there are other cryptocurrencies you want to buy, you may cut losses and buy in, leading to repeated operations that result in dwindling funds.
Long-term positions 30-40%, holding for a long time; short-term positions 30-40%. Why is there short-term trading?
Many people say that short-term trading is guaranteed to lose money. However, under the condition of long-term capital allocation, trading cryptocurrencies can be quite interesting. I believe that the vast majority of people cannot control their hands. As long as they manage their positions well and do not frequently cut losses, short-term trading should generally lead to profits upon exit (special cases occur when there are issues with the project or the market).
Through trading, I have penetrated the meaning of life, learning to examine everything around me from the perspective of volatility and probability. Seeing clearly what I want is my greatest gain in trading study and research.
Since I thought I was enlightened, I buckle my seatbelt while driving, quit smoking, curb arrogance and impatience, live steadily, love learning, love working, and treat everyone and everything around me well.
Quit bad habits, and success will come naturally and effortlessly.
I bought a piece of cheap jade and carved on it 'A gentleman is as warm as jade' as a self-motivation.
I have realized many truths; just to share one: all correct purposes are to self-certify errors. I humorously validated this.
Now, trading requires me to quit trading. Truly, I suddenly feel that a life of cheating has no meaning; this way of making money is meaningless and will destroy my hopes for the future.
I want to temporarily escape the lonely life and do something I love in my spare time. I started learning to write with a brush every day, sketching, appreciating famous paintings, playing the electronic piano, listening to music, studying psychology, reading the Four Books and Five Classics, smiling and chatting with people actively, inviting others to dinner when possible, and taking walks in the park when I have time to see trees, mountains, and water. The happiest things have nothing to do with money. I have never wanted to change anything; just being able to see and experience more of this world makes me very happy. Humanity carries so many interesting and lovely cultures; why should you entrust your life to candlesticks and remain alone for a lifetime?
These are all lessons taught to me by trading. What do you think the essence of trading is? It reflects your inner self, seeing clearly what you want! If you manage to maintain balance, the market will respond with humility; if you are greedy, the market will surely leave you dry; if you attempt to defeat the market, it will surely lead you to your demise.
"My life has been a failure!"
This is a reflection by the successful speculative predecessors who are far beyond your reach when they committed suicide. Speculation is too fast and too crazy; since the body cannot keep up, why not slow down?
Ask me again what the essence of trading is? I seek only one defeat.
Ask me again what the essence of life is? I seek only one death.
Do you think this is pessimistic? Do you think this is arrogant?
No! This is a game attitude of being neither sad nor happy, neither fearful nor unafraid, calm and peaceful.

In two years, holding less than 70, I achieved a win rate of 418134%, turning it into over 28 million. By relying solely on this method of K buy/sell signals, I easily multiplied by 100 times, achieving a win rate of 100%, repeatedly effective and still in use today.
How to judge buy/sell signals?
In the cryptocurrency market, technical analysis is a crucial indicator for predicting short-term market trends, commonly referred to as candlestick charts. Regardless of whether you believe in or uphold technical analysis, understanding candlestick charts is very necessary. Excluding technical issues such as chart shapes, indicators, and long-short battles, basic information such as price trends, trading volume, minimum points, and maximum points can also be reflected in candlestick charts. Therefore, today I will explain some basic introductory knowledge about candlestick charts, a survival skill essential for newcomers in the crypto space—understanding candlesticks. Candlestick charts, due to their unique shape, are also known as 'candlestick charts' and originated during Japan's Tokugawa shogunate, when rice merchants in Osaka used them to record daily, weekly, and monthly fluctuations in rice prices. Later, due to the delicate and unique nature of this way of recording market conditions, with strong three-dimensionality and a large amount of information, it was widely adopted in the investment field.
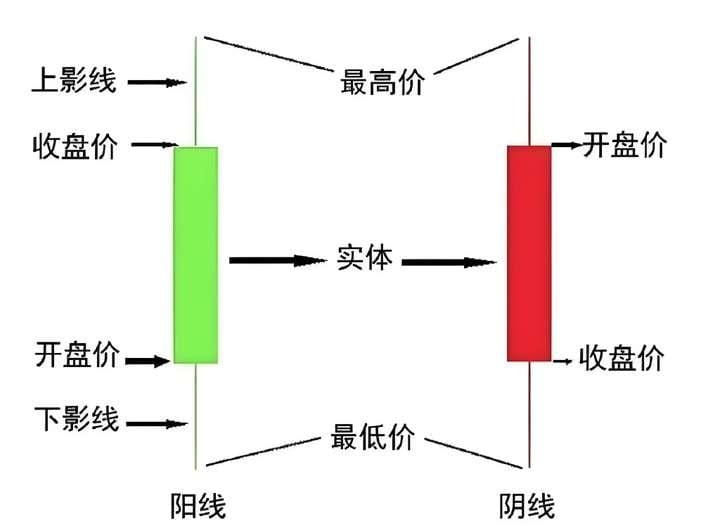
We learn about candlesticks because the most we face are candlesticks. The main components of candlestick charts are two: bullish candles and bearish candles. In most exchanges and analysis software in the crypto space, green represents bullish candles and red represents bearish candles. Simply put, bullish and bearish represent trend directions, with bullish candles indicating a continued rise and bearish candles indicating a continued decline. The size of the body represents intrinsic momentum; the larger the body, the more evident the upward or downward trend, and vice versa for less evident trends.
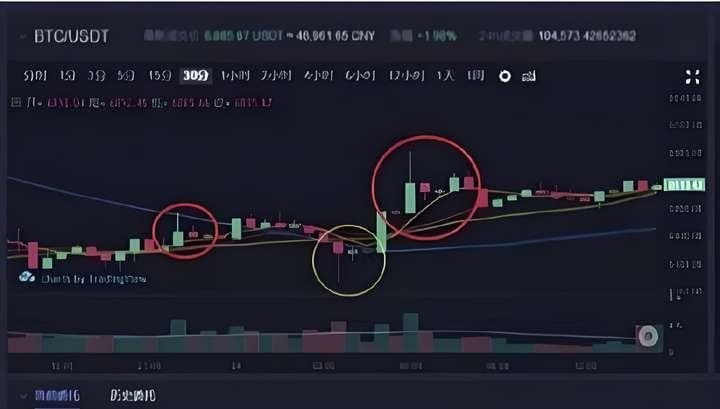
The shadow lines represent reversal signals. The longer the shadow line in one direction, the less favorable it is for the price to move in that direction; that is, a long upper shadow is less favorable for price increases, while a long lower shadow is less favorable for price decreases. Here’s a commonly used tip that beginners can try: when the price continues to rise and a long upper shadow appears, it can be seen as significant resistance above; although the closing price is still higher than the opening price, it indicates weakness or insufficient upward momentum. At this time, one can appropriately reduce positions to take profits (as seen in the K line trend within the red circle in the image). In another case, when a long lower shadow appears during a decline, it can be seen as strong support, backed by buying power (as seen in the K line within the yellow circle).
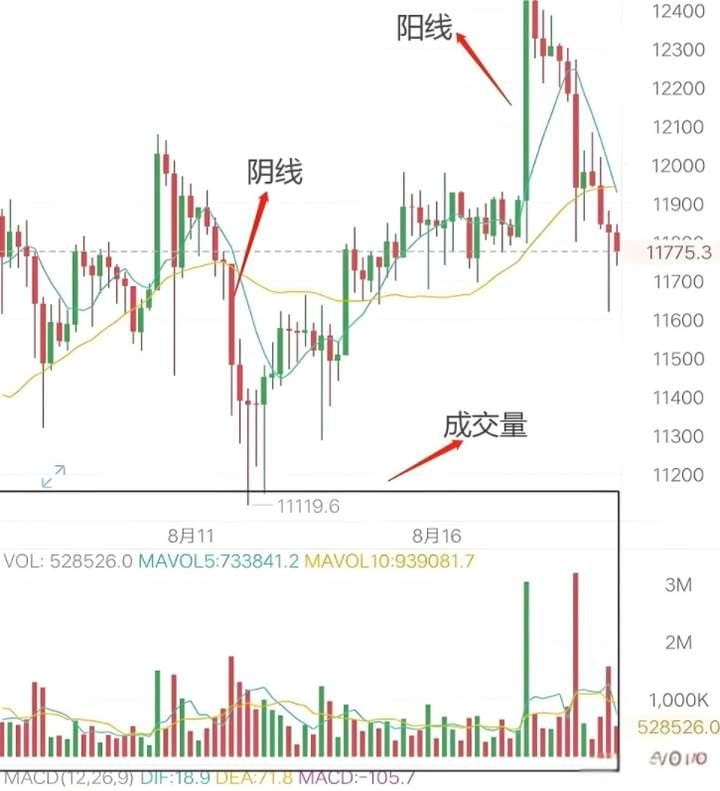
In the lowest part of the image below (black box), the red and green bars represent the trading volume for that time period. If it is a daily chart, one bar represents the trading volume for that day; for an hourly chart, it represents the trading volume for that hour. The higher the trading volume, the taller the bars. The green bars represent stronger buying, while the red bars represent stronger selling, corresponding to the upper bearish and bullish candles.
There is a saying in the investment market: 'History will repeat itself, but it will not repeat simply.' The ability to find the core information behind seemingly similar patterns through candlesticks has become an important indicator of a technical analyst's level. A survival skill essential for newcomers in the crypto space—KDJ's golden crosses and death crosses. The stochastic indicator KDJ is calculated based on the highest price, lowest price, and closing price, resulting in K value, D value, and J value, which form points on the indicator's coordinates. Connecting countless such points forms a complete KDJ indicator that reflects price fluctuation trends.
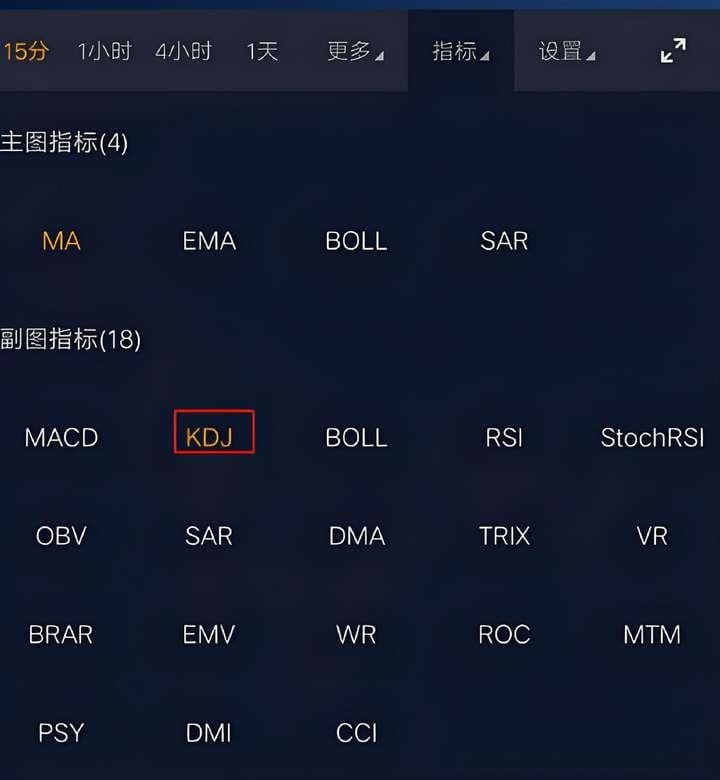
It mainly uses the true volatility of price fluctuations to reflect the strength of price trends and overbought/oversold phenomena, issuing buy/sell signals before prices rise or fall. Since the KDJ line is essentially a concept of random fluctuations, it is relatively accurate for grasping medium- to short-term market trends. On the OKEx exchange app, you can directly select the KDJ indicator in the main chart indicators, as shown in the figure below.
So what are golden crosses and death crosses? What do they represent? Simply put, when the K line (yellow line) crosses above the D line (blue line), it is a golden cross, commonly seen as a buy signal. Conversely, when the K line descends and crosses below the D line, it is a death cross, commonly seen as a sell signal. (As shown in the image below)
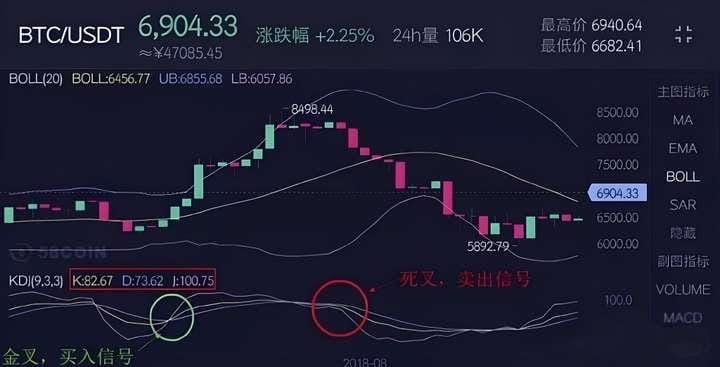
From the above image, it is not hard to find that K value, D value, and J value all have certain numerical values. The industry uses the value of 50 as the dividing line for the strength of KDJ operation, dividing the KDJ operational range into: below 20 is extremely weak, generally no buying plan is made, mainly staying in cash and observing. Between 20-50 is a weak area and between 50-80 is a strong area. Each KDJ golden cross in the above two ranges is an opportunity to enter, the higher the cross point, the more significant it is for the market. At the same time, attention must be paid to the size of the angle of the KDJ golden cross; the larger the angle, the better. Each KDJ death cross is a necessary signal to exit, and the higher the death cross point, the greater the risk of decline.
Above 80 is an extremely strong area, generally no selling plan is made, mainly holding coins and waiting for price increases. A survival skill essential for newcomers in the crypto space—MACD. MACD, or Moving Average Convergence Divergence, is derived from the double exponential moving average, calculated by subtracting the slow exponential moving average from the fast one. MACD is a whole; besides the reversal of the MACD bars, attention must also be paid to the DIF and DEA lines. The DIF line refers to the difference between the closing price and the short-term and long-term exponential moving averages (EMA). The DEA line is the M-day exponential moving average of the DIF line. The MACD line is the difference between the DIF and DEA lines, represented by the red and green bars. Simply put, when the MACD turns from negative to positive, it's a buy signal. When the MACD turns from positive to negative, it's a sell signal.
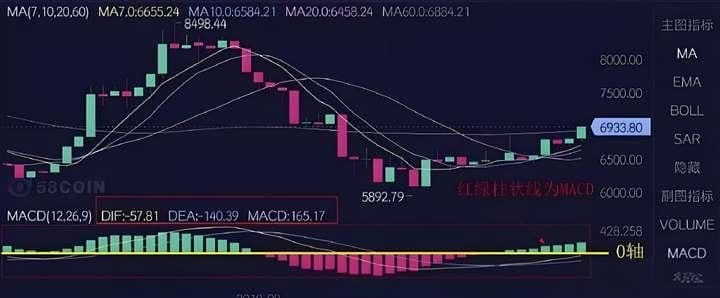
When the DIF and DEA lines are above the zero axis (both positive), a true bull market is established. If the DIF line crosses the DEA line from above and remains above the zero axis, it can only be regarded as a brief pullback, not a trend reversal. Conversely, when the DIF and DEA are below the zero axis (both negative), it is a bear market. Even if there are golden crosses and MACD bars have reversed, as long as the DIF and DEA remain below the zero axis, it can only be seen as a rebound, thus leaving the bear market.
A survival skill essential for newcomers in the crypto space—Bollinger Bands (BOLL). Bollinger Bands, abbreviated as BOLL, is a very practical technical indicator. It consists of three track lines, with the upper and lower lines acting as price resistance (upper band) and support (lower band), while the middle line is an average price line (middle band). Generally, the price line wanders within the band formed by the upper and lower bands, adjusting the position of the tracks automatically with price fluctuations.
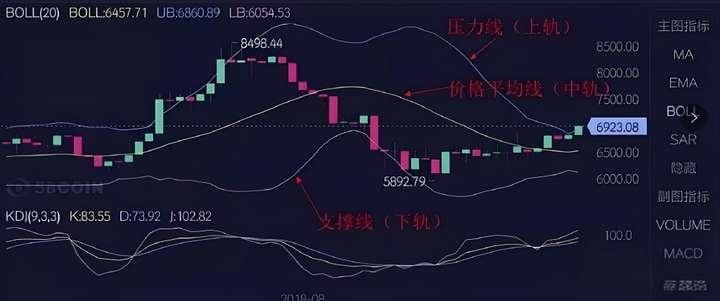
1. When the K line crosses above the 'upper track', it will form a short-term pullback, which is a short-term selling opportunity.
2. When the K line crosses below the 'lower track', it will form a short-term rebound, which is a short-term buying opportunity.
3. When the K line operates on the 'middle track', the market is basically in a fluctuation trend, and you should hold positions and observe.
4. When the K lines are between the 'middle track' and 'upper track', as long as the price does not break below the 'middle track', you should buy on dips.
5. When the K line is between the 'middle track' and 'lower track', as long as the price does not break through the 'middle track', you should sell on highs.
6. When the Bollinger Bands tighten, it means the market is about to change, so treat it with caution. For newcomers in the crypto space, the above indicators are the most commonly used for judging price trends. As long as you understand the underlying principles of the long-short battle behind candlestick formation, you will be able to understand the market implications of any candlestick in the future.
It should be noted that the various indicators and judgments mentioned above are merely auxiliary means and tools. Investors should not fully trust them. They should refer to the candlestick combinations of prices, the relationship between volume and price, trend shapes, and other factors in conjunction with fundamental and policy analysis to make judgments.

Learn to release the heavy burdens within, not to be overjoyed by profits or disheartened by losses. Actively put down your phone and computer, reduce excessive focus on market conditions, and meet each trading challenge with a calm and firm heart.
Super simple and effective tips for Bitcoin trading; remember to save them.
First tip: Trading volume is the guiding light for price trends.
Supply and demand, technology, policy, currency supply, and other fundamental factors are undoubtedly the main influencing factors affecting cryptocurrency prices. However, the crucial force that determines the rise or fall of a particular day is still the trading activities of the market itself. No amount of negative or positive news is as impactful as the actual trading activities. The directional role of trading volume in real transactions is particularly evident. Here’s a very accurate phrase to share: when trading volume increases and prices rise, there’s more to come; when trading volume increases and prices fall, there’s more to fall; when high prices suddenly see massive volume, beware of a crash; when low prices suddenly see massive volume, be alert to a potential surge.
Price trends represent direction while trading volume represents momentum. Since trading volume is the total of buying and selling contracts. High trading volume does not mean that many people are buying or selling. An upward trend only indicates that buyers are willing to transact at high prices, while a downward trend only indicates that sellers are willing to transact at low prices. Momentum and direction are two different things and should not be confused. Only in this way can volume-price analysis serve as a guiding light for our market predictions.
Second tip: Where there is accumulation, there will be explosive power.
What does this mean? It means that if a price oscillates back and forth within a relatively narrow box for many consecutive days, the longer the oscillation time, the more solid the K line of the box will be, leading to a stronger breakout when it happens. When we trade digital currency daily, we must pay attention to such opportunities.
In fact, the reasoning is very simple. It's like the magma in a volcano; before a volcanic eruption, the magma has to compete with the hard crust for power. The longer the repression, the greater the eruption force, which is the so-called 'either explode in silence or perish in silence.'
The meaning of the market is also easy to understand. In a narrow range of fluctuations, whether going long or short, there is basically no profit to be made in this area; any slight profits are given to transaction fees, losing the meaning of closing positions. Therefore, the number of open contracts will inevitably accumulate more and more. At this time, large players either actively collect chips waiting for a counterattack or wait to distribute chips during fluctuations, preparing to give opponents space. As the time stretches longer, the transfer of chips gradually completes. When the equilibrium of the concentrated area is finally broken, upward surges or downward plunges will naturally manifest, and at this time, three forces will bolster this unruly market:
Large holders either actively collect or wait for opportunities to distribute. Developing horizontally in a narrow range, a storm is brewing on the clear horizon, and dark currents are surging beneath the calm surface. The longer the concentrated area drags along the time coordinate, the greater the explosive power in either direction.
When the equilibrium of the concentrated area is finally broken, three forces will drive the market changes more violently. One is the small traders in power who are ruthless, aggressively increasing their positions and pursuing victory; another is those who were previously deeply trapped and are now forced to cut losses, adding fuel to the market. The last is those who observe and wait, seeing the trend clear up and immediately turn into trend followers, acting in accordance with the market.
Because the brewing of the concentrated area requires time, waiting for breakthroughs requires patience. If you enter the market rashly when the direction of the concentrated area is unknown, the risk will outweigh the reward. Dragging it out will only lead to impatience; when you become numb from self-observation and the market suddenly moves in the opposite direction, you will already be trapped. It’s better to first sit back and watch the fierce battle, resting and waiting, placing good limit orders, and only following the trend to pursue after the market breaks out.
Third tip: Pay attention to intra-day reversal signals.
There is no bull market that only rises without falling, nor is there a bear market that only falls without rising. The alternation of rises and falls is the basic law of digital currency trends. However, the reversal of rises and falls has two types of different evolutions: one is a change in the overall direction, where a major rise turns into a major fall or a major fall turns into a major rise.
This kind of reversal generally manifests as double tops or double bottoms, also called W or M shapes, three peaks or three bottoms, head and shoulders tops or inverted head and shoulders bottoms, etc. These are all major movements that generally take about three weeks to a month and a half to gestate.
Another type is a technical adjustment, where small declines occur during large rises or small rises during large declines. This type of reversal is usually marked by a high opening and low closing, often with an upper shadow in the K bearish line; or a low opening and high closing, often with a lower shadow in the K bullish line, marking small movements. If these situations are completed within one trading day, we refer to them as reversal signals. A large rise or fall is often composed of several smaller rises or falls. After a rise or fall, there is often a pullback to digest before the next wave of rise or fall. At this time, we must learn to follow operations closely, going short during declines and immediately going long when reversal signals appear.
Fourth tip: Strategies during market fluctuations.
The major uptrend in digital currencies does not happen every day: it is a one-sided trend. They operate between a period of rising and falling positions, or between two segments of rising, or two segments of falling, often leading to a fluctuating market. The so-called fluctuations refer to price hovering within a narrow range, falling back as it approaches the upper limit, and rising again when it hits the lower limit. We call this market consolidation, also known as 'box' trends.
The reason for fluctuations is that there are no obvious positive or negative news, and the market loses its directional momentum for one-sided development. At this time, only short-term speculation is viable, and both sides of the long and short are in a tug-of-war state. Many people are often caught in this state, getting dizzy from being hit from both sides. This is because the distance between the upper and lower limits is not large, and as soon as it hits the upper limit, it turns down, and as soon as it touches the lower limit, it bounces back up, with profit opportunities fleeting; a moment of greed can lead to being trapped.
Still, if you don’t know what to do in a bull market, click on the icon of Brother Kui, follow him, and plan for spot strategies in the bull market, contract passwords, and share for free.