

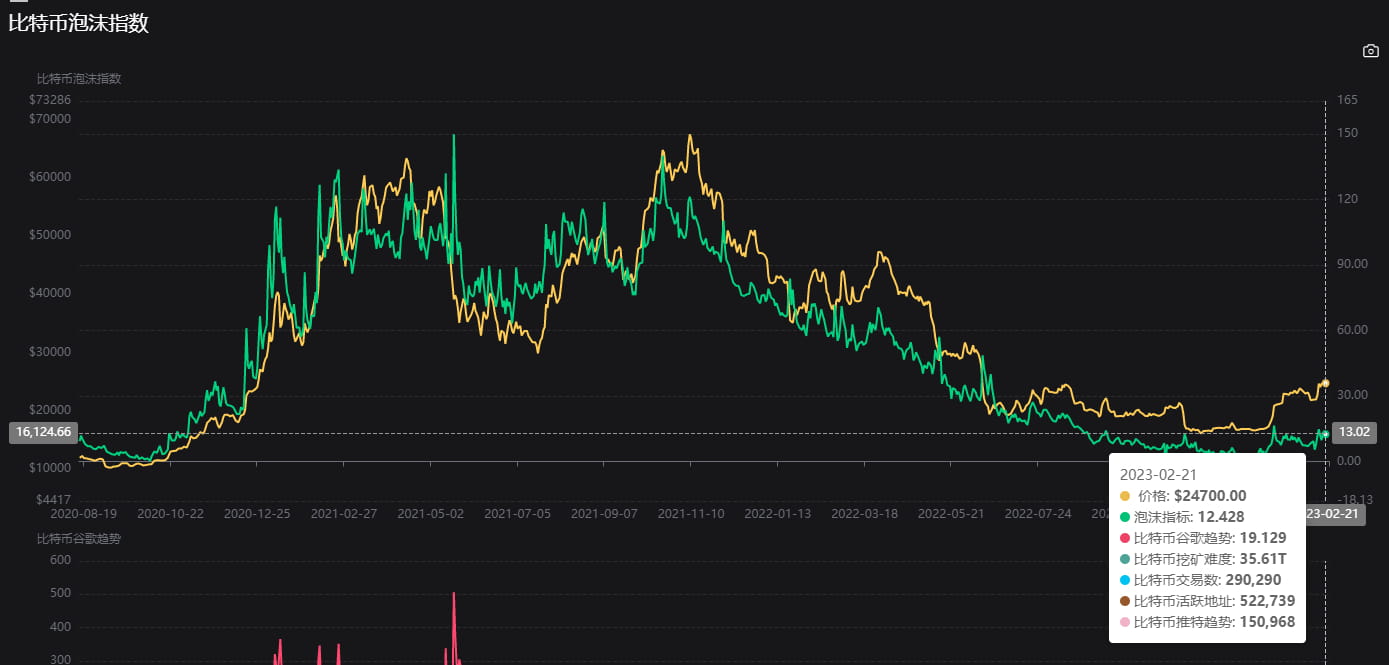
Bitcoin Bubble Index This indicator was created by Ma Chao Terminal and open sourced on Github. This indicator comprehensively considers factors such as the trading market, public opinion, and network activity to assist users in judging the reasonableness of the BTC market price.
Bubble indicator = f (price, 60-day increase, public opinion popularity, computing power difficulty, number of active addresses, number of network transfers)
The higher the bubble indicator, the more the current BTC price deviates from the comprehensive popularity of the trading market, on-chain network, public opinion attention, etc. When the bubble indicator is negative, it may be a good buying opportunity.
The Bitcoin Bubble Index is composed of factors such as Bitcoin Google Trends, Bitcoin Transaction Numbers, Bitcoin Active Addresses, and Bitcoin Twitter Trends.
Throughout history, the Bitcoin Bubble Index has rarely had negative numbers. The only few negative numbers were:
2017.9.4 (Coin Circle 94 Incident)
2018.12.20 (Industry low period)
2020.3.12 (U.S. stock market circuit breaker, COVID-19 epidemic)
2022.10 (FTX thunderstorm impact)
Every time the Bitcoin Bubble Index enters a negative number or falls below 5, the entire market will generally usher in a rebound range and will not go all the way down.
For medium and long-term investors, the Bitcoin bubble indicator is a very suitable indicator to pay attention to. It is very stable and reassuring. If you are pursuing long-term and stable returns, this indicator is very easy to use and a very suitable reference. weather vane.
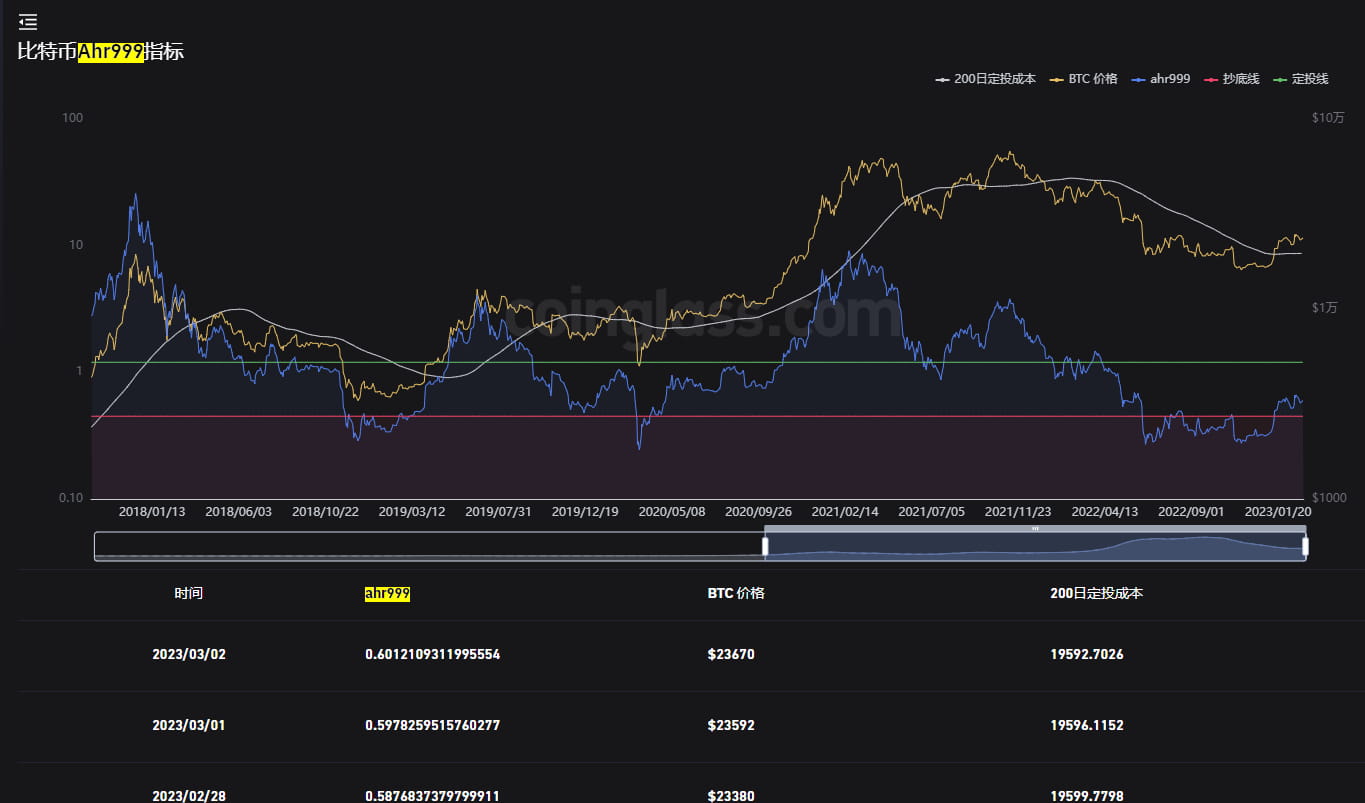
At the same time, the Bitcoin bubble indicator can be used together with the Bitcoin Ahr999 indicator. The Bitcoin Ahr999 indicator is a very interesting indicator, created by the nine gods in the currency circle: ahr999. Its purpose is to assist Bitcoin fixed investment users to make investment decisions based on timing strategies. This indicator implies the return rate of short-term fixed investment in Bitcoin and the deviation of Bitcoin price from expected valuation. From a long-term perspective, the price of Bitcoin is positively correlated with the block height. At the same time, with the advantages of fixed investment, users can also control the cost of short-term fixed investment, so that most of it is below the price of Bitcoin. Data operation: When the price of Bitcoin is lower than both the short-term fixed investment cost and the expected valuation, increasing the investment amount can increase the probability of user income. According to the indicator backtest, if the indicator is lower than 0.45, then it is more suitable for bargain hunting. If it is within the range of 0.45 and 1.2, then it may be suitable for fixed investment in BTC. If it is higher than this range, it means that it is not a good time for fixed investment yet.
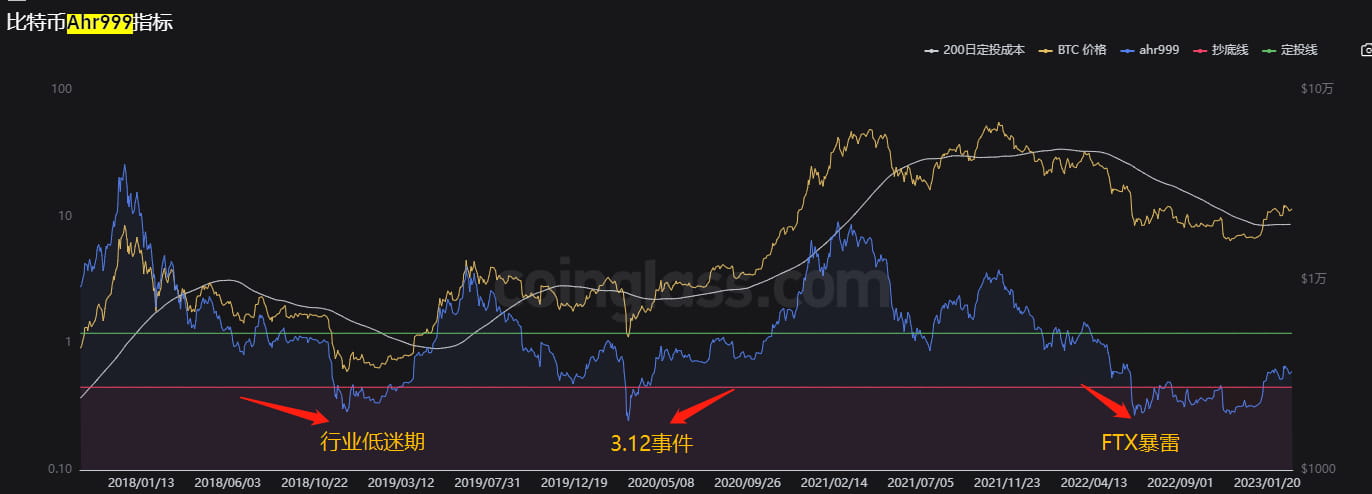
It can be seen that the Bitcoin bubble indicator and the Bitcoin Ahr999 indicator are overlapped. During many events, their data are consistent and the same. The two indicators will be more informative when paired together.
The proper application of these two indicators can be of great help to currency hoarders and mid- to long-term value investors. For short-term and altcoin investors, the impact may not be very great. I hope that the sharing of these two indicators can help Help you.