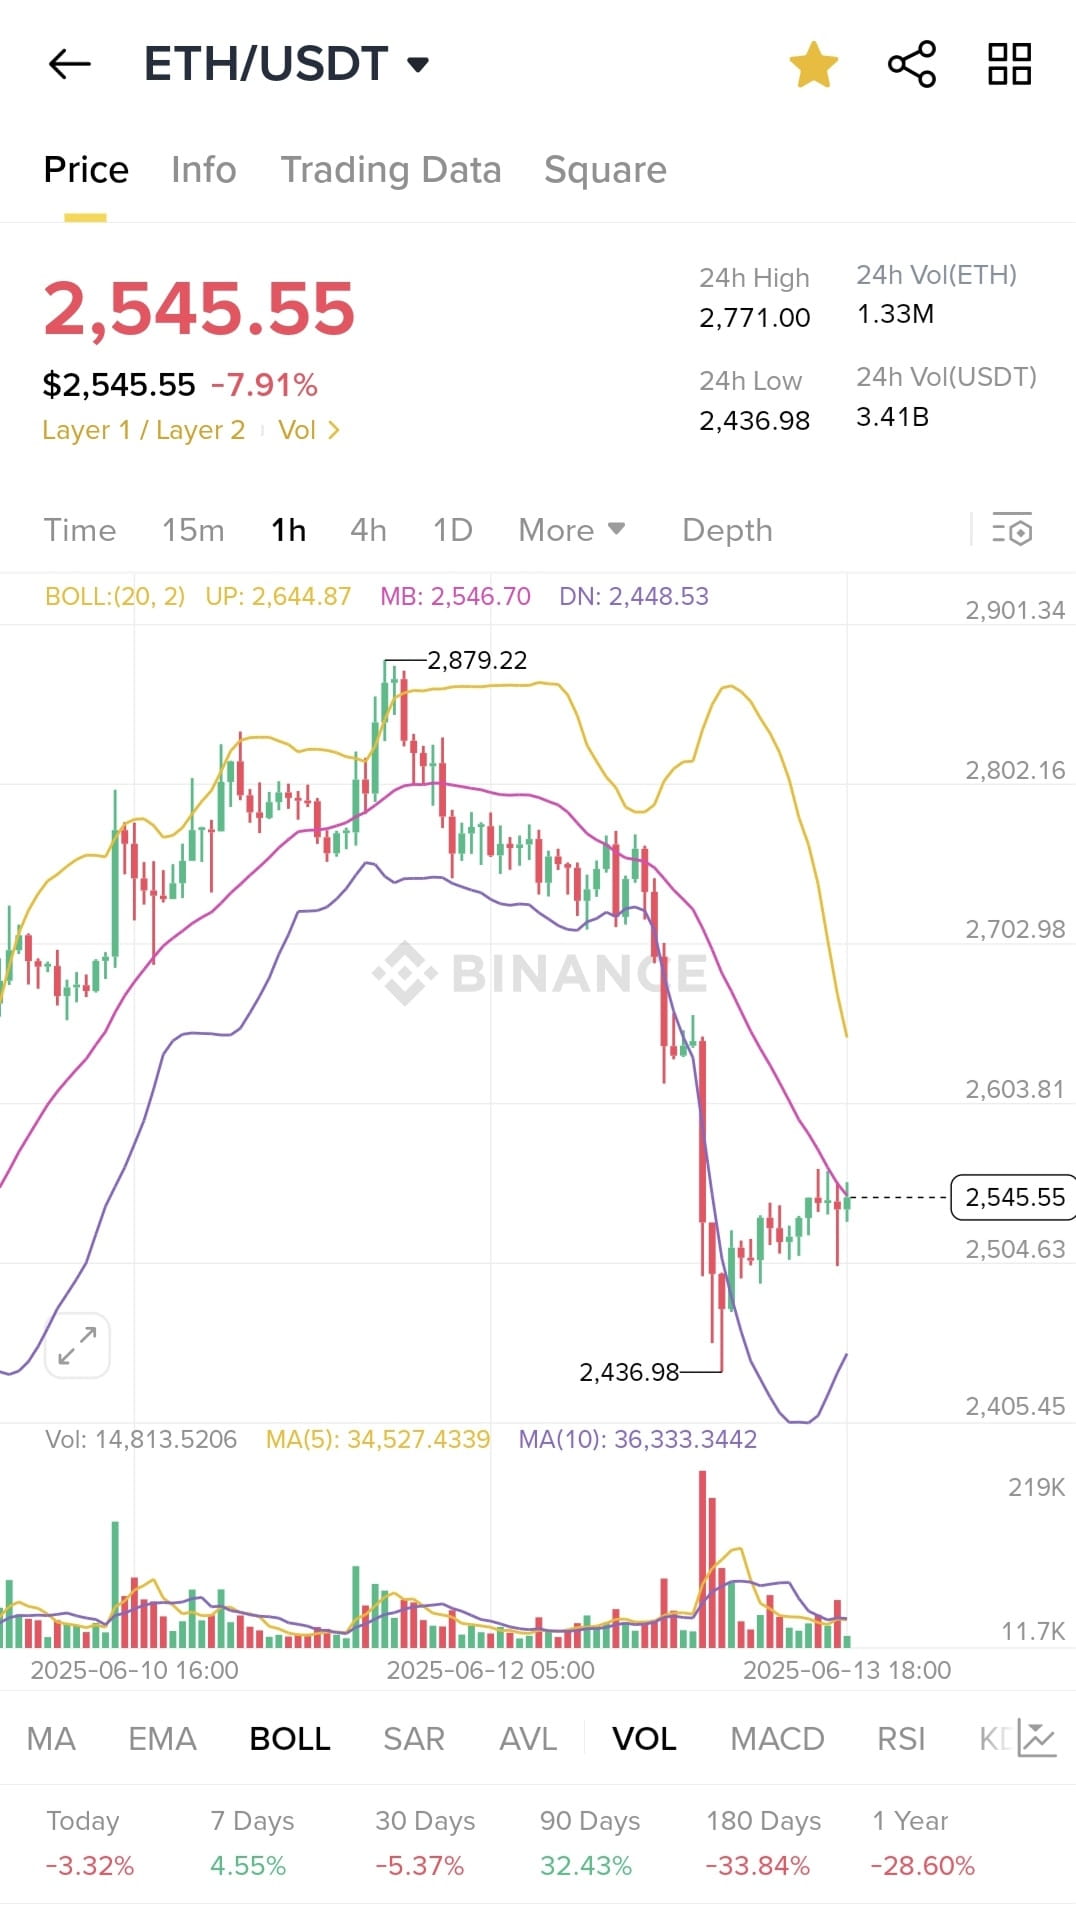
Is there anyone who can understand me Could the price really drop more towards $2,460–$2,480 😫
SoiderX
·
--
🚨 Live Market Update: $ETH Bulls — Time to Regain Momentum 📢 Let’s bring ETH back to life 🔍 Candlestick Pattern Analysis (Last 24 Hours) Over the past 24 hours, ETH’s 1-hour chart has shown multiple signals of indecision and potential reversal: ▪︎ Doji & Spinning Top — clear signs of hesitation between bulls and bears. ▪︎ Long-Legged Doji & High-Wave Candles — indicate strong market volatility, suggesting that a breakout is near. ▪︎ Hanging Man on the 4-hour chart — a bearish reversal signal, especially dangerous if confirmed by a strong red candle.
📉 Current Bearish Threat: ETH has pulled back from yesterday’s high at $2,769+, and is now testing key support levels with no clear direction. 🔻 Bears are trying to take over, fueled by indecision and fear. If no bullish confirmation appears, the price could slide further toward $2,460–$2,480.
🚀 Message to the Bulls: This is the Moment Bulls must act now to: Break the hesitation phase. Reclaim bullish momentum. Target a recovery zone between $2,600–$2,680, pushing back toward the $2,769 resistance level. ✅ A strong bullish engulfing candle or back-to-back green candles on the 1-hour timeframe could shift market sentiment in favor of the bulls.
🧭 Scenarios to Watch: 1️⃣ Bearish Continuation ▪︎ Confirmed red candle after hanging man ▪︎ Likelihood : 50–60% 2️⃣ Sideways Range ▪︎ Continued indecision, no breakout ▪︎ Likelihood: 30–40% 3️⃣ Bullish Reversal ▪︎ Strong green candle with rising volume ▪︎ Likelihood: 10–20% — but rising if bulls step in now
⚠️ Final Note: ETH is not in danger yet, but the market is hesitating at a key decision point. This is the perfect window for bullish traders to: ➡️ Watch for confirmation candles. ➡️ Increase volume and buying pressure. ➡️ Break the bearish sentiment before it takes control. Breakout is one solid candle away. 🌱💥 Buy and Trade here on $ETH