

ZAYDEN_ETH
20.6k Posts

ZAYDEN_ETH
 Square Verified+
Report
Block User
Crypto’s been my rabbit hole since 20XX. Still falling Let's go My x Z_A_Y_D_E_N_777
Open Trade
Frequent Trader
1.5 Years
63 Following
43.4K+ Followers
47.1K+ Liked
Posts
Portfolio
All
Live
·
--
$APR USDT vs $CAP USDT: Which Perp Coin Is Leading the Pack?
Two perpetual contracts are climbing fast on the board right now, and both are posting huge gains in a single session. Let's put them head to head.
APRUSDT (Capricorn) is trading at 0.04025 USDT, roughly Rs11.13, and is up 59.41% on the day. That is a powerful move, and it puts APR at the front of the momentum conversation. A near-60% run shows buyers are stepping in with strong conviction.
CAPUSDT (Cap) is trading at 0.10828 USDT, roughly Rs29.96, and is up 45.30%. It sits behind APR in percentage terms, but a 45% day is still a serious move and shows real demand from traders looking for the next breakout.
APR leads by about 14 percentage points, which is a clear but not impossible gap. If CAP keeps building volume, it could narrow the difference quickly. If APR holds its strength, it could pull further ahead. Gains this large can reverse fast, so risk management matters on both sides.
So the question is simple: APRUSDT or CAPUSDT, which one are you backing? Drop your pick in the comments and tell us why.
{future}(APRUSDT)
{future}(CAPUSDT)
$APR USDT vs $CAP USDT: Which Perp Coin Is Leading the Pack?
Two perpetual contracts are climbing fast on the board right now, and both are posting huge gains in a single session. Let's put them head to head.
APRUSDT (Capricorn) is trading at 0.04025 USDT, roughly Rs11.13, and is up 59.41% on the day. That is a powerful move, and it puts APR at the front of the momentum conversation. A near-60% run shows buyers are stepping in with strong conviction.
CAPUSDT (Cap) is trading at 0.10828 USDT, roughly Rs29.96, and is up 45.30%. It sits behind APR in percentage terms, but a 45% day is still a serious move and shows real demand from traders looking for the next breakout.
APR leads by about 14 percentage points, which is a clear but not impossible gap. If CAP keeps building volume, it could narrow the difference quickly. If APR holds its strength, it could pull further ahead. Gains this large can reverse fast, so risk management matters on both sides.
So the question is simple: APRUSDT or CAPUSDT, which one are you backing? Drop your pick in the comments and tell us why.
Two perpetual contracts are climbing fast on the board right now, and both are posting huge gains in a single session. Let's put them head to head.
APRUSDT (Capricorn) is trading at 0.04025 USDT, roughly Rs11.13, and is up 59.41% on the day. That is a powerful move, and it puts APR at the front of the momentum conversation. A near-60% run shows buyers are stepping in with strong conviction.
CAPUSDT (Cap) is trading at 0.10828 USDT, roughly Rs29.96, and is up 45.30%. It sits behind APR in percentage terms, but a 45% day is still a serious move and shows real demand from traders looking for the next breakout.
APR leads by about 14 percentage points, which is a clear but not impossible gap. If CAP keeps building volume, it could narrow the difference quickly. If APR holds its strength, it could pull further ahead. Gains this large can reverse fast, so risk management matters on both sides.
So the question is simple: APRUSDT or CAPUSDT, which one are you backing? Drop your pick in the comments and tell us why.
Which coin pumps more today
CAPUSDT
APRUSDT
1 hr(s) left
1.3k
·
--
Bearish
$IN / USDT Perp | INFINIT: Big Volatility Alert
$IN is on the move and the chart is not quiet
If you are watching the 15m timeframe you already know this has been a sharp fall
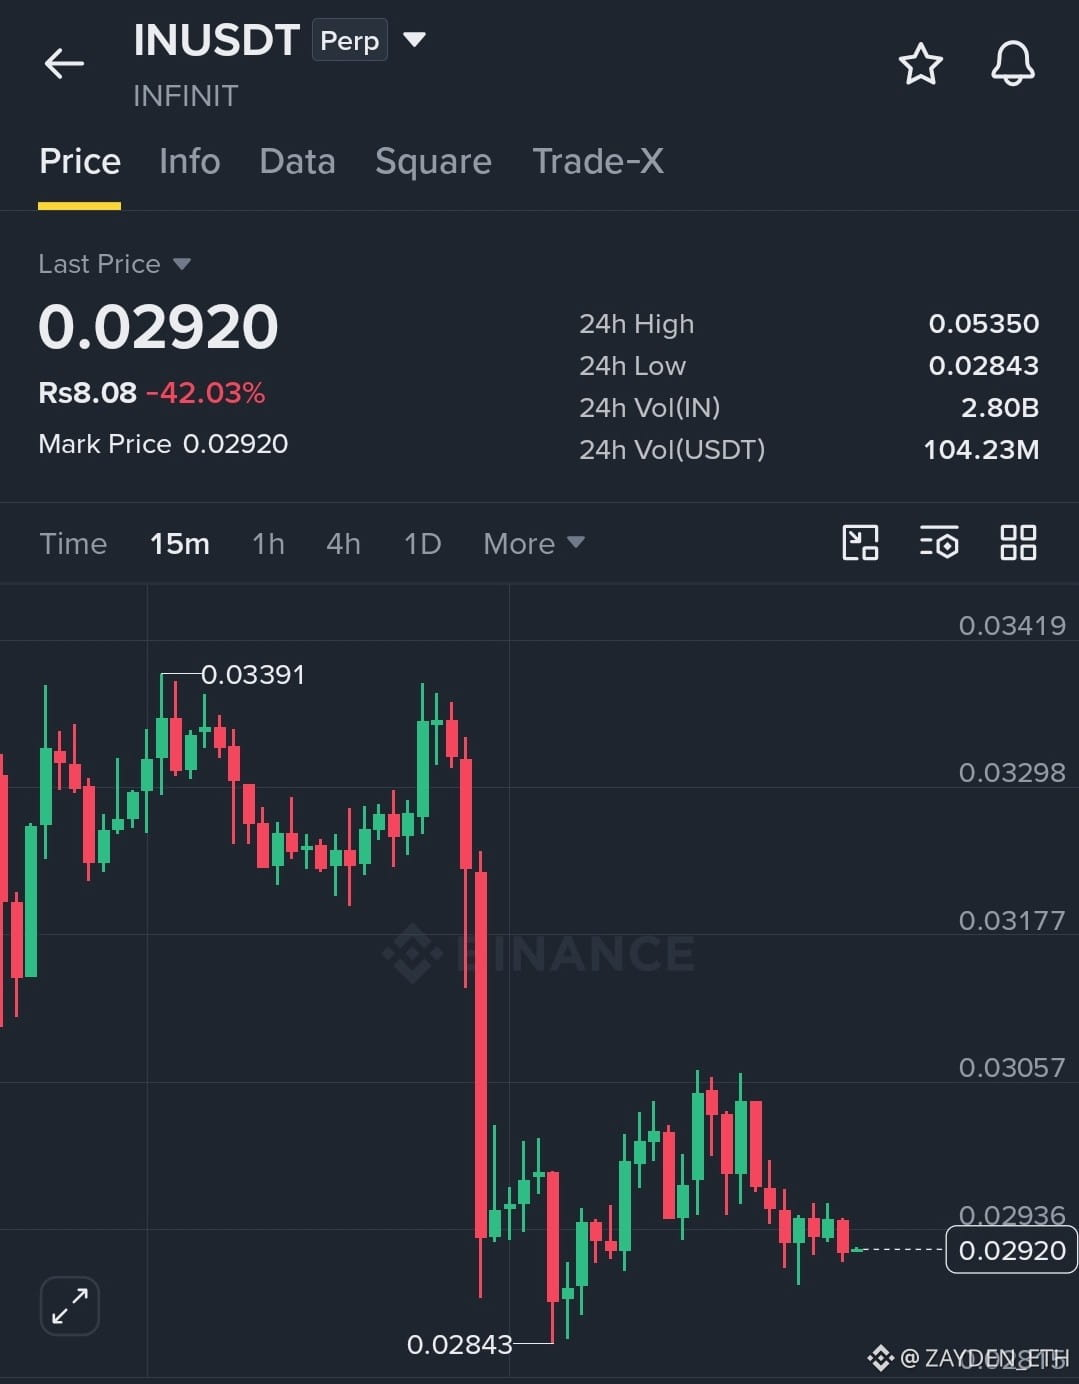
Last Price is $0.02920 (about PKR8.08), down -42.03% in the last 24h, with Mark Price at $0.02920
24h High sits at $0.05350 and 24h Low at $0.02843
24h Volume is 2.80B IN, or $104.23M in USDT
Price was holding in a range near $0.030 to $0.034 with choppy candles and a swing high of $0.03391
Then sellers took over hard with a massive red candle that crashed price straight down toward $0.0304
A sharp wick hit a low of $0.02843 where buyers finally stepped in and sparked a bounce
Price climbed back up toward $0.0306, but sellers pressed again and dragged it lower step by step
Right now IN is sitting around $0.02920 near the bottom of the recent range
The heavy selling has cooled off and the market is deciding if this is a bottom forming or more downside ahead
Support is at $0.02936 with $0.02843 as the 24h low and key floor on this chart, and $0.02815 just below it
Resistance is at $0.03057 with $0.03177 above it, and $0.03391 as the earlier swing high
A clean move above $0.03057 with volume could bring momentum back
A loss of $0.02843 could open the door to fresh lows
With $104.23M in USDT volume in 24 hours this is not a sleepy chart
Liquidity is there, volatility is there, and setups are forming on every timeframe
Volatility means opportunity but it also means risk
Use a stop loss, size your position wisely, and never trade money you cannot afford to lose
Not financial advice, always do your own research and trade responsibly
Let's go and trade now $IN
{future}(INUSDT)
$IN / USDT Perp | INFINIT: Big Volatility Alert
$IN is on the move and the chart is not quiet
If you are watching the 15m timeframe you already know this has been a sharp fall
Last Price is $0.02920 (about PKR8.08), down -42.03% in the last 24h, with Mark Price at $0.02920
24h High sits at $0.05350 and 24h Low at $0.02843
24h Volume is 2.80B IN, or $104.23M in USDT
Price was holding in a range near $0.030 to $0.034 with choppy candles and a swing high of $0.03391
Then sellers took over hard with a massive red candle that crashed price straight down toward $0.0304
A sharp wick hit a low of $0.02843 where buyers finally stepped in and sparked a bounce
Price climbed back up toward $0.0306, but sellers pressed again and dragged it lower step by step
Right now IN is sitting around $0.02920 near the bottom of the recent range
The heavy selling has cooled off and the market is deciding if this is a bottom forming or more downside ahead
Support is at $0.02936 with $0.02843 as the 24h low and key floor on this chart, and $0.02815 just below it
Resistance is at $0.03057 with $0.03177 above it, and $0.03391 as the earlier swing high
A clean move above $0.03057 with volume could bring momentum back
A loss of $0.02843 could open the door to fresh lows
With $104.23M in USDT volume in 24 hours this is not a sleepy chart
Liquidity is there, volatility is there, and setups are forming on every timeframe
Volatility means opportunity but it also means risk
Use a stop loss, size your position wisely, and never trade money you cannot afford to lose
Not financial advice, always do your own research and trade responsibly
Let's go and trade now $IN
$IN is on the move and the chart is not quiet
If you are watching the 15m timeframe you already know this has been a sharp fall
Last Price is $0.02920 (about PKR8.08), down -42.03% in the last 24h, with Mark Price at $0.02920
24h High sits at $0.05350 and 24h Low at $0.02843
24h Volume is 2.80B IN, or $104.23M in USDT
Price was holding in a range near $0.030 to $0.034 with choppy candles and a swing high of $0.03391
Then sellers took over hard with a massive red candle that crashed price straight down toward $0.0304
A sharp wick hit a low of $0.02843 where buyers finally stepped in and sparked a bounce
Price climbed back up toward $0.0306, but sellers pressed again and dragged it lower step by step
Right now IN is sitting around $0.02920 near the bottom of the recent range
The heavy selling has cooled off and the market is deciding if this is a bottom forming or more downside ahead
Support is at $0.02936 with $0.02843 as the 24h low and key floor on this chart, and $0.02815 just below it
Resistance is at $0.03057 with $0.03177 above it, and $0.03391 as the earlier swing high
A clean move above $0.03057 with volume could bring momentum back
A loss of $0.02843 could open the door to fresh lows
With $104.23M in USDT volume in 24 hours this is not a sleepy chart
Liquidity is there, volatility is there, and setups are forming on every timeframe
Volatility means opportunity but it also means risk
Use a stop loss, size your position wisely, and never trade money you cannot afford to lose
Not financial advice, always do your own research and trade responsibly
Let's go and trade now $IN
1
520
·
--
$BIRB / USDT Perp: Big Volatility Alert
$BIRB is on the move and the chart is not quiet
If you are watching the 15m timeframe you already know this has been a brutal fall
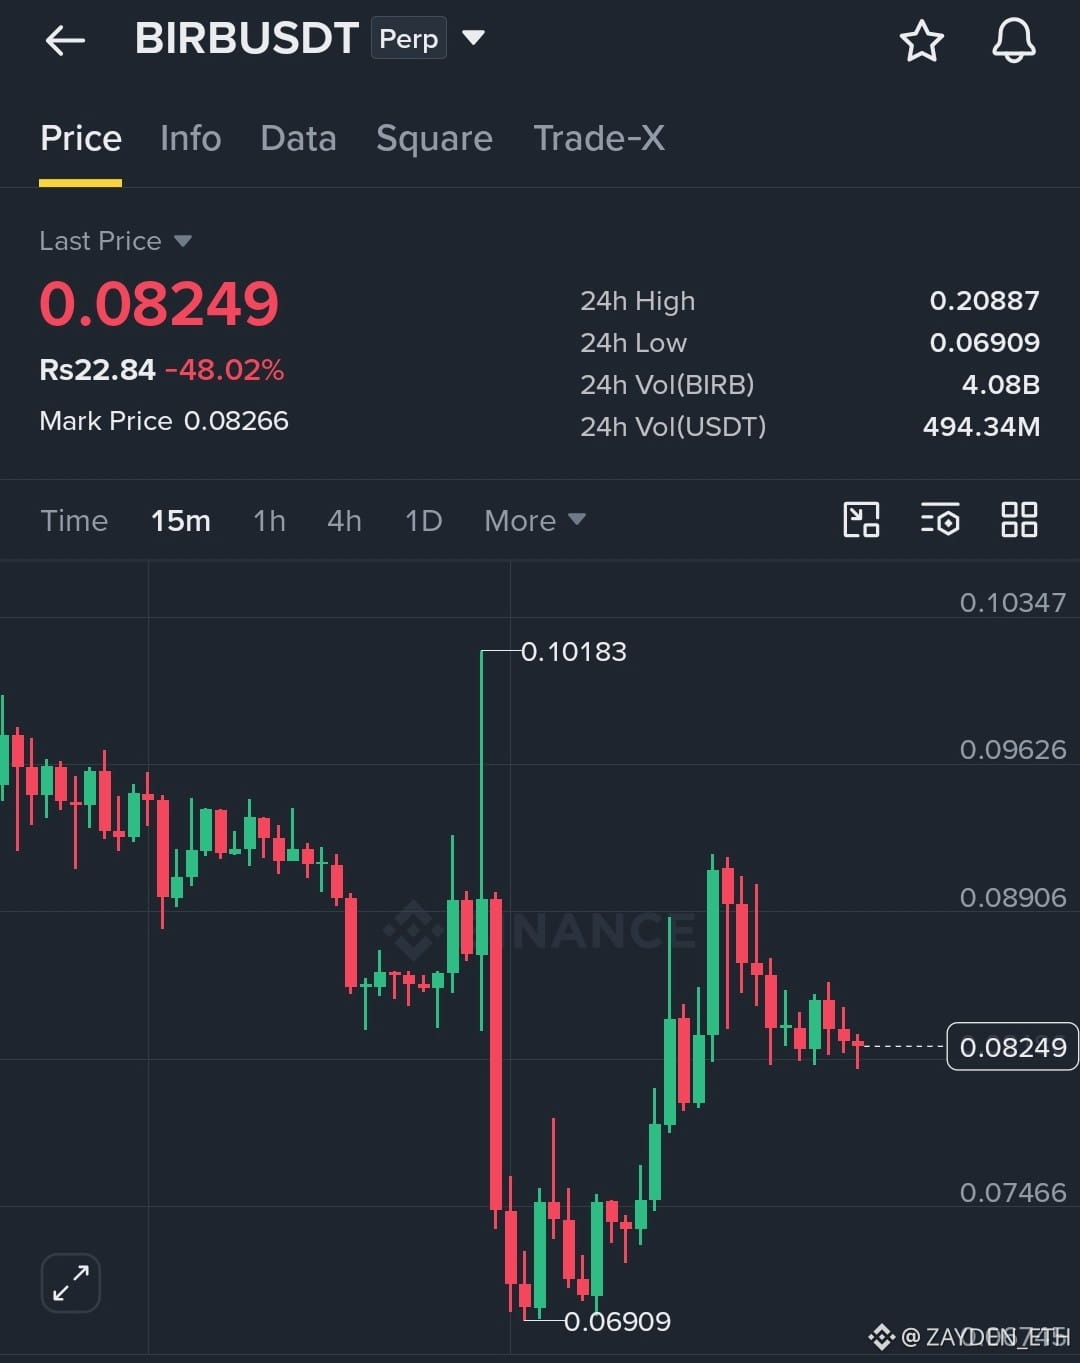
Last Price is $0.08249 (about PKR22.84), down -48.02% in the last 24h, with Mark Price at $0.08266
24h High sits at $0.20887 and 24h Low at $0.06909
24h Volume is 4.08B BIRB, or $494.34M in USDT
Price slid steadily lower from the open with a grind of red and green candles toward the $0.088 zone
A sharp wick spiked up to $0.10183 and sellers slammed it right back down with a massive red candle
The drop crashed all the way to a low of $0.06909 where buyers finally stepped in
A strong bounce followed with green candles pushing price back up toward $0.088, but sellers hit back again
Right now BIRB is sitting around $0.08249 after a wild swing between the lows and the bounce
The market is deciding if this is a bottom forming or more downside ahead
Support is at $0.07466 with $0.06909 as the 24h low and key floor on this chart
Resistance is at $0.08906 with $0.09626 above it, and $0.10183 and $0.10347 as the spike highs
A clean move above $0.08906 with volume could bring momentum back
A loss of $0.07466 could open the door to fresh lows
With $494.34M in USDT volume in 24 hours this is not a sleepy chart
Liquidity is there, volatility is there, and setups are forming on every timeframe
Volatility means opportunity but it also means risk
Use a stop loss, size your position wisely, and never trade money you cannot afford to lose
Not financial advice, always do your own research and trade responsibly
Let's go and trade now $BIRB
{future}(BIRBUSDT)
$BIRB / USDT Perp: Big Volatility Alert
$BIRB is on the move and the chart is not quiet
If you are watching the 15m timeframe you already know this has been a brutal fall
Last Price is $0.08249 (about PKR22.84), down -48.02% in the last 24h, with Mark Price at $0.08266
24h High sits at $0.20887 and 24h Low at $0.06909
24h Volume is 4.08B BIRB, or $494.34M in USDT
Price slid steadily lower from the open with a grind of red and green candles toward the $0.088 zone
A sharp wick spiked up to $0.10183 and sellers slammed it right back down with a massive red candle
The drop crashed all the way to a low of $0.06909 where buyers finally stepped in
A strong bounce followed with green candles pushing price back up toward $0.088, but sellers hit back again
Right now BIRB is sitting around $0.08249 after a wild swing between the lows and the bounce
The market is deciding if this is a bottom forming or more downside ahead
Support is at $0.07466 with $0.06909 as the 24h low and key floor on this chart
Resistance is at $0.08906 with $0.09626 above it, and $0.10183 and $0.10347 as the spike highs
A clean move above $0.08906 with volume could bring momentum back
A loss of $0.07466 could open the door to fresh lows
With $494.34M in USDT volume in 24 hours this is not a sleepy chart
Liquidity is there, volatility is there, and setups are forming on every timeframe
Volatility means opportunity but it also means risk
Use a stop loss, size your position wisely, and never trade money you cannot afford to lose
Not financial advice, always do your own research and trade responsibly
Let's go and trade now $BIRB
$BIRB is on the move and the chart is not quiet
If you are watching the 15m timeframe you already know this has been a brutal fall
Last Price is $0.08249 (about PKR22.84), down -48.02% in the last 24h, with Mark Price at $0.08266
24h High sits at $0.20887 and 24h Low at $0.06909
24h Volume is 4.08B BIRB, or $494.34M in USDT
Price slid steadily lower from the open with a grind of red and green candles toward the $0.088 zone
A sharp wick spiked up to $0.10183 and sellers slammed it right back down with a massive red candle
The drop crashed all the way to a low of $0.06909 where buyers finally stepped in
A strong bounce followed with green candles pushing price back up toward $0.088, but sellers hit back again
Right now BIRB is sitting around $0.08249 after a wild swing between the lows and the bounce
The market is deciding if this is a bottom forming or more downside ahead
Support is at $0.07466 with $0.06909 as the 24h low and key floor on this chart
Resistance is at $0.08906 with $0.09626 above it, and $0.10183 and $0.10347 as the spike highs
A clean move above $0.08906 with volume could bring momentum back
A loss of $0.07466 could open the door to fresh lows
With $494.34M in USDT volume in 24 hours this is not a sleepy chart
Liquidity is there, volatility is there, and setups are forming on every timeframe
Volatility means opportunity but it also means risk
Use a stop loss, size your position wisely, and never trade money you cannot afford to lose
Not financial advice, always do your own research and trade responsibly
Let's go and trade now $BIRB
1
297
·
--
$JCT USDT vs $ORDER USDT: Which Perp Coin Is Running the Show?
Two perpetual contracts are dominating the board right now, and both have posted triple-digit or near-triple-digit style moves in a single session. Let's put them head to head.
JCTUSDT (Janction) is trading at 0.007143 USDT, roughly Rs1.97, and is up 147.93% on the day. That is a massive breakout. A gain of nearly 150% in one session puts JCT at the top of the momentum conversation and shows buyers are stepping in with extreme conviction.
ORDERUSDT (Orderly) is trading at 0.05898 USDT, roughly Rs16.32, and is up 77.76%. That is a very strong run by any standard, and it keeps ORDER firmly in the spotlight after its earlier surge. It sits behind JCT in percentage terms, but a near-78% day still reflects serious demand and plenty of trader interest.
JCT leads by about 70 percentage points, which is a wide gap. For ORDER to close it, it would need a sharp second leg up with heavy volume. For JCT, the question is whether it can hold these levels after such a vertical move. Gains this large can reverse quickly, so risk management matters on both sides.
So the question is simple: JCTUSDT or ORDERUSDT, which one are you backing? Drop your pick in the comments and tell us why.
{future}(JCTUSDT)
{future}(ORDERUSDT)
$JCT USDT vs $ORDER USDT: Which Perp Coin Is Running the Show?
Two perpetual contracts are dominating the board right now, and both have posted triple-digit or near-triple-digit style moves in a single session. Let's put them head to head.
JCTUSDT (Janction) is trading at 0.007143 USDT, roughly Rs1.97, and is up 147.93% on the day. That is a massive breakout. A gain of nearly 150% in one session puts JCT at the top of the momentum conversation and shows buyers are stepping in with extreme conviction.
ORDERUSDT (Orderly) is trading at 0.05898 USDT, roughly Rs16.32, and is up 77.76%. That is a very strong run by any standard, and it keeps ORDER firmly in the spotlight after its earlier surge. It sits behind JCT in percentage terms, but a near-78% day still reflects serious demand and plenty of trader interest.
JCT leads by about 70 percentage points, which is a wide gap. For ORDER to close it, it would need a sharp second leg up with heavy volume. For JCT, the question is whether it can hold these levels after such a vertical move. Gains this large can reverse quickly, so risk management matters on both sides.
So the question is simple: JCTUSDT or ORDERUSDT, which one are you backing? Drop your pick in the comments and tell us why.
Two perpetual contracts are dominating the board right now, and both have posted triple-digit or near-triple-digit style moves in a single session. Let's put them head to head.
JCTUSDT (Janction) is trading at 0.007143 USDT, roughly Rs1.97, and is up 147.93% on the day. That is a massive breakout. A gain of nearly 150% in one session puts JCT at the top of the momentum conversation and shows buyers are stepping in with extreme conviction.
ORDERUSDT (Orderly) is trading at 0.05898 USDT, roughly Rs16.32, and is up 77.76%. That is a very strong run by any standard, and it keeps ORDER firmly in the spotlight after its earlier surge. It sits behind JCT in percentage terms, but a near-78% day still reflects serious demand and plenty of trader interest.
JCT leads by about 70 percentage points, which is a wide gap. For ORDER to close it, it would need a sharp second leg up with heavy volume. For JCT, the question is whether it can hold these levels after such a vertical move. Gains this large can reverse quickly, so risk management matters on both sides.
So the question is simple: JCTUSDT or ORDERUSDT, which one are you backing? Drop your pick in the comments and tell us why.
Which coin pumps more today?**
6%
JCTUSDT
47%
ORDERUSDT
47%
36 votes • Voting closed
2
1.4k
·
--
$ORDER USDT vs $BMT USDT: Which Perp Coin Is Dominating the Board?
Two perpetual contracts are making serious noise right now, and one of them has more than doubled in a single session. Let's put them head to head.
ORDERUSDT (Orderly) is trading at 0.07002 USDT, roughly Rs19.38, and is up 116.51% on the day. That is an enormous move. A gain above 100% in one session puts ORDER in a league of its own and shows buyers are stepping in with extreme conviction. Momentum here is clearly the strongest on the board.
BMTUSDT (Bubblemaps) is trading at 0.03750 USDT, roughly Rs10.38, and is up 60.53%. That is a very strong run on its own, and under normal conditions it would be the headline story. Here it sits well behind ORDER, but a 60% day still shows real demand and plenty of trader interest.
ORDER leads by about 56 percentage points, which is a wide gap. For BMT to close it, it would need a sharp second leg up with heavy volume. For ORDER, the question is whether it can hold these levels after doubling. Moves this large can reverse quickly, so risk management matters on both sides.
So the question is simple: ORDERUSDT or BMTUSDT, which one are you backing? Drop your pick in the comments and tell us why.
{future}(ORDERUSDT)
{spot}(BMTUSDT)
$ORDER USDT vs $BMT USDT: Which Perp Coin Is Dominating the Board?
Two perpetual contracts are making serious noise right now, and one of them has more than doubled in a single session. Let's put them head to head.
ORDERUSDT (Orderly) is trading at 0.07002 USDT, roughly Rs19.38, and is up 116.51% on the day. That is an enormous move. A gain above 100% in one session puts ORDER in a league of its own and shows buyers are stepping in with extreme conviction. Momentum here is clearly the strongest on the board.
BMTUSDT (Bubblemaps) is trading at 0.03750 USDT, roughly Rs10.38, and is up 60.53%. That is a very strong run on its own, and under normal conditions it would be the headline story. Here it sits well behind ORDER, but a 60% day still shows real demand and plenty of trader interest.
ORDER leads by about 56 percentage points, which is a wide gap. For BMT to close it, it would need a sharp second leg up with heavy volume. For ORDER, the question is whether it can hold these levels after doubling. Moves this large can reverse quickly, so risk management matters on both sides.
So the question is simple: ORDERUSDT or BMTUSDT, which one are you backing? Drop your pick in the comments and tell us why.
Two perpetual contracts are making serious noise right now, and one of them has more than doubled in a single session. Let's put them head to head.
ORDERUSDT (Orderly) is trading at 0.07002 USDT, roughly Rs19.38, and is up 116.51% on the day. That is an enormous move. A gain above 100% in one session puts ORDER in a league of its own and shows buyers are stepping in with extreme conviction. Momentum here is clearly the strongest on the board.
BMTUSDT (Bubblemaps) is trading at 0.03750 USDT, roughly Rs10.38, and is up 60.53%. That is a very strong run on its own, and under normal conditions it would be the headline story. Here it sits well behind ORDER, but a 60% day still shows real demand and plenty of trader interest.
ORDER leads by about 56 percentage points, which is a wide gap. For BMT to close it, it would need a sharp second leg up with heavy volume. For ORDER, the question is whether it can hold these levels after doubling. Moves this large can reverse quickly, so risk management matters on both sides.
So the question is simple: ORDERUSDT or BMTUSDT, which one are you backing? Drop your pick in the comments and tell us why.
Which coin pumps more today?
6%
ORDERUSDT
63%
BMTUSDT
31%
62 votes • Voting closed
8
4.2k
·
--

Article
SEAPumpkinFrenzy: How Binance Is Bringing Creativity and Community Into Web3I’ve seen how the crypto industry often focuses on trading, market movements, and new tokens, but I believe there’s another side that deserves attention. It’s about people, creativity, and the communities that make this industry feel alive. That’s one reason why SEAPumpkinFrenzy caught my attention. It brings a creative Halloween theme into the Binance community and gives participants an opportunity to share their ideas while competing for digital rewards.
How It Works
I’ve noticed that getting involved in crypto communities can sometimes feel difficult for beginners. There are so many new terms and technologies to understand. However, SEAPumpkinFrenzy offers a more creative way to participate. According to the campaign announcement, participants are asked to create an original Halloween photograph featuring visible Binance branding, write a story of at least 500 words, and publish it on Binance Square using the hashtag #SEAPumpkinFrenzy.
Participants must also share their posts in the relevant Binance Chat Group and submit the required information through the official campaign form. The announced campaign runs from October 20 to October 30, 2026, with a total prize pool of 600 USDC.
I believe this approach makes participation more interesting because people can express themselves instead of simply following market discussions. Every participant has an opportunity to bring something different, whether it’s an original story, a creative photograph, or a personal idea.
Technology and Ecosystem Design
I’ve seen many discussions about Web3 technology, but I think the most useful systems are those that people can understand and use without unnecessary difficulty.
SEAPumpkinFrenzy uses existing Binance services rather than a separately documented blockchain network. Binance Square provides the space for publishing content, Binance Chat Groups help participants share their entries, and the official submission form supports the campaign review process. Selected participants receive rewards through Binance’s Rewards Hub.
This structure connects content creation, community participation, and digital rewards in one experience. It doesn’t require participants to build applications or understand complicated blockchain operations before joining.
It’s also important to understand that the available campaign information doesn’t confirm a dedicated SEAPumpkinFrenzy blockchain or a separate smart contract system. I believe being clear about the actual technology is essential because people deserve accurate information about the projects and campaigns they explore.
Sometimes, innovation isn’t about creating something complicated. It’s about using existing tools to make participation easier and more enjoyable.
Utility and Rewards
One thing I find interesting about SEAPumpkinFrenzy is its advertised 600 USDC prize pool. The published rewards range from 90 USDC for first place to smaller rewards for other selected participants.
USDC is a digital asset designed to maintain a value close to one US dollar. It can be used for supported digital transfers, payments, and other financial activities. Unlike many cryptocurrencies, it is designed to avoid the large price fluctuations commonly associated with more volatile digital assets, although risks still exist.
I think using an established digital asset for rewards makes the campaign easier to understand. Participants don’t need to learn the purpose of a new cryptocurrency to understand what the advertised reward represents.
However, I haven’t found verified information confirming that SEAPumpkinFrenzy has its own native token. Its documented reward system uses USDC token vouchers, so claims about a separate token, staking, governance, or token burning would be unsupported.
Adoption and Community Growth
I believe community participation can play an important role in bringing more people into Web3. Someone might initially join because they enjoy photography or writing, but their experience could encourage them to explore more of the Binance ecosystem.
I’ve seen how a welcoming environment can make unfamiliar technology feel less intimidating. When people can share ideas, discover other creators, and participate without needing advanced technical knowledge, they may become more comfortable learning about digital assets.
Of course, participation doesn’t guarantee long-term adoption. A campaign can attract attention for a short time, but meaningful growth depends on whether people find lasting value in the experience.
For me, the real opportunity is to turn temporary excitement into stronger communities, better understanding, and continued participation.
What Comes Next
I’m interested in seeing how community campaigns can continue to improve the way people experience Web3. Better content discovery, clearer participation rules, useful educational material, and transparent reward systems could make future campaigns more valuable.
If this happens, people may have more reasons to return even after a campaign ends. They could continue learning, creating content, and connecting with others who share their interests.
However, I haven’t seen a verified roadmap confirming a separate SEAPumpkinFrenzy token or an independent blockchain. Its future development should be judged through official announcements rather than assumptions.
Final Thoughts
I believe SEAPumpkinFrenzy highlights an important idea: Web3 isn’t only about technology or digital assets. It’s also about the people who participate, share their creativity, and help communities grow.
I’ve seen how complicated the crypto world can appear to newcomers, which is why accessible experiences matter. A simple creative campaign can give people a reason to participate, express themselves, and discover something new.
Ultimately, the future of Web3 will depend on more than new tokens or advanced technology. It will depend on whether people find genuine value, trust the systems they use, and feel encouraged to contribute.
For me, the real power of Web3 lies in bringing technology and people together. When creativity meets community and participation creates real value, the future becomes more than a technological idea. It becomes something we can build together.
#SEAPumpkinFrenzy
$IRYS
{future}(IRYSUSDT)
SEAPumpkinFrenzy: How Binance Is Bringing Creativity and Community Into Web3
I’ve seen how the crypto industry often focuses on trading, market movements, and new tokens, but I believe there’s another side that deserves attention. It’s about people, creativity, and the communities that make this industry feel alive. That’s one reason why SEAPumpkinFrenzy caught my attention. It brings a creative Halloween theme into the Binance community and gives participants an opportunity to share their ideas while competing for digital rewards.
How It Works
I’ve noticed that getting involved in crypto communities can sometimes feel difficult for beginners. There are so many new terms and technologies to understand. However, SEAPumpkinFrenzy offers a more creative way to participate. According to the campaign announcement, participants are asked to create an original Halloween photograph featuring visible Binance branding, write a story of at least 500 words, and publish it on Binance Square using the hashtag #SEAPumpkinFrenzy.
Participants must also share their posts in the relevant Binance Chat Group and submit the required information through the official campaign form. The announced campaign runs from October 20 to October 30, 2026, with a total prize pool of 600 USDC.
I believe this approach makes participation more interesting because people can express themselves instead of simply following market discussions. Every participant has an opportunity to bring something different, whether it’s an original story, a creative photograph, or a personal idea.
Technology and Ecosystem Design
I’ve seen many discussions about Web3 technology, but I think the most useful systems are those that people can understand and use without unnecessary difficulty.
SEAPumpkinFrenzy uses existing Binance services rather than a separately documented blockchain network. Binance Square provides the space for publishing content, Binance Chat Groups help participants share their entries, and the official submission form supports the campaign review process. Selected participants receive rewards through Binance’s Rewards Hub.
This structure connects content creation, community participation, and digital rewards in one experience. It doesn’t require participants to build applications or understand complicated blockchain operations before joining.
It’s also important to understand that the available campaign information doesn’t confirm a dedicated SEAPumpkinFrenzy blockchain or a separate smart contract system. I believe being clear about the actual technology is essential because people deserve accurate information about the projects and campaigns they explore.
Sometimes, innovation isn’t about creating something complicated. It’s about using existing tools to make participation easier and more enjoyable.
Utility and Rewards
One thing I find interesting about SEAPumpkinFrenzy is its advertised 600 USDC prize pool. The published rewards range from 90 USDC for first place to smaller rewards for other selected participants.
USDC is a digital asset designed to maintain a value close to one US dollar. It can be used for supported digital transfers, payments, and other financial activities. Unlike many cryptocurrencies, it is designed to avoid the large price fluctuations commonly associated with more volatile digital assets, although risks still exist.
I think using an established digital asset for rewards makes the campaign easier to understand. Participants don’t need to learn the purpose of a new cryptocurrency to understand what the advertised reward represents.
However, I haven’t found verified information confirming that SEAPumpkinFrenzy has its own native token. Its documented reward system uses USDC token vouchers, so claims about a separate token, staking, governance, or token burning would be unsupported.
Adoption and Community Growth
I believe community participation can play an important role in bringing more people into Web3. Someone might initially join because they enjoy photography or writing, but their experience could encourage them to explore more of the Binance ecosystem.
I’ve seen how a welcoming environment can make unfamiliar technology feel less intimidating. When people can share ideas, discover other creators, and participate without needing advanced technical knowledge, they may become more comfortable learning about digital assets.
Of course, participation doesn’t guarantee long-term adoption. A campaign can attract attention for a short time, but meaningful growth depends on whether people find lasting value in the experience.
For me, the real opportunity is to turn temporary excitement into stronger communities, better understanding, and continued participation.
What Comes Next
I’m interested in seeing how community campaigns can continue to improve the way people experience Web3. Better content discovery, clearer participation rules, useful educational material, and transparent reward systems could make future campaigns more valuable.
If this happens, people may have more reasons to return even after a campaign ends. They could continue learning, creating content, and connecting with others who share their interests.
However, I haven’t seen a verified roadmap confirming a separate SEAPumpkinFrenzy token or an independent blockchain. Its future development should be judged through official announcements rather than assumptions.
Final Thoughts
I believe SEAPumpkinFrenzy highlights an important idea: Web3 isn’t only about technology or digital assets. It’s also about the people who participate, share their creativity, and help communities grow.
I’ve seen how complicated the crypto world can appear to newcomers, which is why accessible experiences matter. A simple creative campaign can give people a reason to participate, express themselves, and discover something new.
Ultimately, the future of Web3 will depend on more than new tokens or advanced technology. It will depend on whether people find genuine value, trust the systems they use, and feel encouraged to contribute.
For me, the real power of Web3 lies in bringing technology and people together. When creativity meets community and participation creates real value, the future becomes more than a technological idea. It becomes something we can build together.
#SEAPumpkinFrenzy
$IRYS
How It Works
I’ve noticed that getting involved in crypto communities can sometimes feel difficult for beginners. There are so many new terms and technologies to understand. However, SEAPumpkinFrenzy offers a more creative way to participate. According to the campaign announcement, participants are asked to create an original Halloween photograph featuring visible Binance branding, write a story of at least 500 words, and publish it on Binance Square using the hashtag #SEAPumpkinFrenzy.
Participants must also share their posts in the relevant Binance Chat Group and submit the required information through the official campaign form. The announced campaign runs from October 20 to October 30, 2026, with a total prize pool of 600 USDC.
I believe this approach makes participation more interesting because people can express themselves instead of simply following market discussions. Every participant has an opportunity to bring something different, whether it’s an original story, a creative photograph, or a personal idea.
Technology and Ecosystem Design
I’ve seen many discussions about Web3 technology, but I think the most useful systems are those that people can understand and use without unnecessary difficulty.
SEAPumpkinFrenzy uses existing Binance services rather than a separately documented blockchain network. Binance Square provides the space for publishing content, Binance Chat Groups help participants share their entries, and the official submission form supports the campaign review process. Selected participants receive rewards through Binance’s Rewards Hub.
This structure connects content creation, community participation, and digital rewards in one experience. It doesn’t require participants to build applications or understand complicated blockchain operations before joining.
It’s also important to understand that the available campaign information doesn’t confirm a dedicated SEAPumpkinFrenzy blockchain or a separate smart contract system. I believe being clear about the actual technology is essential because people deserve accurate information about the projects and campaigns they explore.
Sometimes, innovation isn’t about creating something complicated. It’s about using existing tools to make participation easier and more enjoyable.
Utility and Rewards
One thing I find interesting about SEAPumpkinFrenzy is its advertised 600 USDC prize pool. The published rewards range from 90 USDC for first place to smaller rewards for other selected participants.
USDC is a digital asset designed to maintain a value close to one US dollar. It can be used for supported digital transfers, payments, and other financial activities. Unlike many cryptocurrencies, it is designed to avoid the large price fluctuations commonly associated with more volatile digital assets, although risks still exist.
I think using an established digital asset for rewards makes the campaign easier to understand. Participants don’t need to learn the purpose of a new cryptocurrency to understand what the advertised reward represents.
However, I haven’t found verified information confirming that SEAPumpkinFrenzy has its own native token. Its documented reward system uses USDC token vouchers, so claims about a separate token, staking, governance, or token burning would be unsupported.
Adoption and Community Growth
I believe community participation can play an important role in bringing more people into Web3. Someone might initially join because they enjoy photography or writing, but their experience could encourage them to explore more of the Binance ecosystem.
I’ve seen how a welcoming environment can make unfamiliar technology feel less intimidating. When people can share ideas, discover other creators, and participate without needing advanced technical knowledge, they may become more comfortable learning about digital assets.
Of course, participation doesn’t guarantee long-term adoption. A campaign can attract attention for a short time, but meaningful growth depends on whether people find lasting value in the experience.
For me, the real opportunity is to turn temporary excitement into stronger communities, better understanding, and continued participation.
What Comes Next
I’m interested in seeing how community campaigns can continue to improve the way people experience Web3. Better content discovery, clearer participation rules, useful educational material, and transparent reward systems could make future campaigns more valuable.
If this happens, people may have more reasons to return even after a campaign ends. They could continue learning, creating content, and connecting with others who share their interests.
However, I haven’t seen a verified roadmap confirming a separate SEAPumpkinFrenzy token or an independent blockchain. Its future development should be judged through official announcements rather than assumptions.
Final Thoughts
I believe SEAPumpkinFrenzy highlights an important idea: Web3 isn’t only about technology or digital assets. It’s also about the people who participate, share their creativity, and help communities grow.
I’ve seen how complicated the crypto world can appear to newcomers, which is why accessible experiences matter. A simple creative campaign can give people a reason to participate, express themselves, and discover something new.
Ultimately, the future of Web3 will depend on more than new tokens or advanced technology. It will depend on whether people find genuine value, trust the systems they use, and feel encouraged to contribute.
For me, the real power of Web3 lies in bringing technology and people together. When creativity meets community and participation creates real value, the future becomes more than a technological idea. It becomes something we can build together.
#SEAPumpkinFrenzy
$IRYS
4
495
·
--
$IRYS / USDT Perp | Irys: Extreme Breakout Alert
Irys is on the move and the chart is on fire
If you are watching the 15m timeframe you already know this is one of the wildest moves out there
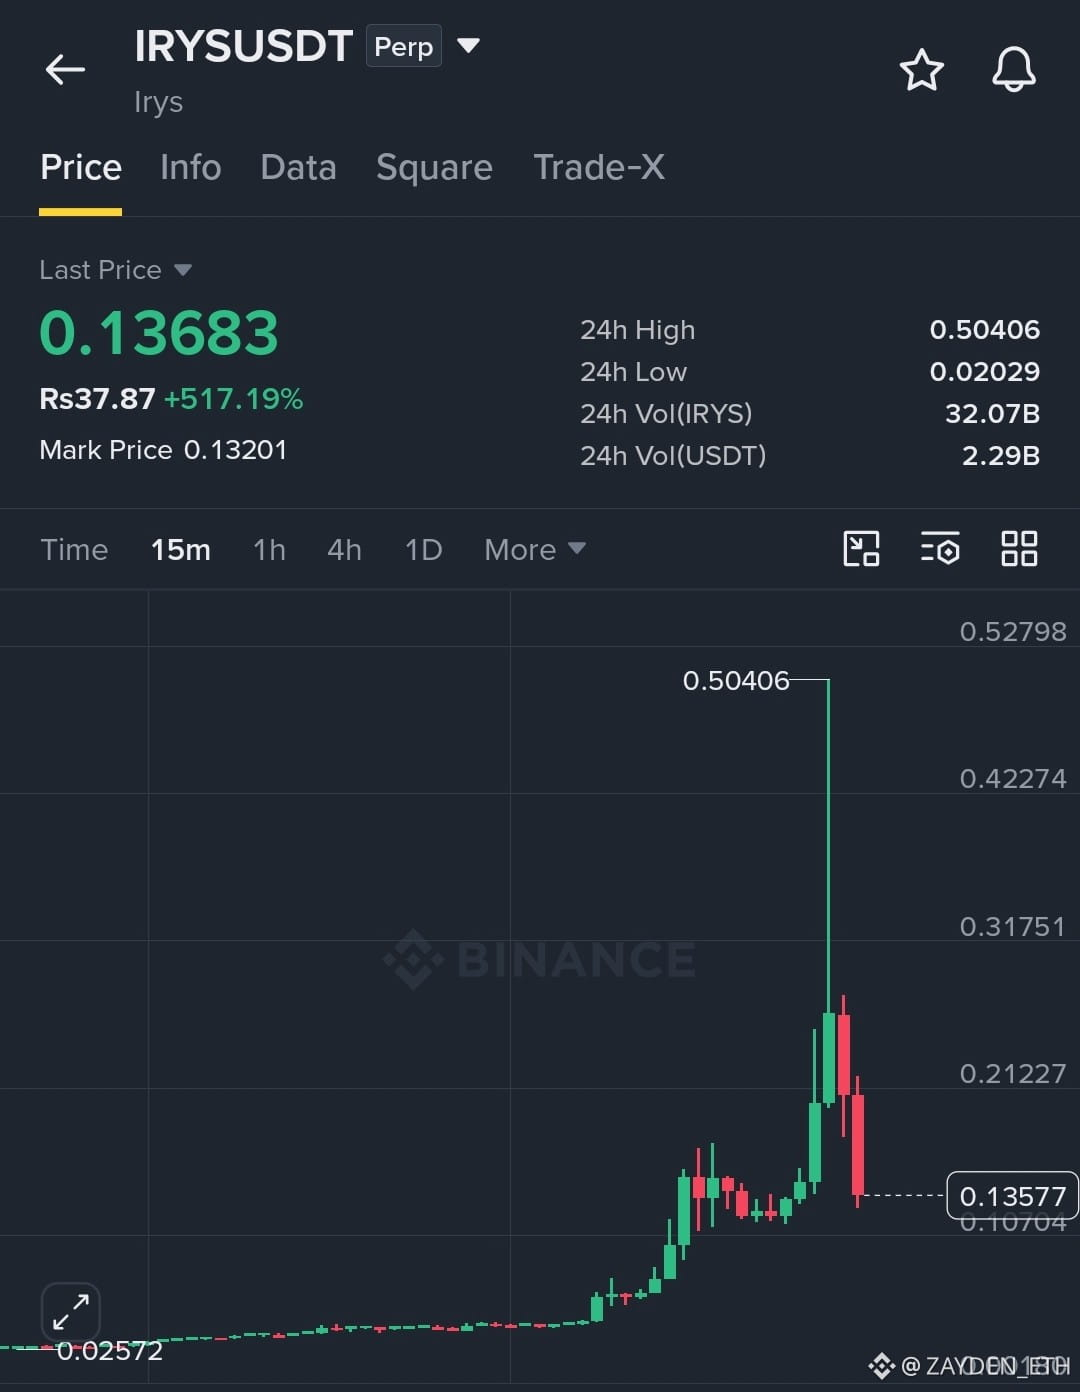
Last Price is $0.13683 (about PKR37.87), up +517.19% in the last 24h, with Mark Price at $0.13201
24h High sits at $0.50406 and 24h Low at $0.02029
24h Volume is 32.07B IRYS, or $2.29B in USDT
Price traded nearly flat near $0.02572 for a long stretch with almost no movement
Then buyers exploded in with a vertical spike that launched price straight up to a staggering high of $0.50406
Sellers hit back hard right at the top and a massive red candle crashed price down fast, giving back most of the spike
Price is now holding around $0.13577 to $0.13683 after one of the most explosive and volatile moves possible
This is an extreme parabolic move and the market is deciding whether it stabilizes here or keeps swinging wildly
Support is at $0.10704 with the $0.02572 base far below as the ultimate floor on this chart
Resistance is at $0.21227 with $0.31751 above it, and $0.50406 as the extreme spike high
A clean move back above $0.21227 with volume could reignite the move
A loss of $0.10704 could open the door to a much deeper pullback
With $2.29B in USDT volume in 24 hours this is an extremely active chart
Liquidity is there, volatility is there, but moves like this carry very high risk
This kind of extreme volatility means big opportunity but also big danger
Use a stop loss, size your position wisely, and never trade money you cannot afford to lose
Not financial advice, always do your own research and trade responsibly
Let's go and trade now $IRYS
{future}(IRYSUSDT)
$IRYS / USDT Perp | Irys: Extreme Breakout Alert
Irys is on the move and the chart is on fire
If you are watching the 15m timeframe you already know this is one of the wildest moves out there
Last Price is $0.13683 (about PKR37.87), up +517.19% in the last 24h, with Mark Price at $0.13201
24h High sits at $0.50406 and 24h Low at $0.02029
24h Volume is 32.07B IRYS, or $2.29B in USDT
Price traded nearly flat near $0.02572 for a long stretch with almost no movement
Then buyers exploded in with a vertical spike that launched price straight up to a staggering high of $0.50406
Sellers hit back hard right at the top and a massive red candle crashed price down fast, giving back most of the spike
Price is now holding around $0.13577 to $0.13683 after one of the most explosive and volatile moves possible
This is an extreme parabolic move and the market is deciding whether it stabilizes here or keeps swinging wildly
Support is at $0.10704 with the $0.02572 base far below as the ultimate floor on this chart
Resistance is at $0.21227 with $0.31751 above it, and $0.50406 as the extreme spike high
A clean move back above $0.21227 with volume could reignite the move
A loss of $0.10704 could open the door to a much deeper pullback
With $2.29B in USDT volume in 24 hours this is an extremely active chart
Liquidity is there, volatility is there, but moves like this carry very high risk
This kind of extreme volatility means big opportunity but also big danger
Use a stop loss, size your position wisely, and never trade money you cannot afford to lose
Not financial advice, always do your own research and trade responsibly
Let's go and trade now $IRYS
Irys is on the move and the chart is on fire
If you are watching the 15m timeframe you already know this is one of the wildest moves out there
Last Price is $0.13683 (about PKR37.87), up +517.19% in the last 24h, with Mark Price at $0.13201
24h High sits at $0.50406 and 24h Low at $0.02029
24h Volume is 32.07B IRYS, or $2.29B in USDT
Price traded nearly flat near $0.02572 for a long stretch with almost no movement
Then buyers exploded in with a vertical spike that launched price straight up to a staggering high of $0.50406
Sellers hit back hard right at the top and a massive red candle crashed price down fast, giving back most of the spike
Price is now holding around $0.13577 to $0.13683 after one of the most explosive and volatile moves possible
This is an extreme parabolic move and the market is deciding whether it stabilizes here or keeps swinging wildly
Support is at $0.10704 with the $0.02572 base far below as the ultimate floor on this chart
Resistance is at $0.21227 with $0.31751 above it, and $0.50406 as the extreme spike high
A clean move back above $0.21227 with volume could reignite the move
A loss of $0.10704 could open the door to a much deeper pullback
With $2.29B in USDT volume in 24 hours this is an extremely active chart
Liquidity is there, volatility is there, but moves like this carry very high risk
This kind of extreme volatility means big opportunity but also big danger
Use a stop loss, size your position wisely, and never trade money you cannot afford to lose
Not financial advice, always do your own research and trade responsibly
Let's go and trade now $IRYS
2
425
·
--
$IRYS vs $BIRB : Which Coin Has the Stronger Momentum?
The competition is heating up, and IRYS is currently leading the race with an impressive price surge. But BIRB is also showing strong performance and deserves attention.
IRYS (IRYSUSDT) is trading at $0.20762, equivalent to approximately Rs57.46, with a massive +862.09% gain. This remarkable move puts IRYS in the spotlight, attracting attention from traders looking for strong momentum. Its performance stands out significantly, making it the leading performer in this comparison. However, after such a sharp rally, traders should also watch for volatility and potential profit-taking.
On the other side, BIRB (BIRBUSDT) is trading at $0.07754, approximately Rs21.45, with a solid +47.05% gain. While its increase is much smaller than IRYS, BIRB is still showing positive momentum. If buying interest continues, it could remain an interesting coin to watch as the market develops.
For now, IRYS clearly dominates in percentage gains, while BIRB is holding its ground with a positive move of its own. The real question is whether IRYS can maintain its strong momentum or whether BIRB can close the gap.
Both coins have attracted attention, but the market can change quickly, so traders should consider volatility and risk before making a decision.
Which coin are you backing right now: IRYS or BIRB?
{future}(IRYSUSDT)
{future}(BIRBUSDT)
$IRYS vs $BIRB : Which Coin Has the Stronger Momentum?
The competition is heating up, and IRYS is currently leading the race with an impressive price surge. But BIRB is also showing strong performance and deserves attention.
IRYS (IRYSUSDT) is trading at $0.20762, equivalent to approximately Rs57.46, with a massive +862.09% gain. This remarkable move puts IRYS in the spotlight, attracting attention from traders looking for strong momentum. Its performance stands out significantly, making it the leading performer in this comparison. However, after such a sharp rally, traders should also watch for volatility and potential profit-taking.
On the other side, BIRB (BIRBUSDT) is trading at $0.07754, approximately Rs21.45, with a solid +47.05% gain. While its increase is much smaller than IRYS, BIRB is still showing positive momentum. If buying interest continues, it could remain an interesting coin to watch as the market develops.
For now, IRYS clearly dominates in percentage gains, while BIRB is holding its ground with a positive move of its own. The real question is whether IRYS can maintain its strong momentum or whether BIRB can close the gap.
Both coins have attracted attention, but the market can change quickly, so traders should consider volatility and risk before making a decision.
Which coin are you backing right now: IRYS or BIRB?
The competition is heating up, and IRYS is currently leading the race with an impressive price surge. But BIRB is also showing strong performance and deserves attention.
IRYS (IRYSUSDT) is trading at $0.20762, equivalent to approximately Rs57.46, with a massive +862.09% gain. This remarkable move puts IRYS in the spotlight, attracting attention from traders looking for strong momentum. Its performance stands out significantly, making it the leading performer in this comparison. However, after such a sharp rally, traders should also watch for volatility and potential profit-taking.
On the other side, BIRB (BIRBUSDT) is trading at $0.07754, approximately Rs21.45, with a solid +47.05% gain. While its increase is much smaller than IRYS, BIRB is still showing positive momentum. If buying interest continues, it could remain an interesting coin to watch as the market develops.
For now, IRYS clearly dominates in percentage gains, while BIRB is holding its ground with a positive move of its own. The real question is whether IRYS can maintain its strong momentum or whether BIRB can close the gap.
Both coins have attracted attention, but the market can change quickly, so traders should consider volatility and risk before making a decision.
Which coin are you backing right now: IRYS or BIRB?
Which coin has better momentum
2%
BIRB (BIRBUSDT)
33%
IRYS (IRYSUSDT)
65%
52 votes • Voting closed
1
3
8.5k
·
--
$BTR / USDT Perp | Bitlayer: Big Volatility Alert
Bitlayer is on the move and the chart is not quiet
If you are watching the 15m timeframe you already know the swings are wild
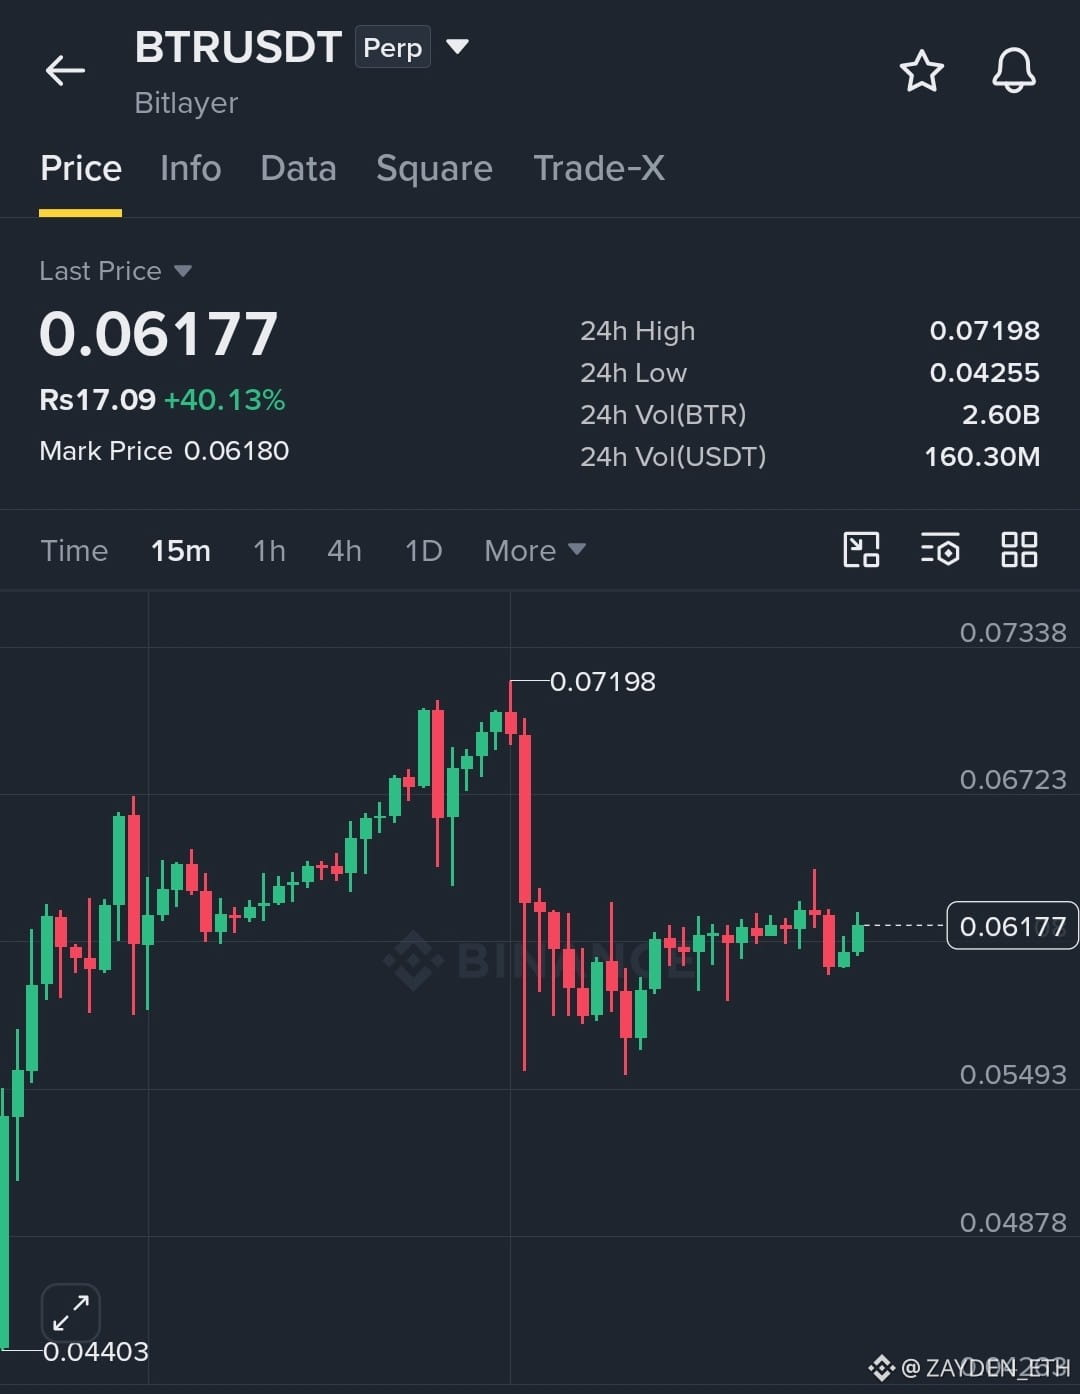
Last Price is $0.06177 (about PKR17.09), up +40.13% in the last 24h, with Mark Price at $0.06180
24h High sits at $0.07198 and 24h Low at $0.04255
24h Volume is 2.60B BTR, or $160.30M in USDT
Price started near the $0.04403 zone and buyers took over with a steady climb of green candles
The rally kept pushing higher and hit a high of $0.07198 where sellers stepped in hard
A sharp red candle crashed price down fast, dragging it from the top all the way to the $0.0549 zone
Price then chopped sideways between $0.055 and $0.065 as buyers and sellers fought for control
Right now BTR is holding around $0.06177 after giving back a big chunk of the rally
The market is deciding if this is a bottom forming or more downside ahead
Support is at $0.05493 with $0.04878 below it, and the $0.04403 low is the key floor on this chart
Resistance is at $0.06723 with $0.07198 as the recent swing high and $0.07338 just above it
A clean move above $0.06723 with volume could bring momentum back toward the highs
A loss of $0.05493 could open the door to a deeper pullback
With $160.30M in USDT volume in 24 hours this is not a sleepy chart
Liquidity is there, volatility is there, and setups are forming on every timeframe
Volatility means opportunity but it also means risk
Use a stop loss, size your position wisely, and never trade money you cannot afford to lose
Not financial advice, always do your own research and trade responsibly
Let's go and trade now $BTR
{future}(BTRUSDT)
$BTR / USDT Perp | Bitlayer: Big Volatility Alert
Bitlayer is on the move and the chart is not quiet
If you are watching the 15m timeframe you already know the swings are wild
Last Price is $0.06177 (about PKR17.09), up +40.13% in the last 24h, with Mark Price at $0.06180
24h High sits at $0.07198 and 24h Low at $0.04255
24h Volume is 2.60B BTR, or $160.30M in USDT
Price started near the $0.04403 zone and buyers took over with a steady climb of green candles
The rally kept pushing higher and hit a high of $0.07198 where sellers stepped in hard
A sharp red candle crashed price down fast, dragging it from the top all the way to the $0.0549 zone
Price then chopped sideways between $0.055 and $0.065 as buyers and sellers fought for control
Right now BTR is holding around $0.06177 after giving back a big chunk of the rally
The market is deciding if this is a bottom forming or more downside ahead
Support is at $0.05493 with $0.04878 below it, and the $0.04403 low is the key floor on this chart
Resistance is at $0.06723 with $0.07198 as the recent swing high and $0.07338 just above it
A clean move above $0.06723 with volume could bring momentum back toward the highs
A loss of $0.05493 could open the door to a deeper pullback
With $160.30M in USDT volume in 24 hours this is not a sleepy chart
Liquidity is there, volatility is there, and setups are forming on every timeframe
Volatility means opportunity but it also means risk
Use a stop loss, size your position wisely, and never trade money you cannot afford to lose
Not financial advice, always do your own research and trade responsibly
Let's go and trade now $BTR
Bitlayer is on the move and the chart is not quiet
If you are watching the 15m timeframe you already know the swings are wild
Last Price is $0.06177 (about PKR17.09), up +40.13% in the last 24h, with Mark Price at $0.06180
24h High sits at $0.07198 and 24h Low at $0.04255
24h Volume is 2.60B BTR, or $160.30M in USDT
Price started near the $0.04403 zone and buyers took over with a steady climb of green candles
The rally kept pushing higher and hit a high of $0.07198 where sellers stepped in hard
A sharp red candle crashed price down fast, dragging it from the top all the way to the $0.0549 zone
Price then chopped sideways between $0.055 and $0.065 as buyers and sellers fought for control
Right now BTR is holding around $0.06177 after giving back a big chunk of the rally
The market is deciding if this is a bottom forming or more downside ahead
Support is at $0.05493 with $0.04878 below it, and the $0.04403 low is the key floor on this chart
Resistance is at $0.06723 with $0.07198 as the recent swing high and $0.07338 just above it
A clean move above $0.06723 with volume could bring momentum back toward the highs
A loss of $0.05493 could open the door to a deeper pullback
With $160.30M in USDT volume in 24 hours this is not a sleepy chart
Liquidity is there, volatility is there, and setups are forming on every timeframe
Volatility means opportunity but it also means risk
Use a stop loss, size your position wisely, and never trade money you cannot afford to lose
Not financial advice, always do your own research and trade responsibly
Let's go and trade now $BTR
2
167
·
--
$IRYS / USDT Perp | Irys: Big Momentum Alert
Irys is on the move and the chart is not quiet
If you are watching the 15m timeframe you already know the buyers are pushing hard
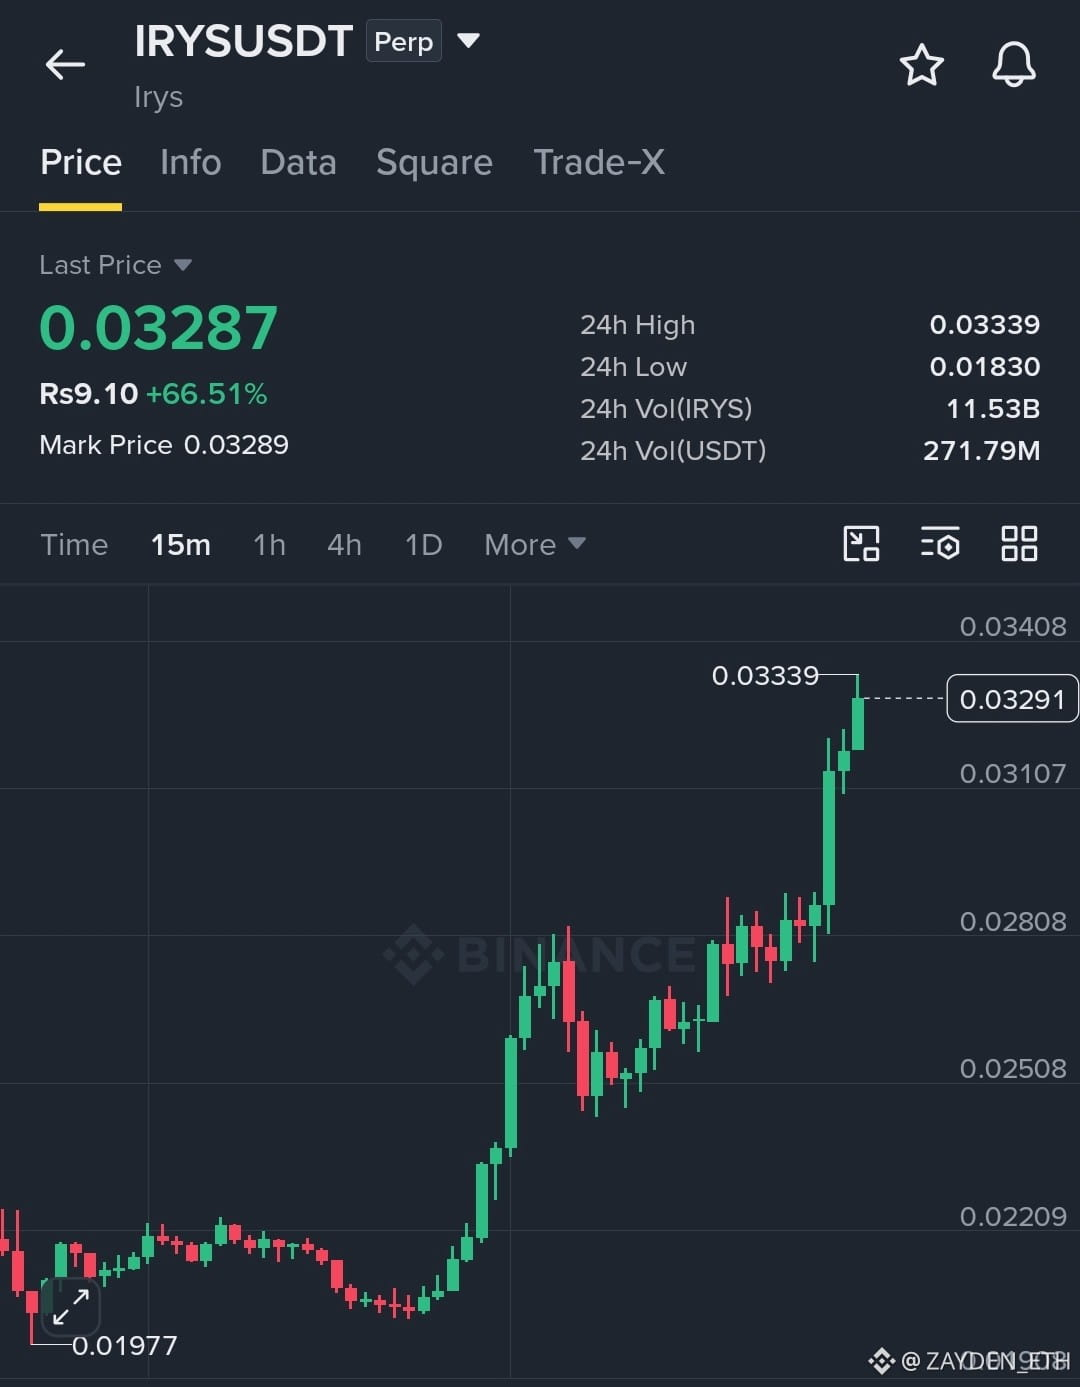
Last Price is $0.03287 (about PKR9.10), up +66.51% in the last 24h, with Mark Price at $0.03289
24h High sits at $0.03339 and 24h Low at $0.01830
24h Volume is 11.53B IRYS, or $271.79M in USDT
Price traded sideways near $0.01977 for a long stretch with choppy red and green candles
Then buyers took over and a strong green candle launched price higher fast through $0.0220 and $0.0251
A brief pullback formed near $0.0251 to $0.0280 before buyers pushed again with another powerful run
The rally kept climbing with higher lows all the way to a fresh high of $0.03339
Right now IRYS is holding around $0.03291 just under that high with the rally still intact
The trend is strongly up and the market is deciding if this is a pause or the next leg higher
Support is at $0.03107 with $0.02808 below it, and the $0.01977 base is the key floor on this chart
Resistance is at $0.03339, the recent swing high, with $0.03408 just above it
A clean move above $0.03339 with volume could open the door to fresh highs
A loss of $0.03107 could bring a deeper pullback toward $0.02808
With $271.79M in USDT volume in 24 hours this is not a sleepy chart
Liquidity is there, volatility is there, and setups are forming on every timeframe
Volatility means opportunity but it also means risk
Use a stop loss, size your position wisely, and never trade money you cannot afford to lose
Not financial advice, always do your own research and trade responsibly
Let's go and trade now $IRYS
{future}(IRYSUSDT)
$IRYS / USDT Perp | Irys: Big Momentum Alert
Irys is on the move and the chart is not quiet
If you are watching the 15m timeframe you already know the buyers are pushing hard
Last Price is $0.03287 (about PKR9.10), up +66.51% in the last 24h, with Mark Price at $0.03289
24h High sits at $0.03339 and 24h Low at $0.01830
24h Volume is 11.53B IRYS, or $271.79M in USDT
Price traded sideways near $0.01977 for a long stretch with choppy red and green candles
Then buyers took over and a strong green candle launched price higher fast through $0.0220 and $0.0251
A brief pullback formed near $0.0251 to $0.0280 before buyers pushed again with another powerful run
The rally kept climbing with higher lows all the way to a fresh high of $0.03339
Right now IRYS is holding around $0.03291 just under that high with the rally still intact
The trend is strongly up and the market is deciding if this is a pause or the next leg higher
Support is at $0.03107 with $0.02808 below it, and the $0.01977 base is the key floor on this chart
Resistance is at $0.03339, the recent swing high, with $0.03408 just above it
A clean move above $0.03339 with volume could open the door to fresh highs
A loss of $0.03107 could bring a deeper pullback toward $0.02808
With $271.79M in USDT volume in 24 hours this is not a sleepy chart
Liquidity is there, volatility is there, and setups are forming on every timeframe
Volatility means opportunity but it also means risk
Use a stop loss, size your position wisely, and never trade money you cannot afford to lose
Not financial advice, always do your own research and trade responsibly
Let's go and trade now $IRYS
Irys is on the move and the chart is not quiet
If you are watching the 15m timeframe you already know the buyers are pushing hard
Last Price is $0.03287 (about PKR9.10), up +66.51% in the last 24h, with Mark Price at $0.03289
24h High sits at $0.03339 and 24h Low at $0.01830
24h Volume is 11.53B IRYS, or $271.79M in USDT
Price traded sideways near $0.01977 for a long stretch with choppy red and green candles
Then buyers took over and a strong green candle launched price higher fast through $0.0220 and $0.0251
A brief pullback formed near $0.0251 to $0.0280 before buyers pushed again with another powerful run
The rally kept climbing with higher lows all the way to a fresh high of $0.03339
Right now IRYS is holding around $0.03291 just under that high with the rally still intact
The trend is strongly up and the market is deciding if this is a pause or the next leg higher
Support is at $0.03107 with $0.02808 below it, and the $0.01977 base is the key floor on this chart
Resistance is at $0.03339, the recent swing high, with $0.03408 just above it
A clean move above $0.03339 with volume could open the door to fresh highs
A loss of $0.03107 could bring a deeper pullback toward $0.02808
With $271.79M in USDT volume in 24 hours this is not a sleepy chart
Liquidity is there, volatility is there, and setups are forming on every timeframe
Volatility means opportunity but it also means risk
Use a stop loss, size your position wisely, and never trade money you cannot afford to lose
Not financial advice, always do your own research and trade responsibly
Let's go and trade now $IRYS
2
553
·
--
$MAGMA USDT vs $PTB USDT: Which Perp Coin Is Leading the Charge?
Two perpetual contracts are lighting up the board right now, and both are pushing close to the 50% mark in a single session. Let's put them head to head.
MAGMAUSDT (MAGMA) is trading at 0.52445 USDT, roughly Rs145.26, and is up 49.19% on the day. That is a massive move, and it puts MAGMA at the very top of the gainers list. A near-50% run shows buyers are stepping in aggressively and the momentum is clearly on their side.
PTBUSDT (Portal To Bitcoin) is trading at 0.0007651 USDT, roughly Rs0.2119, and is up 47.39%. It trails MAGMA by only about 1.8 percentage points, which makes this one of the tightest races on the board. For a coin priced this low, a gain of this size tends to pull in a lot of attention from traders hunting for the next breakout.
MAGMA holds a slim lead, but the gap is small enough that a single strong push from PTB could flip the ranking. If MAGMA keeps its volume steady, it could extend the lead. If PTB keeps building, this race stays wide open. Moves this big can reverse fast, so risk management matters on both sides.
So the question is simple: MAGMAUSDT or PTBUSDT, which one are you backing? Drop your pick in the comments and tell us why.
{future}(PTBUSDT)
{future}(MAGMAUSDT)
$MAGMA USDT vs $PTB USDT: Which Perp Coin Is Leading the Charge?
Two perpetual contracts are lighting up the board right now, and both are pushing close to the 50% mark in a single session. Let's put them head to head.
MAGMAUSDT (MAGMA) is trading at 0.52445 USDT, roughly Rs145.26, and is up 49.19% on the day. That is a massive move, and it puts MAGMA at the very top of the gainers list. A near-50% run shows buyers are stepping in aggressively and the momentum is clearly on their side.
PTBUSDT (Portal To Bitcoin) is trading at 0.0007651 USDT, roughly Rs0.2119, and is up 47.39%. It trails MAGMA by only about 1.8 percentage points, which makes this one of the tightest races on the board. For a coin priced this low, a gain of this size tends to pull in a lot of attention from traders hunting for the next breakout.
MAGMA holds a slim lead, but the gap is small enough that a single strong push from PTB could flip the ranking. If MAGMA keeps its volume steady, it could extend the lead. If PTB keeps building, this race stays wide open. Moves this big can reverse fast, so risk management matters on both sides.
So the question is simple: MAGMAUSDT or PTBUSDT, which one are you backing? Drop your pick in the comments and tell us why.
Two perpetual contracts are lighting up the board right now, and both are pushing close to the 50% mark in a single session. Let's put them head to head.
MAGMAUSDT (MAGMA) is trading at 0.52445 USDT, roughly Rs145.26, and is up 49.19% on the day. That is a massive move, and it puts MAGMA at the very top of the gainers list. A near-50% run shows buyers are stepping in aggressively and the momentum is clearly on their side.
PTBUSDT (Portal To Bitcoin) is trading at 0.0007651 USDT, roughly Rs0.2119, and is up 47.39%. It trails MAGMA by only about 1.8 percentage points, which makes this one of the tightest races on the board. For a coin priced this low, a gain of this size tends to pull in a lot of attention from traders hunting for the next breakout.
MAGMA holds a slim lead, but the gap is small enough that a single strong push from PTB could flip the ranking. If MAGMA keeps its volume steady, it could extend the lead. If PTB keeps building, this race stays wide open. Moves this big can reverse fast, so risk management matters on both sides.
So the question is simple: MAGMAUSDT or PTBUSDT, which one are you backing? Drop your pick in the comments and tell us why.
Which coin pumps more today?
12%
MAGMAUSDT
55%
PTBUSDT
33%
33 votes • Voting closed
2.6k
·
--
$AKE / USDT Perp | AKEDO: Big Volatility Alert
AKEDO is on the move and the chart is not quiet
If you are watching the 15m timeframe you already know the sellers have been in control
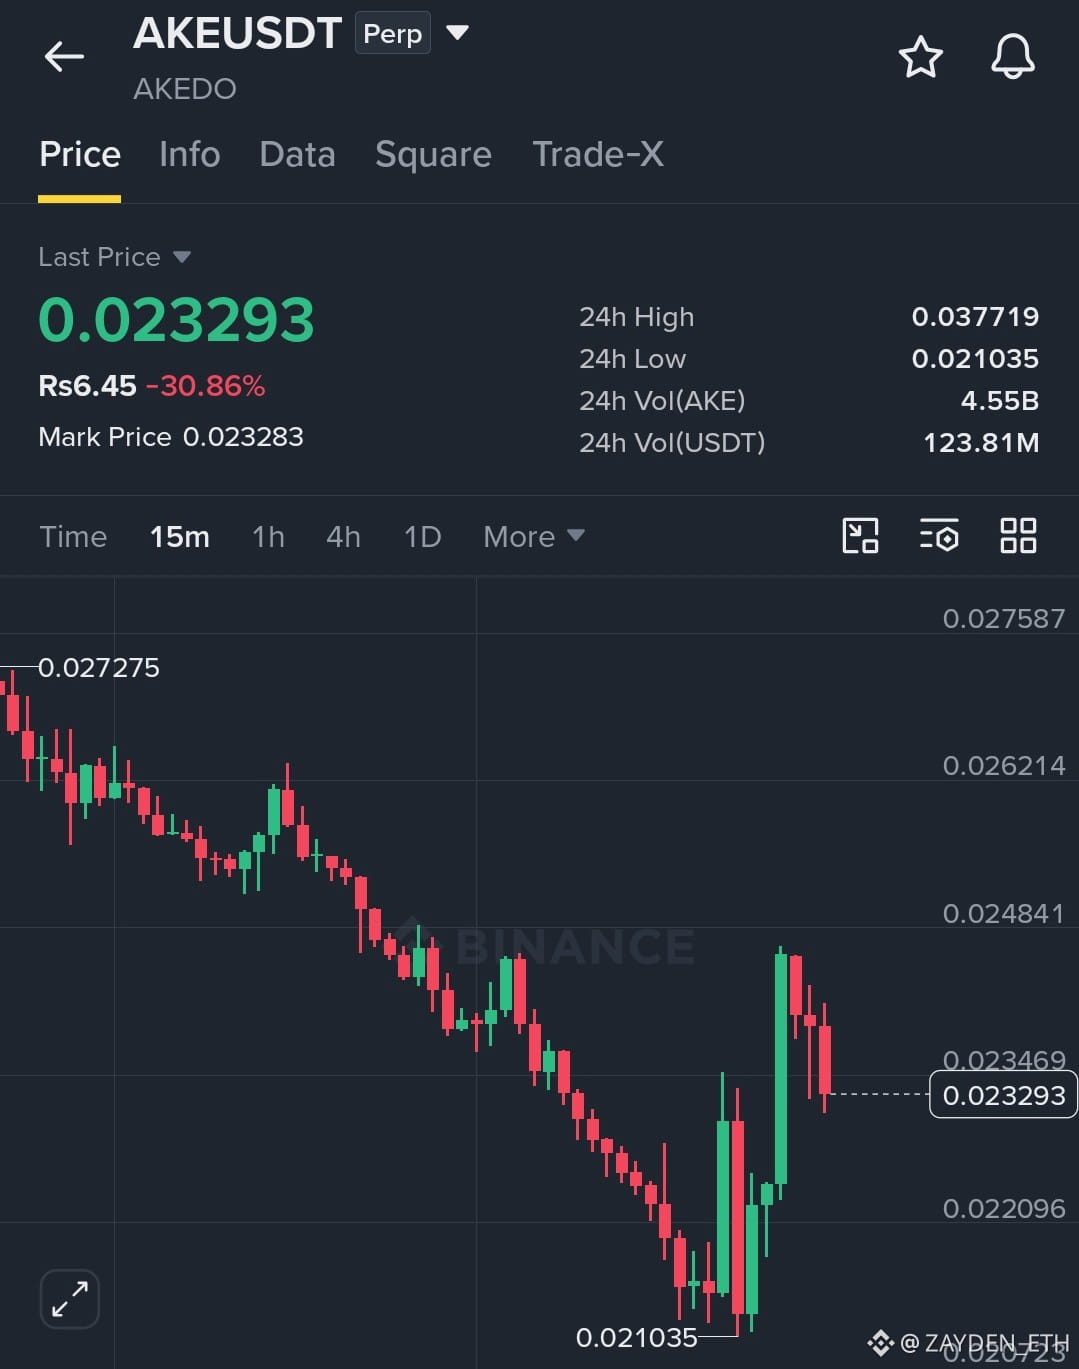
Last Price is $0.023293 (about PKR6.45), down -30.86% in the last 24h, with Mark Price at $0.023283
24h High sits at $0.037719 and 24h Low at $0.021035
24h Volume is 4.55B AKE, or $123.81M in USDT
Price started the session near $0.027275 and sellers took over with a steady grind of red candles
The decline kept pushing lower with only small pauses, breaking through $0.0248 and $0.0234 on the way down
A sharp final flush dragged price to a low of $0.021035 where buyers finally stepped in
A strong green candle sparked a bounce back up toward $0.0247, but sellers hit back and pulled price down again
Right now AKE is sitting around $0.023293 after a wild bounce and pullback near the lows
The heavy selling has cooled off and the market is deciding if this is a bottom forming or more downside ahead
Support is at $0.022096 with $0.021035 as the 24h low and key floor on this chart
Resistance is at $0.023469 with $0.024841 above it, and $0.027275 as the earlier high on this chart
A clean move above $0.024841 with volume could bring momentum back
A loss of $0.021035 could open the door to fresh lows
With $123.81M in USDT volume in 24 hours this is not a sleepy chart
Liquidity is there, volatility is there, and setups are forming on every timeframe
Volatility means opportunity but it also means risk
Use a stop loss, size your position wisely, and never trade money you cannot afford to lose
Not financial advice, always do your own research and trade responsibly
Let's go and trade now $AKE
{future}(AKEUSDT)
$AKE / USDT Perp | AKEDO: Big Volatility Alert
AKEDO is on the move and the chart is not quiet
If you are watching the 15m timeframe you already know the sellers have been in control
Last Price is $0.023293 (about PKR6.45), down -30.86% in the last 24h, with Mark Price at $0.023283
24h High sits at $0.037719 and 24h Low at $0.021035
24h Volume is 4.55B AKE, or $123.81M in USDT
Price started the session near $0.027275 and sellers took over with a steady grind of red candles
The decline kept pushing lower with only small pauses, breaking through $0.0248 and $0.0234 on the way down
A sharp final flush dragged price to a low of $0.021035 where buyers finally stepped in
A strong green candle sparked a bounce back up toward $0.0247, but sellers hit back and pulled price down again
Right now AKE is sitting around $0.023293 after a wild bounce and pullback near the lows
The heavy selling has cooled off and the market is deciding if this is a bottom forming or more downside ahead
Support is at $0.022096 with $0.021035 as the 24h low and key floor on this chart
Resistance is at $0.023469 with $0.024841 above it, and $0.027275 as the earlier high on this chart
A clean move above $0.024841 with volume could bring momentum back
A loss of $0.021035 could open the door to fresh lows
With $123.81M in USDT volume in 24 hours this is not a sleepy chart
Liquidity is there, volatility is there, and setups are forming on every timeframe
Volatility means opportunity but it also means risk
Use a stop loss, size your position wisely, and never trade money you cannot afford to lose
Not financial advice, always do your own research and trade responsibly
Let's go and trade now $AKE
AKEDO is on the move and the chart is not quiet
If you are watching the 15m timeframe you already know the sellers have been in control
Last Price is $0.023293 (about PKR6.45), down -30.86% in the last 24h, with Mark Price at $0.023283
24h High sits at $0.037719 and 24h Low at $0.021035
24h Volume is 4.55B AKE, or $123.81M in USDT
Price started the session near $0.027275 and sellers took over with a steady grind of red candles
The decline kept pushing lower with only small pauses, breaking through $0.0248 and $0.0234 on the way down
A sharp final flush dragged price to a low of $0.021035 where buyers finally stepped in
A strong green candle sparked a bounce back up toward $0.0247, but sellers hit back and pulled price down again
Right now AKE is sitting around $0.023293 after a wild bounce and pullback near the lows
The heavy selling has cooled off and the market is deciding if this is a bottom forming or more downside ahead
Support is at $0.022096 with $0.021035 as the 24h low and key floor on this chart
Resistance is at $0.023469 with $0.024841 above it, and $0.027275 as the earlier high on this chart
A clean move above $0.024841 with volume could bring momentum back
A loss of $0.021035 could open the door to fresh lows
With $123.81M in USDT volume in 24 hours this is not a sleepy chart
Liquidity is there, volatility is there, and setups are forming on every timeframe
Volatility means opportunity but it also means risk
Use a stop loss, size your position wisely, and never trade money you cannot afford to lose
Not financial advice, always do your own research and trade responsibly
Let's go and trade now $AKE
577
·
--
$IOST / USDT Perp: Big Volatility Alert
IOST is on the move and the chart is not quiet
If you are watching the 15m timeframe you already know this has been a brutal fall
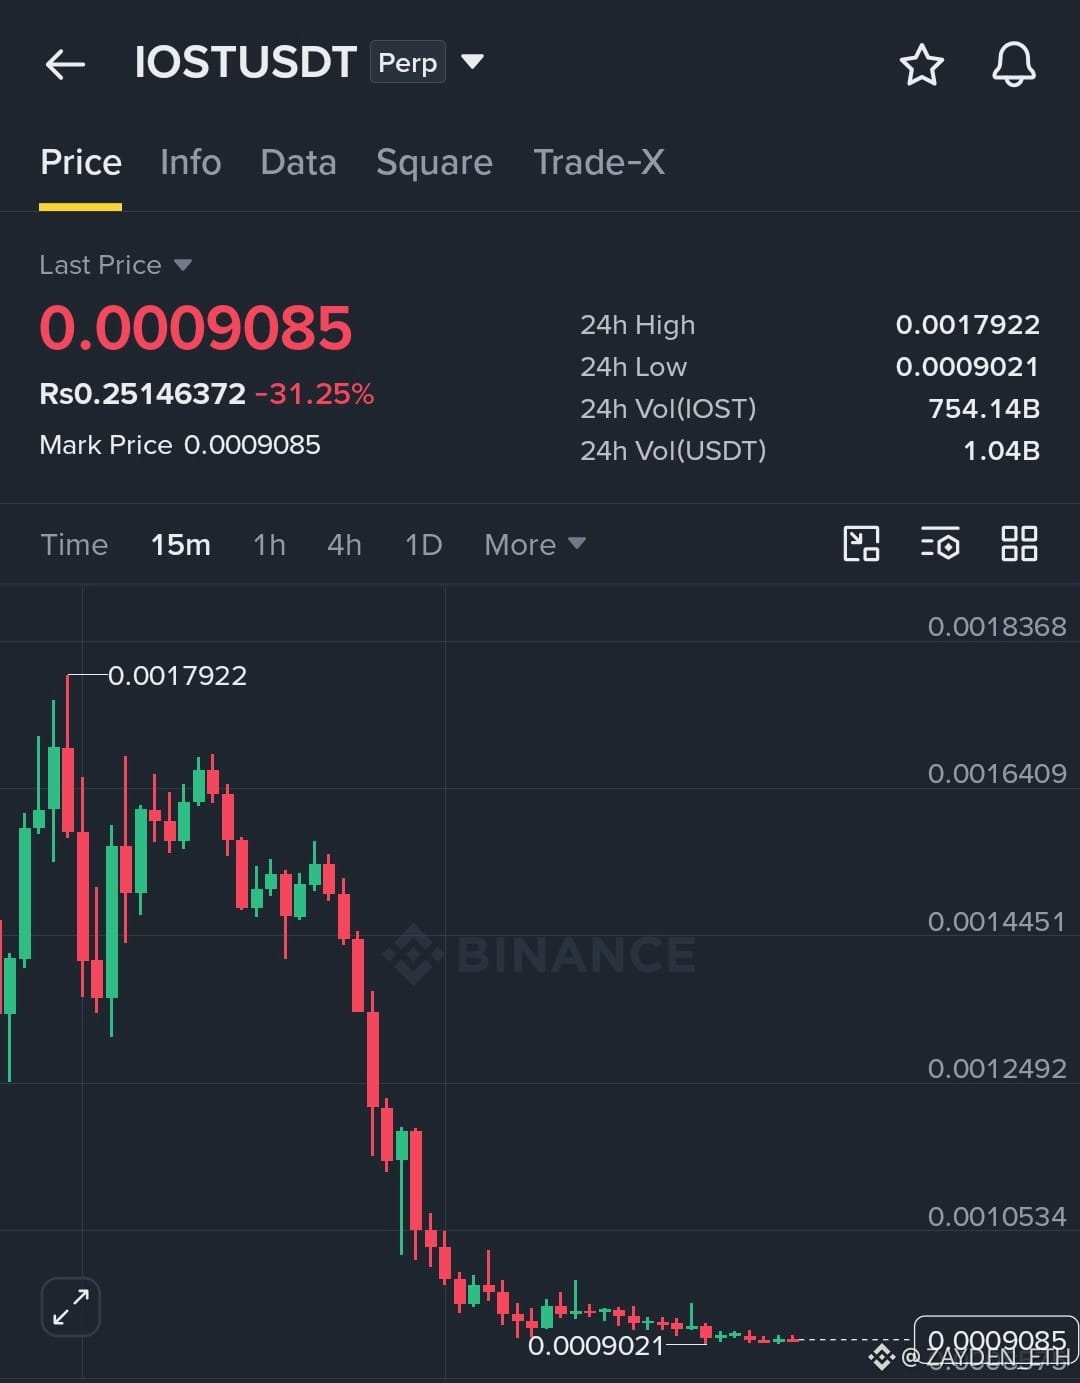
Last Price is $0.0009085 (about PKR0.25146372), down -31.25% in the last 24h, with Mark Price at $0.0009085
24h High sits at $0.0017922 and 24h Low at $0.0009021
24h Volume is 754.14B IOST, or $1.04B in USDT
Price pushed up to a high of $0.0017922 on the 15m chart with strong green candles early on
Sellers then took full control and a long relentless string of red candles crushed price all the way down
The drop accelerated hard through $0.0014 and kept falling with barely any bounce toward $0.0010
Price has now flattened out near the bottom with tiny candles building around $0.0009021
Right now IOST is sitting around $0.0009085 after one of the sharpest declines on the board
The heavy selling has cooled off and the market is deciding if this is a bottom forming or more downside ahead
Support is at $0.0009021, the 24h low, with the wick near the base as the key floor on this chart
Resistance is at $0.0010534 with $0.0012492 above it, and $0.0017922 as the recent swing high
A clean move above $0.0010534 with volume could bring momentum back
A loss of $0.0009021 could open the door to fresh lows
With $1.04B in USDT volume in 24 hours this is not a sleepy chart
Liquidity is there, volatility is there, and setups are forming on every timeframe
Volatility means opportunity but it also means risk
Use a stop loss, size your position wisely, and never trade money you cannot afford to lose
Not financial advice, always do your own research and trade responsibly
Let's go and trade now $IOST
{spot}(IOSTUSDT)
$IOST / USDT Perp: Big Volatility Alert
IOST is on the move and the chart is not quiet
If you are watching the 15m timeframe you already know this has been a brutal fall
Last Price is $0.0009085 (about PKR0.25146372), down -31.25% in the last 24h, with Mark Price at $0.0009085
24h High sits at $0.0017922 and 24h Low at $0.0009021
24h Volume is 754.14B IOST, or $1.04B in USDT
Price pushed up to a high of $0.0017922 on the 15m chart with strong green candles early on
Sellers then took full control and a long relentless string of red candles crushed price all the way down
The drop accelerated hard through $0.0014 and kept falling with barely any bounce toward $0.0010
Price has now flattened out near the bottom with tiny candles building around $0.0009021
Right now IOST is sitting around $0.0009085 after one of the sharpest declines on the board
The heavy selling has cooled off and the market is deciding if this is a bottom forming or more downside ahead
Support is at $0.0009021, the 24h low, with the wick near the base as the key floor on this chart
Resistance is at $0.0010534 with $0.0012492 above it, and $0.0017922 as the recent swing high
A clean move above $0.0010534 with volume could bring momentum back
A loss of $0.0009021 could open the door to fresh lows
With $1.04B in USDT volume in 24 hours this is not a sleepy chart
Liquidity is there, volatility is there, and setups are forming on every timeframe
Volatility means opportunity but it also means risk
Use a stop loss, size your position wisely, and never trade money you cannot afford to lose
Not financial advice, always do your own research and trade responsibly
Let's go and trade now $IOST
IOST is on the move and the chart is not quiet
If you are watching the 15m timeframe you already know this has been a brutal fall
Last Price is $0.0009085 (about PKR0.25146372), down -31.25% in the last 24h, with Mark Price at $0.0009085
24h High sits at $0.0017922 and 24h Low at $0.0009021
24h Volume is 754.14B IOST, or $1.04B in USDT
Price pushed up to a high of $0.0017922 on the 15m chart with strong green candles early on
Sellers then took full control and a long relentless string of red candles crushed price all the way down
The drop accelerated hard through $0.0014 and kept falling with barely any bounce toward $0.0010
Price has now flattened out near the bottom with tiny candles building around $0.0009021
Right now IOST is sitting around $0.0009085 after one of the sharpest declines on the board
The heavy selling has cooled off and the market is deciding if this is a bottom forming or more downside ahead
Support is at $0.0009021, the 24h low, with the wick near the base as the key floor on this chart
Resistance is at $0.0010534 with $0.0012492 above it, and $0.0017922 as the recent swing high
A clean move above $0.0010534 with volume could bring momentum back
A loss of $0.0009021 could open the door to fresh lows
With $1.04B in USDT volume in 24 hours this is not a sleepy chart
Liquidity is there, volatility is there, and setups are forming on every timeframe
Volatility means opportunity but it also means risk
Use a stop loss, size your position wisely, and never trade money you cannot afford to lose
Not financial advice, always do your own research and trade responsibly
Let's go and trade now $IOST
810
·
--
$IOST vs $IRYS : Two Strong Performers, One Big Competition
The crypto market is showing some impressive moves, and two coins catching attention right now are IOST and IRYS. Both are posting strong gains, but which one has the potential to take the lead?
IOST (IOSTUSDT) is currently trading at 0.0016267, with an impressive gain of +65.00%. Its performance puts it ahead in this comparison, showing stronger percentage growth in the snapshot. If buyers continue to support the move, IOST could remain an interesting coin to watch for short-term momentum.
IRYS (IRYSUSDT) is trading at 0.02052, with a solid gain of +59.69%. Although it is slightly behind IOST in percentage gains, IRYS is also showing strong upward movement. If buying pressure continues, it could challenge IOST and attract traders looking for further opportunities.
For now, IOST leads with a gain of 65.00%, while IRYS follows closely at 59.69%. The difference is only 5.31 percentage points, making this an interesting competition between two strong performers.
However, a strong rally does not guarantee further gains. Traders should also watch trading volume, price action, volatility, and possible profit-taking before making decisions.
Now it's your turn: Which coin are you backing today — IOST or IRYS?
{future}(IOSTUSDT)
{future}(IRYSUSDT)
$IOST vs $IRYS : Two Strong Performers, One Big Competition
The crypto market is showing some impressive moves, and two coins catching attention right now are IOST and IRYS. Both are posting strong gains, but which one has the potential to take the lead?
IOST (IOSTUSDT) is currently trading at 0.0016267, with an impressive gain of +65.00%. Its performance puts it ahead in this comparison, showing stronger percentage growth in the snapshot. If buyers continue to support the move, IOST could remain an interesting coin to watch for short-term momentum.
IRYS (IRYSUSDT) is trading at 0.02052, with a solid gain of +59.69%. Although it is slightly behind IOST in percentage gains, IRYS is also showing strong upward movement. If buying pressure continues, it could challenge IOST and attract traders looking for further opportunities.
For now, IOST leads with a gain of 65.00%, while IRYS follows closely at 59.69%. The difference is only 5.31 percentage points, making this an interesting competition between two strong performers.
However, a strong rally does not guarantee further gains. Traders should also watch trading volume, price action, volatility, and possible profit-taking before making decisions.
Now it's your turn: Which coin are you backing today — IOST or IRYS?
The crypto market is showing some impressive moves, and two coins catching attention right now are IOST and IRYS. Both are posting strong gains, but which one has the potential to take the lead?
IOST (IOSTUSDT) is currently trading at 0.0016267, with an impressive gain of +65.00%. Its performance puts it ahead in this comparison, showing stronger percentage growth in the snapshot. If buyers continue to support the move, IOST could remain an interesting coin to watch for short-term momentum.
IRYS (IRYSUSDT) is trading at 0.02052, with a solid gain of +59.69%. Although it is slightly behind IOST in percentage gains, IRYS is also showing strong upward movement. If buying pressure continues, it could challenge IOST and attract traders looking for further opportunities.
For now, IOST leads with a gain of 65.00%, while IRYS follows closely at 59.69%. The difference is only 5.31 percentage points, making this an interesting competition between two strong performers.
However, a strong rally does not guarantee further gains. Traders should also watch trading volume, price action, volatility, and possible profit-taking before making decisions.
Now it's your turn: Which coin are you backing today — IOST or IRYS?
Whichcoinwould youbuy rightnow
0%
IOST
65%
IRYS
35%
17 votes • Voting closed
2
1.1k
·
--
$ARIA USDT vs $IOST USDT: Which Perp Coin Is Winning Today?
Two perpetual contracts are catching serious attention on the board right now, and both are in the green. Let's put them head to head.
ARIAUSDT (AriaAI) is trading at 0.05806 USDT, roughly Rs16.06, and is up 32.35% on the day. That is a strong, sharp move, and it shows buyers are stepping in with real conviction. A gain above 32% in a single session puts ARIA at the top of the momentum conversation.
IOSTUSDT (IOST) is trading at 0.0009390 USDT, roughly Rs0.2598, and is up 27.60%. Slightly behind ARIA in percentage terms, but still a powerful run for a coin priced at such a small number. Low-priced coins that move this fast tend to attract a lot of attention from traders looking for the next leg up.
ARIA leads by about 4.75 percentage points, but the gap is not huge. If IOST keeps building volume, it could close that gap quickly. If ARIA holds its strength, it could extend the lead. Both are moving fast, so risk management matters on either side.
So the question is simple: ARIAUSDT or IOSTUSDT, which one are you backing? Drop your pick in the comments and tell us why.
{spot}(IOSTUSDT)
{future}(ARIAUSDT)
$ARIA USDT vs $IOST USDT: Which Perp Coin Is Winning Today?
Two perpetual contracts are catching serious attention on the board right now, and both are in the green. Let's put them head to head.
ARIAUSDT (AriaAI) is trading at 0.05806 USDT, roughly Rs16.06, and is up 32.35% on the day. That is a strong, sharp move, and it shows buyers are stepping in with real conviction. A gain above 32% in a single session puts ARIA at the top of the momentum conversation.
IOSTUSDT (IOST) is trading at 0.0009390 USDT, roughly Rs0.2598, and is up 27.60%. Slightly behind ARIA in percentage terms, but still a powerful run for a coin priced at such a small number. Low-priced coins that move this fast tend to attract a lot of attention from traders looking for the next leg up.
ARIA leads by about 4.75 percentage points, but the gap is not huge. If IOST keeps building volume, it could close that gap quickly. If ARIA holds its strength, it could extend the lead. Both are moving fast, so risk management matters on either side.
So the question is simple: ARIAUSDT or IOSTUSDT, which one are you backing? Drop your pick in the comments and tell us why.
Two perpetual contracts are catching serious attention on the board right now, and both are in the green. Let's put them head to head.
ARIAUSDT (AriaAI) is trading at 0.05806 USDT, roughly Rs16.06, and is up 32.35% on the day. That is a strong, sharp move, and it shows buyers are stepping in with real conviction. A gain above 32% in a single session puts ARIA at the top of the momentum conversation.
IOSTUSDT (IOST) is trading at 0.0009390 USDT, roughly Rs0.2598, and is up 27.60%. Slightly behind ARIA in percentage terms, but still a powerful run for a coin priced at such a small number. Low-priced coins that move this fast tend to attract a lot of attention from traders looking for the next leg up.
ARIA leads by about 4.75 percentage points, but the gap is not huge. If IOST keeps building volume, it could close that gap quickly. If ARIA holds its strength, it could extend the lead. Both are moving fast, so risk management matters on either side.
So the question is simple: ARIAUSDT or IOSTUSDT, which one are you backing? Drop your pick in the comments and tell us why.
Which coin pumps more today?
4%
IOSTUSDT
70%
ARIAUSDT
26%
23 votes • Voting closed
1
1.1k
·
--
$JCT vs $DOOD : Which Coin Has the Stronger Momentum?
The competition is heating up in the crypto perpetual market, and two coins are attracting attention with impressive price movements: Janction (JCTUSDT) and Doodles (DOODUSDT).
Janction is currently trading at $0.004611, with an impressive gain of 135.38%. Its strong upward move puts it ahead in this comparison, showing significantly stronger short-term momentum. A rally of this size can attract traders looking for continued upside, although sharp moves can also bring increased volatility and profit-taking.
On the other side, Doodles (DOODUSDT) is trading at $0.002160, up 63.14%. While its percentage gain is lower than Janction's, Doodles is still showing notable strength. The next question is whether it can maintain its momentum and close the performance gap.
For now, Janction leads the race with more than double Doodles' percentage gain. However, in crypto markets, momentum can change quickly, and the strongest performer today is not guaranteed to remain the leader tomorrow.
Both coins have caught the market's attention, but traders will be watching volume, price action, and whether these gains can hold.
{future}(JCTUSDT)
{future}(DOODUSDT)
$JCT vs $DOOD : Which Coin Has the Stronger Momentum?
The competition is heating up in the crypto perpetual market, and two coins are attracting attention with impressive price movements: Janction (JCTUSDT) and Doodles (DOODUSDT).
Janction is currently trading at $0.004611, with an impressive gain of 135.38%. Its strong upward move puts it ahead in this comparison, showing significantly stronger short-term momentum. A rally of this size can attract traders looking for continued upside, although sharp moves can also bring increased volatility and profit-taking.
On the other side, Doodles (DOODUSDT) is trading at $0.002160, up 63.14%. While its percentage gain is lower than Janction's, Doodles is still showing notable strength. The next question is whether it can maintain its momentum and close the performance gap.
For now, Janction leads the race with more than double Doodles' percentage gain. However, in crypto markets, momentum can change quickly, and the strongest performer today is not guaranteed to remain the leader tomorrow.
Both coins have caught the market's attention, but traders will be watching volume, price action, and whether these gains can hold.
The competition is heating up in the crypto perpetual market, and two coins are attracting attention with impressive price movements: Janction (JCTUSDT) and Doodles (DOODUSDT).
Janction is currently trading at $0.004611, with an impressive gain of 135.38%. Its strong upward move puts it ahead in this comparison, showing significantly stronger short-term momentum. A rally of this size can attract traders looking for continued upside, although sharp moves can also bring increased volatility and profit-taking.
On the other side, Doodles (DOODUSDT) is trading at $0.002160, up 63.14%. While its percentage gain is lower than Janction's, Doodles is still showing notable strength. The next question is whether it can maintain its momentum and close the performance gap.
For now, Janction leads the race with more than double Doodles' percentage gain. However, in crypto markets, momentum can change quickly, and the strongest performer today is not guaranteed to remain the leader tomorrow.
Both coins have caught the market's attention, but traders will be watching volume, price action, and whether these gains can hold.
Which coin are you backing
6%
JCTUSDT
51%
DOODUSDT?
43%
82 votes • Voting closed
1
3.5k
·
--
$BR / USDT Perp: Big Volatility Alert
BR is on the move and the chart is not quiet
If you are watching the 15m timeframe you already know the swings are massive
Last Price is $0.71442 (about PKR197.79), up +47.05% in the last 24h, with Mark Price at $0.71491
24h High sits at $0.74999 and 24h Low at $0.47102
24h Volume is 976.66M BR, or $611.49M in USDT
Price slid hard from the $0.65 zone down to a low of $0.55447 with heavy red candles
Buyers stepped in and launched a sharp run straight up to a high of $0.74999, with a buy signal marking the bottom of that move
Sellers hit back right at the top with a sell signal and dragged price down to the $0.63 area
Buyers stepped in again and pushed price back up with a choppy climb, and now it is holding near $0.71428
Right now BR is sitting around $0.71442 after one of the wildest swings on the board
The market is deciding if this is a bottom forming or more downside ahead
Support is at $0.67374 with $0.63072 below it, and the $0.55447 low is the key floor on this chart
Resistance is at $0.71675 with $0.74999 as the recent swing high and $0.75977 just above it
A clean move above $0.74999 with volume could open the door to fresh highs
A loss of $0.67374 could open the door to a deeper pullback
With $611.49M in USDT volume in 24 hours this is not a sleepy chart
Liquidity is there, volatility is there, and setups are forming on every timeframe
Volatility means opportunity but it also means risk
Use a stop loss, size your position wisely, and never trade money you cannot afford to lose
Not financial advice, always do your own research and trade responsibly
Let's go and trade now $BR
{future}(BRUSDT)
$BR / USDT Perp: Big Volatility Alert
BR is on the move and the chart is not quiet
If you are watching the 15m timeframe you already know the swings are massive
Last Price is $0.71442 (about PKR197.79), up +47.05% in the last 24h, with Mark Price at $0.71491
24h High sits at $0.74999 and 24h Low at $0.47102
24h Volume is 976.66M BR, or $611.49M in USDT
Price slid hard from the $0.65 zone down to a low of $0.55447 with heavy red candles
Buyers stepped in and launched a sharp run straight up to a high of $0.74999, with a buy signal marking the bottom of that move
Sellers hit back right at the top with a sell signal and dragged price down to the $0.63 area
Buyers stepped in again and pushed price back up with a choppy climb, and now it is holding near $0.71428
Right now BR is sitting around $0.71442 after one of the wildest swings on the board
The market is deciding if this is a bottom forming or more downside ahead
Support is at $0.67374 with $0.63072 below it, and the $0.55447 low is the key floor on this chart
Resistance is at $0.71675 with $0.74999 as the recent swing high and $0.75977 just above it
A clean move above $0.74999 with volume could open the door to fresh highs
A loss of $0.67374 could open the door to a deeper pullback
With $611.49M in USDT volume in 24 hours this is not a sleepy chart
Liquidity is there, volatility is there, and setups are forming on every timeframe
Volatility means opportunity but it also means risk
Use a stop loss, size your position wisely, and never trade money you cannot afford to lose
Not financial advice, always do your own research and trade responsibly
Let's go and trade now $BR
BR is on the move and the chart is not quiet
If you are watching the 15m timeframe you already know the swings are massive
Last Price is $0.71442 (about PKR197.79), up +47.05% in the last 24h, with Mark Price at $0.71491
24h High sits at $0.74999 and 24h Low at $0.47102
24h Volume is 976.66M BR, or $611.49M in USDT
Price slid hard from the $0.65 zone down to a low of $0.55447 with heavy red candles
Buyers stepped in and launched a sharp run straight up to a high of $0.74999, with a buy signal marking the bottom of that move
Sellers hit back right at the top with a sell signal and dragged price down to the $0.63 area
Buyers stepped in again and pushed price back up with a choppy climb, and now it is holding near $0.71428
Right now BR is sitting around $0.71442 after one of the wildest swings on the board
The market is deciding if this is a bottom forming or more downside ahead
Support is at $0.67374 with $0.63072 below it, and the $0.55447 low is the key floor on this chart
Resistance is at $0.71675 with $0.74999 as the recent swing high and $0.75977 just above it
A clean move above $0.74999 with volume could open the door to fresh highs
A loss of $0.67374 could open the door to a deeper pullback
With $611.49M in USDT volume in 24 hours this is not a sleepy chart
Liquidity is there, volatility is there, and setups are forming on every timeframe
Volatility means opportunity but it also means risk
Use a stop loss, size your position wisely, and never trade money you cannot afford to lose
Not financial advice, always do your own research and trade responsibly
Let's go and trade now $BR
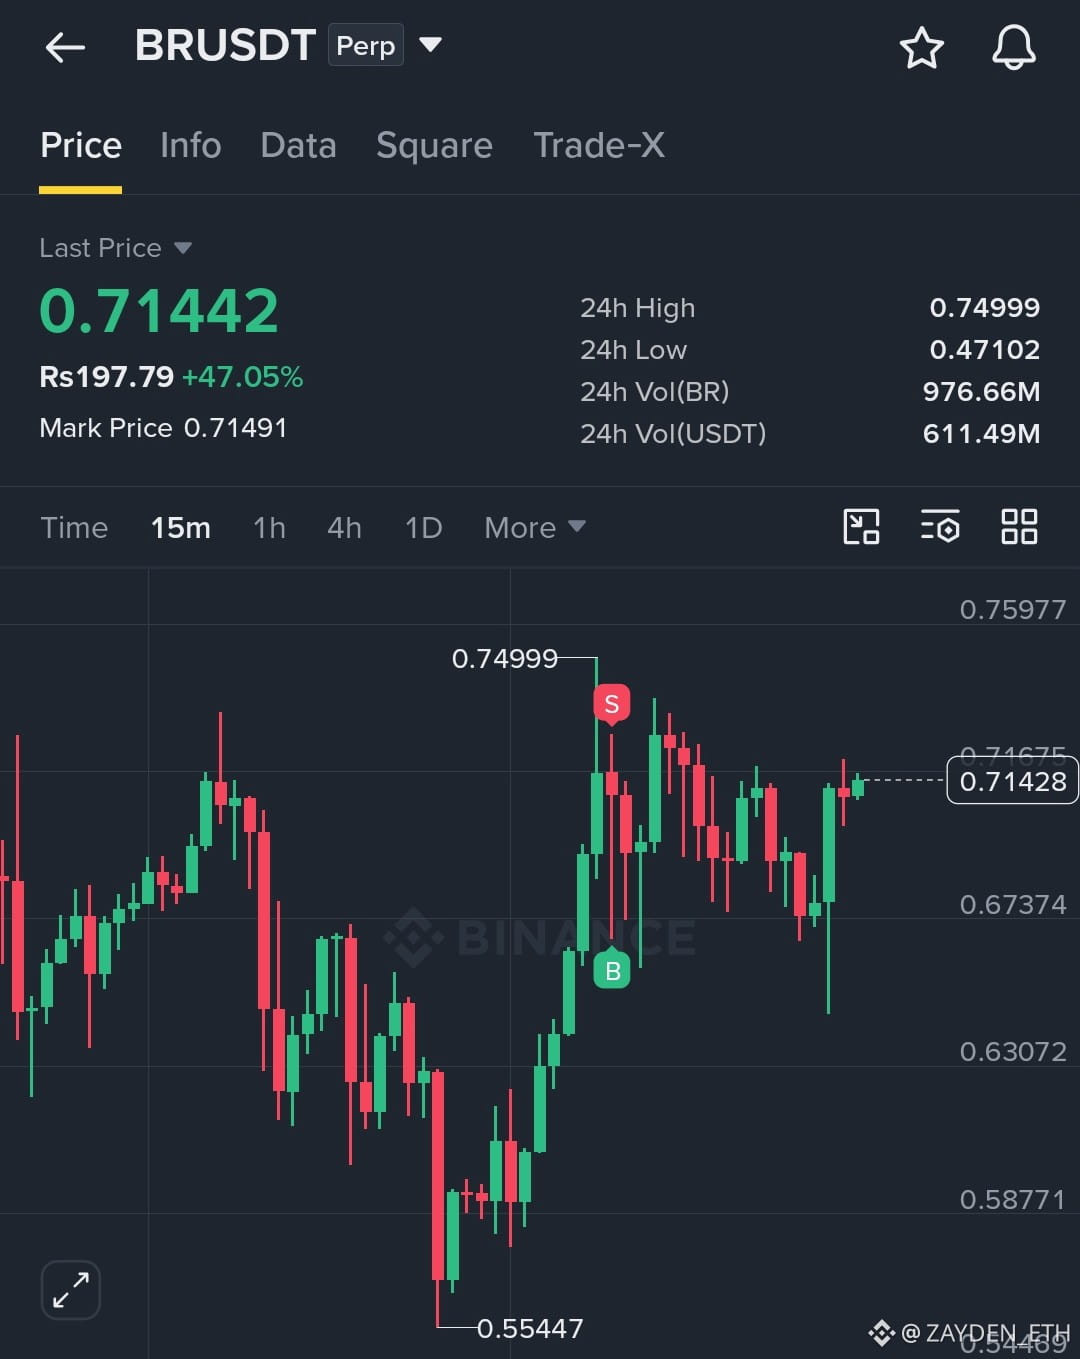
2
489
·
--
$JCT / USDT Perp | Janction: Big Momentum Alert
Janction is on the move and the chart is not quiet
If you are watching the 15m timeframe you already know this is an explosive run
Last Price is $0.003667 (about PKR1.02), up +94.64% in the last 24h, with Mark Price at $0.003678
24h High sits at $0.003839 and 24h Low at $0.001856
24h Volume is 48.30B JCT, or $149.08M in USDT
Price traded flat near $0.001940 for a long stretch with barely any movement
Then buyers took over and a strong steady climb of green candles sent price flying higher with almost no pullback
The rally kept building momentum all the way up to a fresh high of $0.003839
Sellers stepped in right at the top and a red candle pulled price back slightly
Right now JCT is holding around $0.003672 just under that high after one of the sharpest moves on the board
The trend is strongly up and the market is deciding if this is a pause or the next leg higher
Support is at $0.003516 with $0.003098 below it, and the $0.001940 base is the key floor on this chart
Resistance is at $0.003839, the recent swing high, with $0.003934 just above it
A clean move above $0.003839 with volume could open the door to fresh highs
A loss of $0.003516 could bring a sharper pullback toward $0.003098
With $149.08M in USDT volume in 24 hours this is not a sleepy chart
Liquidity is there, volatility is there, and setups are forming on every timeframe
Volatility means opportunity but it also means risk
Use a stop loss, size your position wisely, and never trade money you cannot afford to lose
Not financial advice, always do your own research and trade responsibly
Let's go and trade now $JCT
{future}(JCTUSDT)
$JCT / USDT Perp | Janction: Big Momentum Alert
Janction is on the move and the chart is not quiet
If you are watching the 15m timeframe you already know this is an explosive run
Last Price is $0.003667 (about PKR1.02), up +94.64% in the last 24h, with Mark Price at $0.003678
24h High sits at $0.003839 and 24h Low at $0.001856
24h Volume is 48.30B JCT, or $149.08M in USDT
Price traded flat near $0.001940 for a long stretch with barely any movement
Then buyers took over and a strong steady climb of green candles sent price flying higher with almost no pullback
The rally kept building momentum all the way up to a fresh high of $0.003839
Sellers stepped in right at the top and a red candle pulled price back slightly
Right now JCT is holding around $0.003672 just under that high after one of the sharpest moves on the board
The trend is strongly up and the market is deciding if this is a pause or the next leg higher
Support is at $0.003516 with $0.003098 below it, and the $0.001940 base is the key floor on this chart
Resistance is at $0.003839, the recent swing high, with $0.003934 just above it
A clean move above $0.003839 with volume could open the door to fresh highs
A loss of $0.003516 could bring a sharper pullback toward $0.003098
With $149.08M in USDT volume in 24 hours this is not a sleepy chart
Liquidity is there, volatility is there, and setups are forming on every timeframe
Volatility means opportunity but it also means risk
Use a stop loss, size your position wisely, and never trade money you cannot afford to lose
Not financial advice, always do your own research and trade responsibly
Let's go and trade now $JCT
Janction is on the move and the chart is not quiet
If you are watching the 15m timeframe you already know this is an explosive run
Last Price is $0.003667 (about PKR1.02), up +94.64% in the last 24h, with Mark Price at $0.003678
24h High sits at $0.003839 and 24h Low at $0.001856
24h Volume is 48.30B JCT, or $149.08M in USDT
Price traded flat near $0.001940 for a long stretch with barely any movement
Then buyers took over and a strong steady climb of green candles sent price flying higher with almost no pullback
The rally kept building momentum all the way up to a fresh high of $0.003839
Sellers stepped in right at the top and a red candle pulled price back slightly
Right now JCT is holding around $0.003672 just under that high after one of the sharpest moves on the board
The trend is strongly up and the market is deciding if this is a pause or the next leg higher
Support is at $0.003516 with $0.003098 below it, and the $0.001940 base is the key floor on this chart
Resistance is at $0.003839, the recent swing high, with $0.003934 just above it
A clean move above $0.003839 with volume could open the door to fresh highs
A loss of $0.003516 could bring a sharper pullback toward $0.003098
With $149.08M in USDT volume in 24 hours this is not a sleepy chart
Liquidity is there, volatility is there, and setups are forming on every timeframe
Volatility means opportunity but it also means risk
Use a stop loss, size your position wisely, and never trade money you cannot afford to lose
Not financial advice, always do your own research and trade responsibly
Let's go and trade now $JCT
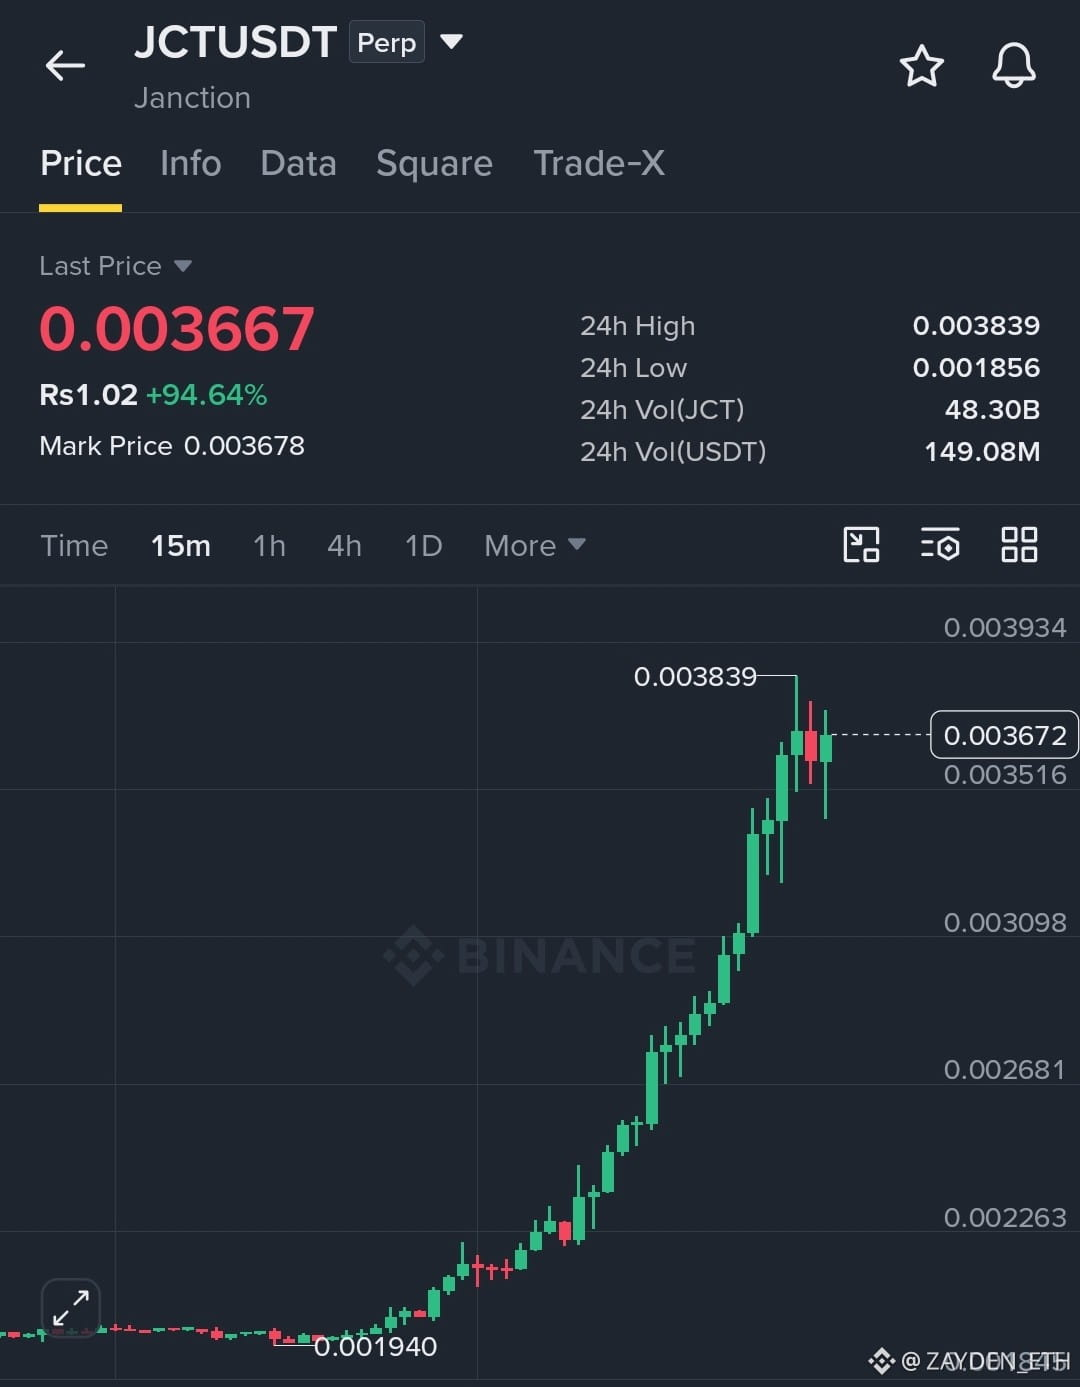
2
561
·
--
$AVA vs $GTC The Battle for Today's Momentum
The competition is heating up as both AVA and Gitcoin (GTC) deliver impressive gains in the perpetual futures market. Both coins are showing strong positive price action, but which one has the edge?
AVA (AVAUSDT) is currently trading at $0.4339, with a gain of +27.84%. AVA is slightly ahead in percentage performance, showing strong upward momentum and attracting attention from traders looking for coins making significant moves.
Meanwhile, Gitcoin (GTCUSDT) is trading at $0.34328, up +27.45%. GTC is also delivering a powerful move, staying remarkably close to AVA's performance. With only a small difference between their gains, the competition remains tight, and the next move could make things even more interesting.
AVA currently leads by just 0.39 percentage points, while GTC is keeping the pressure on. Both are showing substantial gains, but remember that strong short-term performance does not guarantee continued upside, especially in leveraged perpetual markets where volatility can quickly reverse a move.
Now it's time to pick your side.
Which coin are you backing today: AVA or Gitcoin (GTC)? Which one do you think has more upside from here?
{spot}(AVAUSDT)
{spot}(GTCUSDT)
$AVA vs $GTC The Battle for Today's Momentum
The competition is heating up as both AVA and Gitcoin (GTC) deliver impressive gains in the perpetual futures market. Both coins are showing strong positive price action, but which one has the edge?
AVA (AVAUSDT) is currently trading at $0.4339, with a gain of +27.84%. AVA is slightly ahead in percentage performance, showing strong upward momentum and attracting attention from traders looking for coins making significant moves.
Meanwhile, Gitcoin (GTCUSDT) is trading at $0.34328, up +27.45%. GTC is also delivering a powerful move, staying remarkably close to AVA's performance. With only a small difference between their gains, the competition remains tight, and the next move could make things even more interesting.
AVA currently leads by just 0.39 percentage points, while GTC is keeping the pressure on. Both are showing substantial gains, but remember that strong short-term performance does not guarantee continued upside, especially in leveraged perpetual markets where volatility can quickly reverse a move.
Now it's time to pick your side.
Which coin are you backing today: AVA or Gitcoin (GTC)? Which one do you think has more upside from here?
The competition is heating up as both AVA and Gitcoin (GTC) deliver impressive gains in the perpetual futures market. Both coins are showing strong positive price action, but which one has the edge?
AVA (AVAUSDT) is currently trading at $0.4339, with a gain of +27.84%. AVA is slightly ahead in percentage performance, showing strong upward momentum and attracting attention from traders looking for coins making significant moves.
Meanwhile, Gitcoin (GTCUSDT) is trading at $0.34328, up +27.45%. GTC is also delivering a powerful move, staying remarkably close to AVA's performance. With only a small difference between their gains, the competition remains tight, and the next move could make things even more interesting.
AVA currently leads by just 0.39 percentage points, while GTC is keeping the pressure on. Both are showing substantial gains, but remember that strong short-term performance does not guarantee continued upside, especially in leveraged perpetual markets where volatility can quickly reverse a move.
Now it's time to pick your side.
Which coin are you backing today: AVA or Gitcoin (GTC)? Which one do you think has more upside from here?
Which coin will pump moretoday
6%
AVA
47%
Gitcoin (GTC)
47%
32 votes • Voting closed
2
1.2k
·
--
$BR USDT vs $KORU USDT: Which Perp Coin Has the Stronger Momentum?
The competition is heating up as two crypto perpetual contracts show impressive gains. BRUSDT and KORUUSDT are both attracting attention, but which one has the stronger momentum?
BRUSDT (Bedrock) is currently trading at 0.51777 (Rs 143.21), up 21.48%. With the larger percentage gain of the two, BRUSDT is leading the race in the snapshot. Its strong upward move puts it in the spotlight for traders watching short-term momentum.
KORUUSDT (Direxion Korea Bull 3X) is trading at 12.38 (Rs 3,424.3), up 17.12%. It is also showing a strong positive move, delivering a notable gain and keeping the competition close. While its percentage increase is lower than BRUSDT's, it remains a contender for traders tracking market strength.
The comparison:
- BRUSDT: 0.51777 | +21.48%
- KORUUSDT: 12.38 | +17.12%
Based on the displayed figures, BRUSDT is ahead by 4.36 percentage points. However, a strong daily gain does not guarantee continued upside, and perpetual contracts can carry significant risk, especially when leverage is involved.
Now it's your turn to choose a side: Are you backing BRUSDT for its stronger gain, or KORUUSDT for its own bullish momentum? Which one do you think will perform better next?
{future}(KORUUSDT)
{future}(BRUSDT)
$BR USDT vs $KORU USDT: Which Perp Coin Has the Stronger Momentum?
The competition is heating up as two crypto perpetual contracts show impressive gains. BRUSDT and KORUUSDT are both attracting attention, but which one has the stronger momentum?
BRUSDT (Bedrock) is currently trading at 0.51777 (Rs 143.21), up 21.48%. With the larger percentage gain of the two, BRUSDT is leading the race in the snapshot. Its strong upward move puts it in the spotlight for traders watching short-term momentum.
KORUUSDT (Direxion Korea Bull 3X) is trading at 12.38 (Rs 3,424.3), up 17.12%. It is also showing a strong positive move, delivering a notable gain and keeping the competition close. While its percentage increase is lower than BRUSDT's, it remains a contender for traders tracking market strength.
The comparison:
- BRUSDT: 0.51777 | +21.48%
- KORUUSDT: 12.38 | +17.12%
Based on the displayed figures, BRUSDT is ahead by 4.36 percentage points. However, a strong daily gain does not guarantee continued upside, and perpetual contracts can carry significant risk, especially when leverage is involved.
Now it's your turn to choose a side: Are you backing BRUSDT for its stronger gain, or KORUUSDT for its own bullish momentum? Which one do you think will perform better next?
The competition is heating up as two crypto perpetual contracts show impressive gains. BRUSDT and KORUUSDT are both attracting attention, but which one has the stronger momentum?
BRUSDT (Bedrock) is currently trading at 0.51777 (Rs 143.21), up 21.48%. With the larger percentage gain of the two, BRUSDT is leading the race in the snapshot. Its strong upward move puts it in the spotlight for traders watching short-term momentum.
KORUUSDT (Direxion Korea Bull 3X) is trading at 12.38 (Rs 3,424.3), up 17.12%. It is also showing a strong positive move, delivering a notable gain and keeping the competition close. While its percentage increase is lower than BRUSDT's, it remains a contender for traders tracking market strength.
The comparison:
- BRUSDT: 0.51777 | +21.48%
- KORUUSDT: 12.38 | +17.12%
Based on the displayed figures, BRUSDT is ahead by 4.36 percentage points. However, a strong daily gain does not guarantee continued upside, and perpetual contracts can carry significant risk, especially when leverage is involved.
Now it's your turn to choose a side: Are you backing BRUSDT for its stronger gain, or KORUUSDT for its own bullish momentum? Which one do you think will perform better next?
Which coin are you holding?
4%
KORUUSDT
67%
BRUSDT
29%
51 votes • Voting closed
1
4
9.3k
Log in to explore more content
Join global crypto users on Binance Square
⚡️ Get latest and useful information about crypto.
💬 Trusted by the world’s largest crypto exchange.
👍 Discover real insights from verified creators.
Email / Phone number