#CryptoCharts101 ### 📑 **#CryptoCharts101**
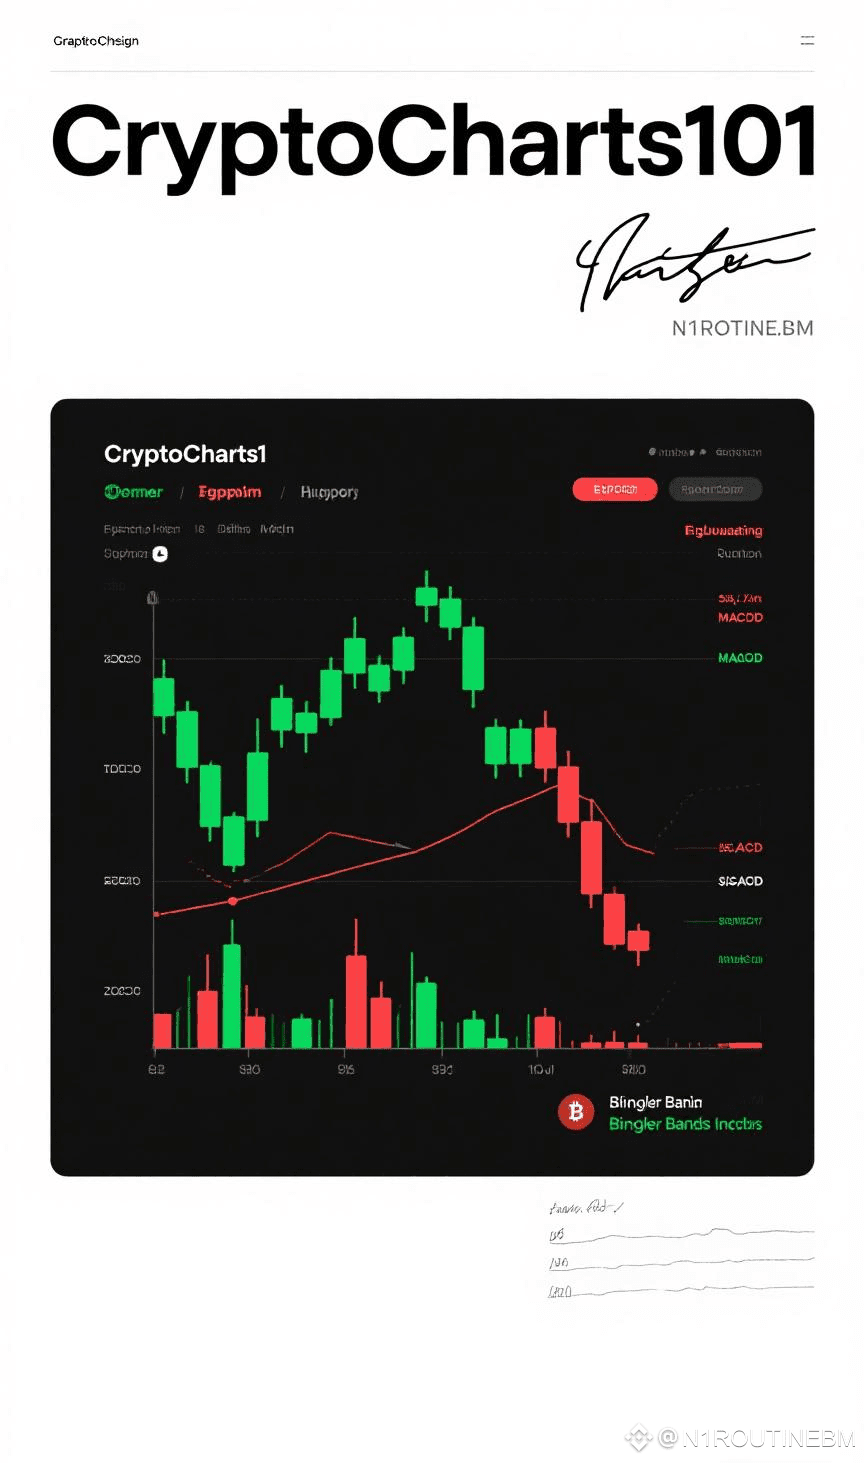
Reading crypto charts is essential for traders. The **candlestick chart** shows open, close, high, and low prices — green for up, red for down. Watch patterns like **Doji, Hammer, and Engulfing** — they hint at trend reversals. Use **support and resistance levels** to spot likely price turning points. Volume bars show trading strength — rising volume confirms strong moves. Indicators like **RSI, MACD, and Bollinger Bands** help detect overbought or oversold zones. Avoid trading on charts alone — combine technical signals with news and market sentiment for the best results.
📊 Read the chart. Master the market. Signed: **N1ROTINEBM**
Reading crypto charts is essential for traders. The **candlestick chart** shows open, close, high, and low prices — green for up, red for down. Watch patterns like **Doji, Hammer, and Engulfing** — they hint at trend reversals. Use **support and resistance levels** to spot likely price turning points. Volume bars show trading strength — rising volume confirms strong moves. Indicators like **RSI, MACD, and Bollinger Bands** help detect overbought or oversold zones. Avoid trading on charts alone — combine technical signals with news and market sentiment for the best results.
📊 Read the chart. Master the market. Signed: **N1ROTINEBM**