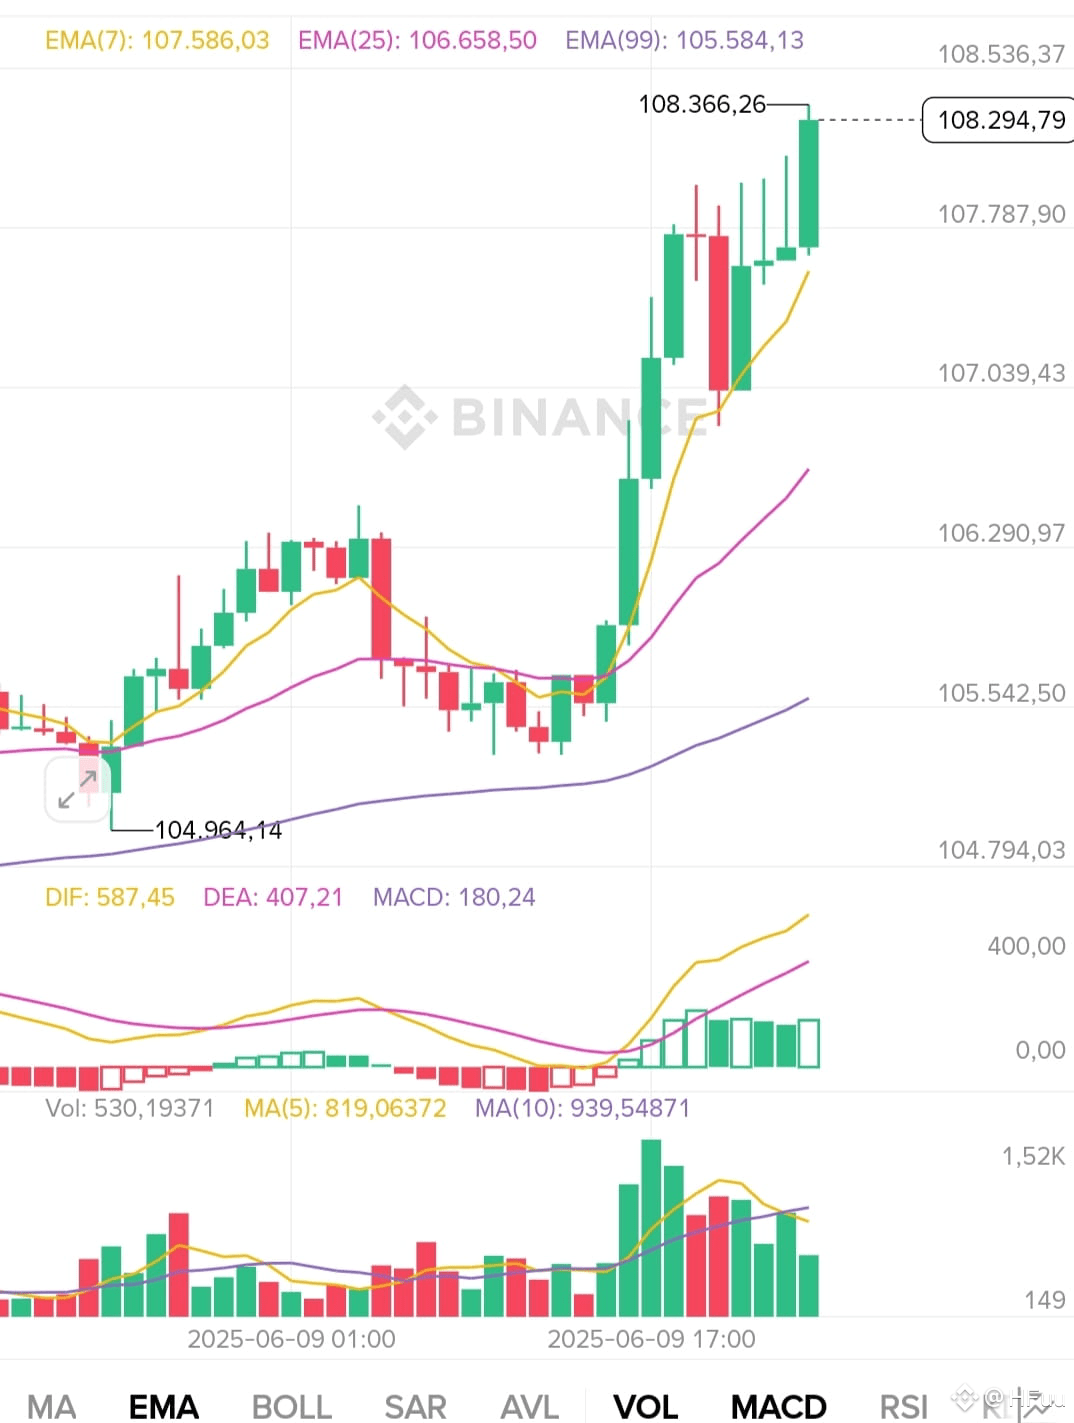
📈 Bitcoin's Recent Volatility and Potential for a Bull Run 💸💸💸
- Bitcoin recently experienced a significant 5% drop, falling from $106,000 to below $101,000,
causing considerable concern among investors. However, the price has since recovered to nearly $105,000, a rebound of over 2.5%, indicating strong buying interest.
- Crypto analyst CrypFlow noted on platform X that despite the recent volatility, several technical
indicators suggest Bitcoin is on the verge of a new bull cycle. Key Technical Indicators
- Golden Cross: A notable indicator is the "Golden Cross," where the 50-day moving
average crosses above the 200-day moving average. This bullish signal was last observed in November 2024.
- Downtrend Breakout: Bitcoin has also broken out of a long-term downtrend that began
in December 2024. This mirrors a similar breakout that preceded a strong rally in November 2024.
- Correction Pattern: The recent price correction resembles the 10% dip seen before last
year's explosive surge, further reinforcing the possibility of a repeating bullish cycle.
- CrypFlow suggests that if historical trends repeat, Bitcoin could see a 62% increase, potentially reaching $170,000. However, the immediate target is set at $130,000, representing a 25% increase from the current price. 📈
#BTC $BTC
- Bitcoin recently experienced a significant 5% drop, falling from $106,000 to below $101,000,
causing considerable concern among investors. However, the price has since recovered to nearly $105,000, a rebound of over 2.5%, indicating strong buying interest.
- Crypto analyst CrypFlow noted on platform X that despite the recent volatility, several technical
indicators suggest Bitcoin is on the verge of a new bull cycle. Key Technical Indicators
- Golden Cross: A notable indicator is the "Golden Cross," where the 50-day moving
average crosses above the 200-day moving average. This bullish signal was last observed in November 2024.
- Downtrend Breakout: Bitcoin has also broken out of a long-term downtrend that began
in December 2024. This mirrors a similar breakout that preceded a strong rally in November 2024.
- Correction Pattern: The recent price correction resembles the 10% dip seen before last
year's explosive surge, further reinforcing the possibility of a repeating bullish cycle.
- CrypFlow suggests that if historical trends repeat, Bitcoin could see a 62% increase, potentially reaching $170,000. However, the immediate target is set at $130,000, representing a 25% increase from the current price. 📈
#BTC $BTC