What are Bollinger Bands?
The Bollinger Bands (BB) indicator was invented in the early 1980s by John Bollinger - a trader and financial analyst. This indicator is essentially an oscillator that shows market volatility, indicating whether the market is in overbought or oversold conditions. This tool is widely used in technical analysis.
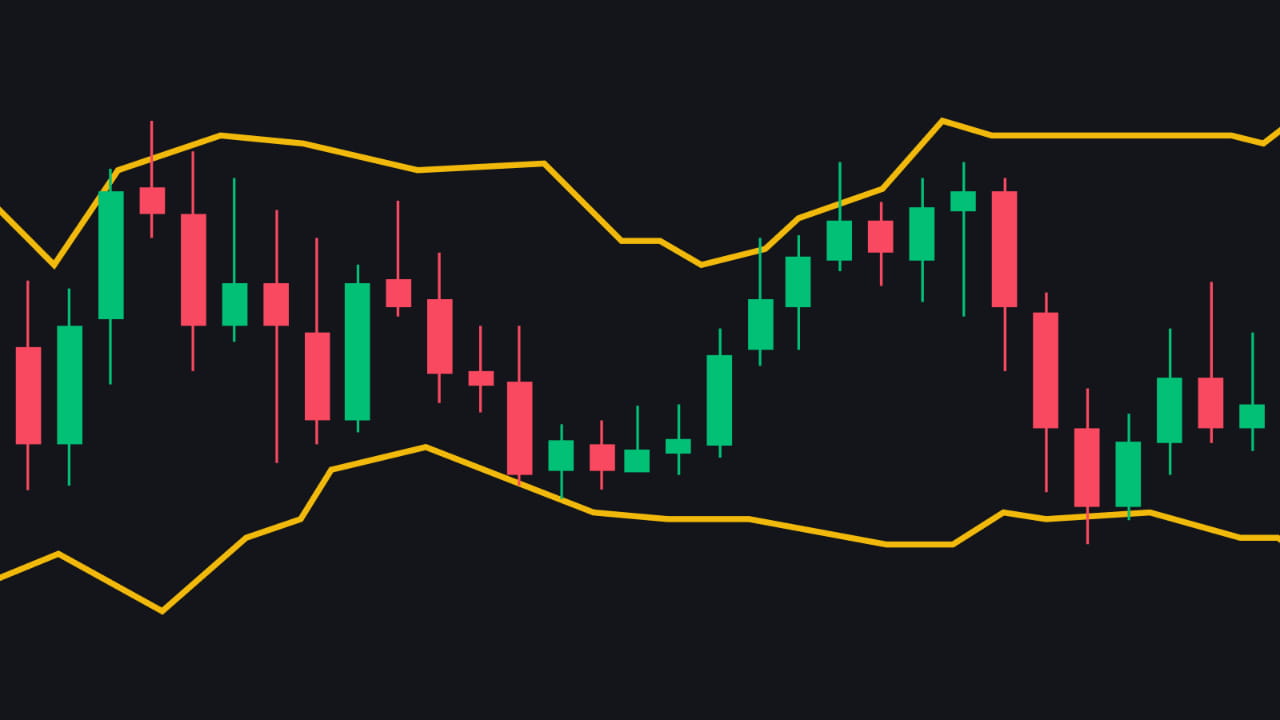
The main meaning of this indicator is to clearly show the dispersion of prices around an average value. Specifically, it includes an upper band, a lower band and a middle moving average (referred to as the middle band). The 2 outer bands are a reaction to the market's price fluctuations, expanding when the price fluctuates a lot (diverging from the middle band) and narrowing when the market is less volatile (converging to the middle band).
The standard formula of Bollinger Bands sets the middle band as a 20-day moving average (SMA), the upper and lower bands are calculated based on the relative volatility to the SMA (considered standard deviation). The Bollinger Bands indicator is normally set as follows:
Middle band: 20-day moving average (SMA)
Upper Band: 20-day SMA + (20-day Standard Deviation x2)
Lower Band: 20-day SMA - (20-day Standard Deviation x2)
The structure of the BB indicator takes the history over a 20-day period, placing the upper and lower bands at a distance of 2 standard deviations from the middle band. This ensures that at least 85% of the price data will fluctuate within those two bands, however the settings can be customized according to the needs of different trading strategies.
Source: https://bit.ly/3ct1PFb