

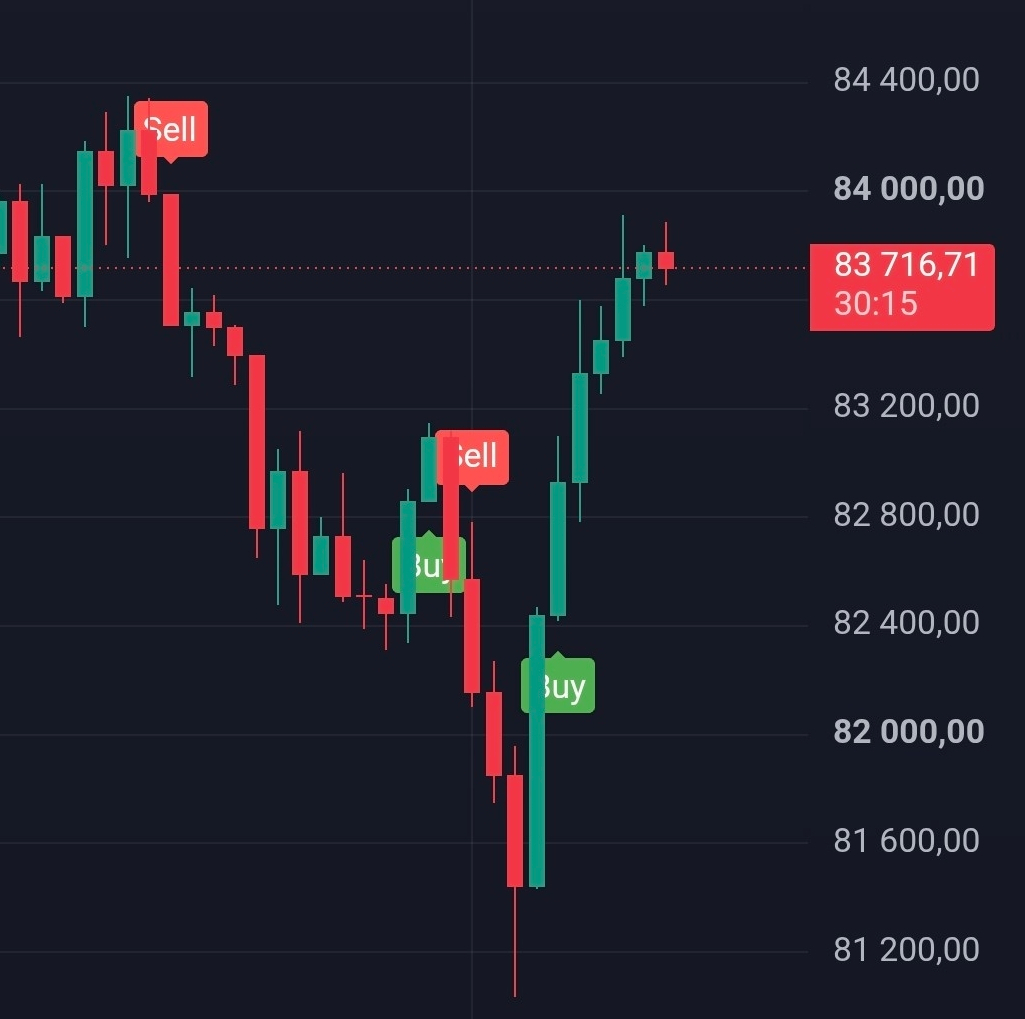
$DOGE
As of May 31, 2025, the price of currency $DOGE (DOGE) is experiencing interesting technical movements, with mixed signals between upward and downward trends.
📊 Current Technical Analysis
Moving Averages (SMA and EMA): Most daily moving averages (from 3 to 200 days) indicate sell signals, reflecting selling pressure in the short and long term.
Relative Strength Index (RSI): The RSI is currently around 37, indicating a neutral state or weakness in buying momentum.
Support and Resistance Levels: Analyses indicate support levels at $0.185 and $0.176–$0.18, while resistance levels are at $0.211 and $0.25.
🚀 Potential Scenarios
Bullish Scenario: If DOGE manages to surpass the resistance of $0.25.
#ElonMuskDOGEDeparture #TrumpMediaBitcoinTreasury #MarketPullback