


📊 Price and Performance Summary
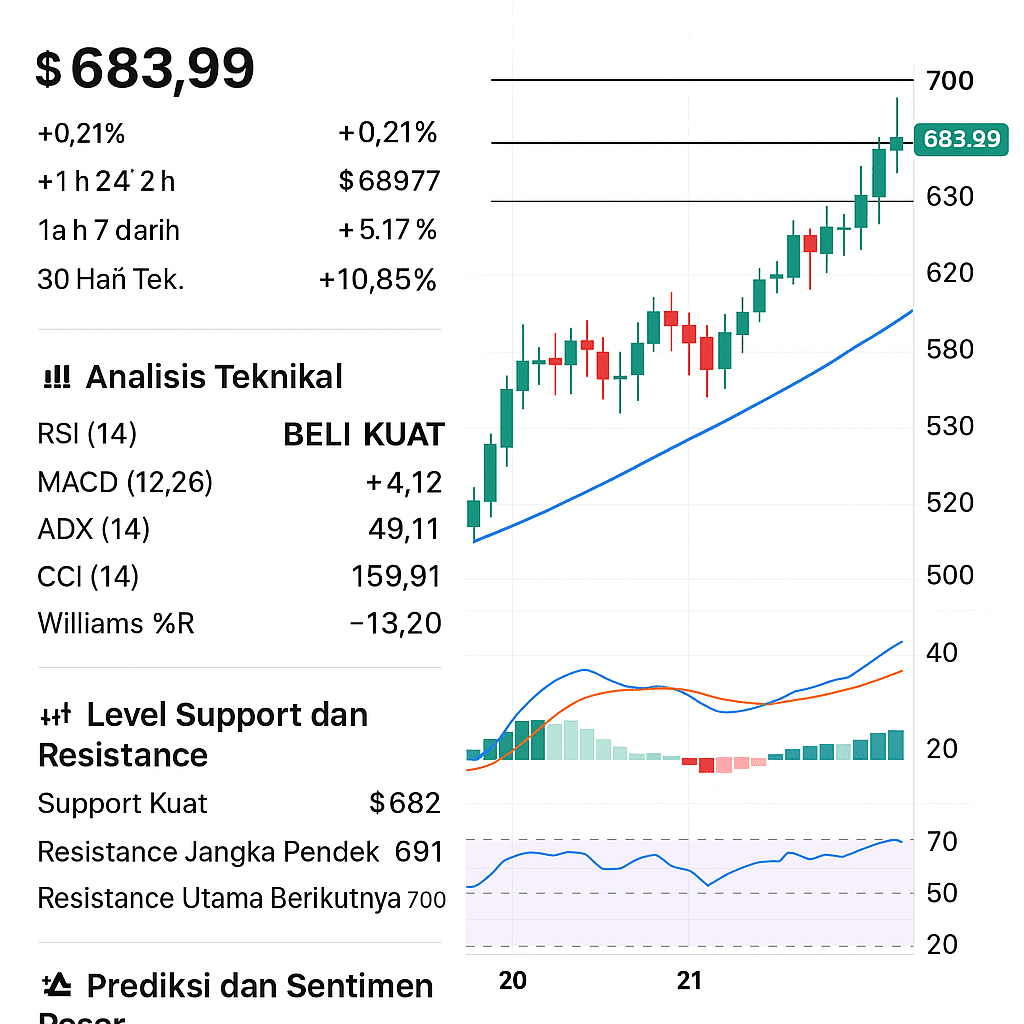
Current Price: $683.99
24 Hour Change: +0.21%
24 Hour High Price: $689.77
24 Hour Low Price: $679.81
Last 7 Days Increase: +5.17%
Last 30 Days Increase: +10.85%
$BNB shows a steady upward trend over the past month, reflecting positive sentiment in the crypto market.
🔍 Technical Analysis
Based on data from Investing.com and TradingView, key technical indicators show a "Strong Buy" signal:
RSI (14): 69.29 – nearing overbought territory, indicating strong bullish momentum.
MACD (12,26): +4.12 – buy signal.
ADX (14): 49.11 – indicates a strong trend.
CCI (14): 159.91 – buy signal.
Williams %R: -13.20 – nearing overbought conditions.
Most indicators support the continuation of BNB's upward trend.

📈 Support and Resistance Levels
Strong Support: $682
Short-Term Resistance: $691
Next Major Resistance: $700
If BNB manages to break through resistance at $691, the potential towards $700 is wide open. However, failure to break this level could trigger a correction towards support at $682.
✅ Conclusion
BNB shows positive performance with technical indicators supporting the upward trend. However, with RSI nearing overbought territory, investors are advised to remain cautious of potential short-term corrections. Close monitoring of resistance levels at $691 and support at $682 is crucial for today's trading strategy.

