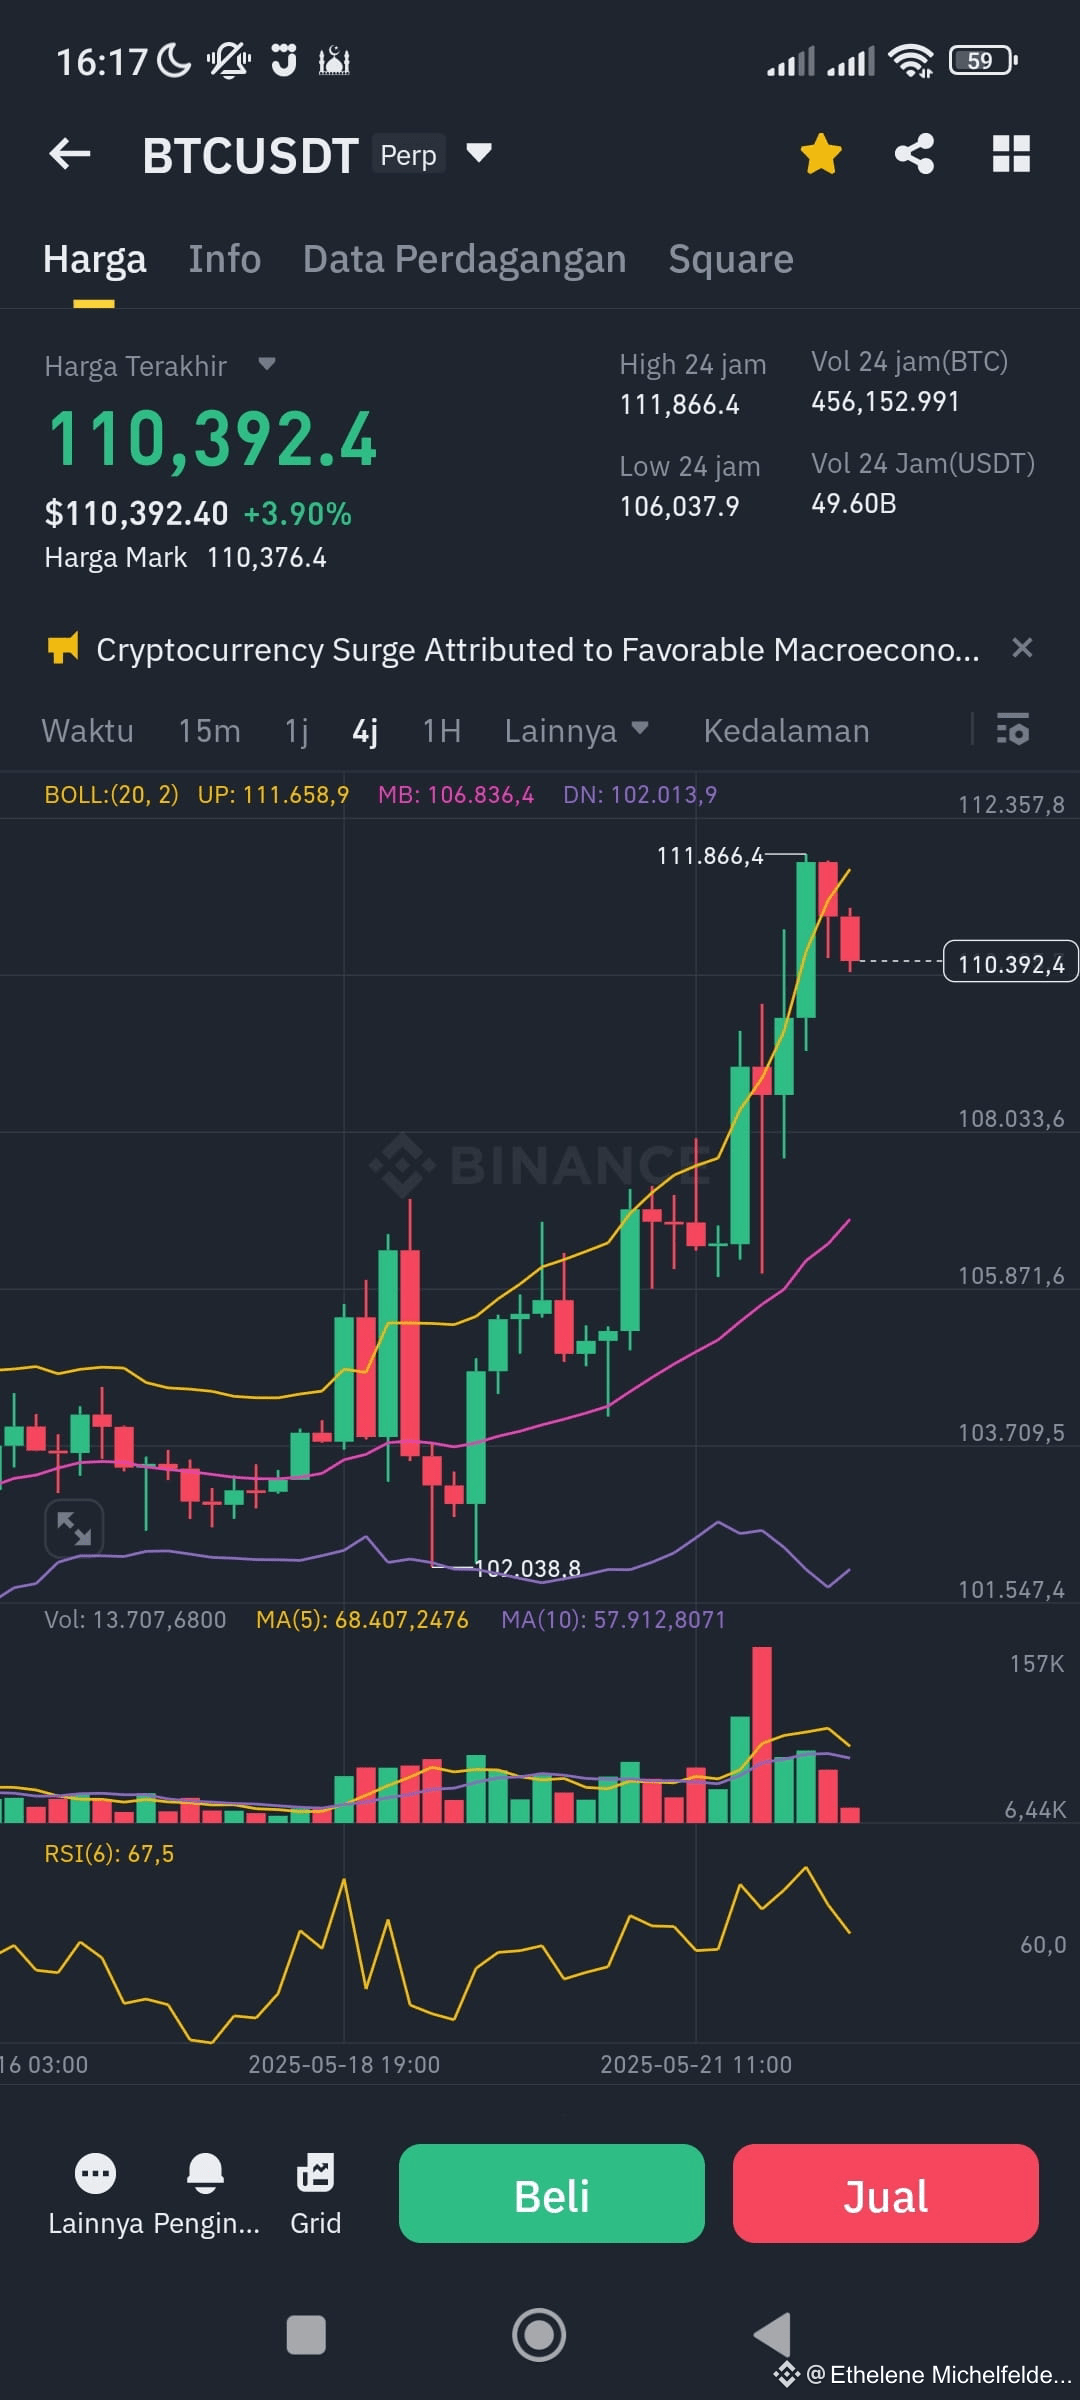
Based on the 4-hour chart (4h) BTC/USDT, here is the short-term technical analysis (next 4 hours):
1. General Trend
A strong uptrend is seen from a series of large green candles and the price position above MA(5), MA(10), and the Mid Bollinger Band (106,836.4).
Last price: 110,392.4 — still in the upper area of the Bollinger Band.
2. Bollinger Bands Indicator
Upper Band: 111,658.9, Middle Band: 106,836.4, Lower Band: 102,013.9
Current price is approaching the Upper Band, which may indicate overbought conditions or potential short-term resistance.
3. RSI (Relative Strength Index)
RSI(6): 67.5 — approaching the overbought zone (above 70), indicating potential minor correction or consolidation in the near future.
4. Volume
High volume on the last bullish candle indicates strong buying interest, but volume is starting to decrease, which may signal that momentum is beginning to weaken.
5. Candlestick
The last candle is red with a long upper wick — a signal of selling pressure near resistance 111,866.4.
Conclusion for the Next 4 Hours
It is likely that the price will experience consolidation or a slight retracement to the nearest support area:
First support: 108,000 – 108,500
Second support (Mid BB): 106,800
If buying pressure re-emerges, the price could attempt to break through the resistance at 111,866.4.
Trading Scenario
Buy during a correction in the support area (e.g., 108,500) if RSI drops and a bullish confirmation candle appears.
Avoid new entries when the price is too close to the upper Bollinger and RSI is high.
#BinanceAlphaAlert $BTC
1. General Trend
A strong uptrend is seen from a series of large green candles and the price position above MA(5), MA(10), and the Mid Bollinger Band (106,836.4).
Last price: 110,392.4 — still in the upper area of the Bollinger Band.
2. Bollinger Bands Indicator
Upper Band: 111,658.9, Middle Band: 106,836.4, Lower Band: 102,013.9
Current price is approaching the Upper Band, which may indicate overbought conditions or potential short-term resistance.
3. RSI (Relative Strength Index)
RSI(6): 67.5 — approaching the overbought zone (above 70), indicating potential minor correction or consolidation in the near future.
4. Volume
High volume on the last bullish candle indicates strong buying interest, but volume is starting to decrease, which may signal that momentum is beginning to weaken.
5. Candlestick
The last candle is red with a long upper wick — a signal of selling pressure near resistance 111,866.4.
Conclusion for the Next 4 Hours
It is likely that the price will experience consolidation or a slight retracement to the nearest support area:
First support: 108,000 – 108,500
Second support (Mid BB): 106,800
If buying pressure re-emerges, the price could attempt to break through the resistance at 111,866.4.
Trading Scenario
Buy during a correction in the support area (e.g., 108,500) if RSI drops and a bullish confirmation candle appears.
Avoid new entries when the price is too close to the upper Bollinger and RSI is high.
#BinanceAlphaAlert $BTC