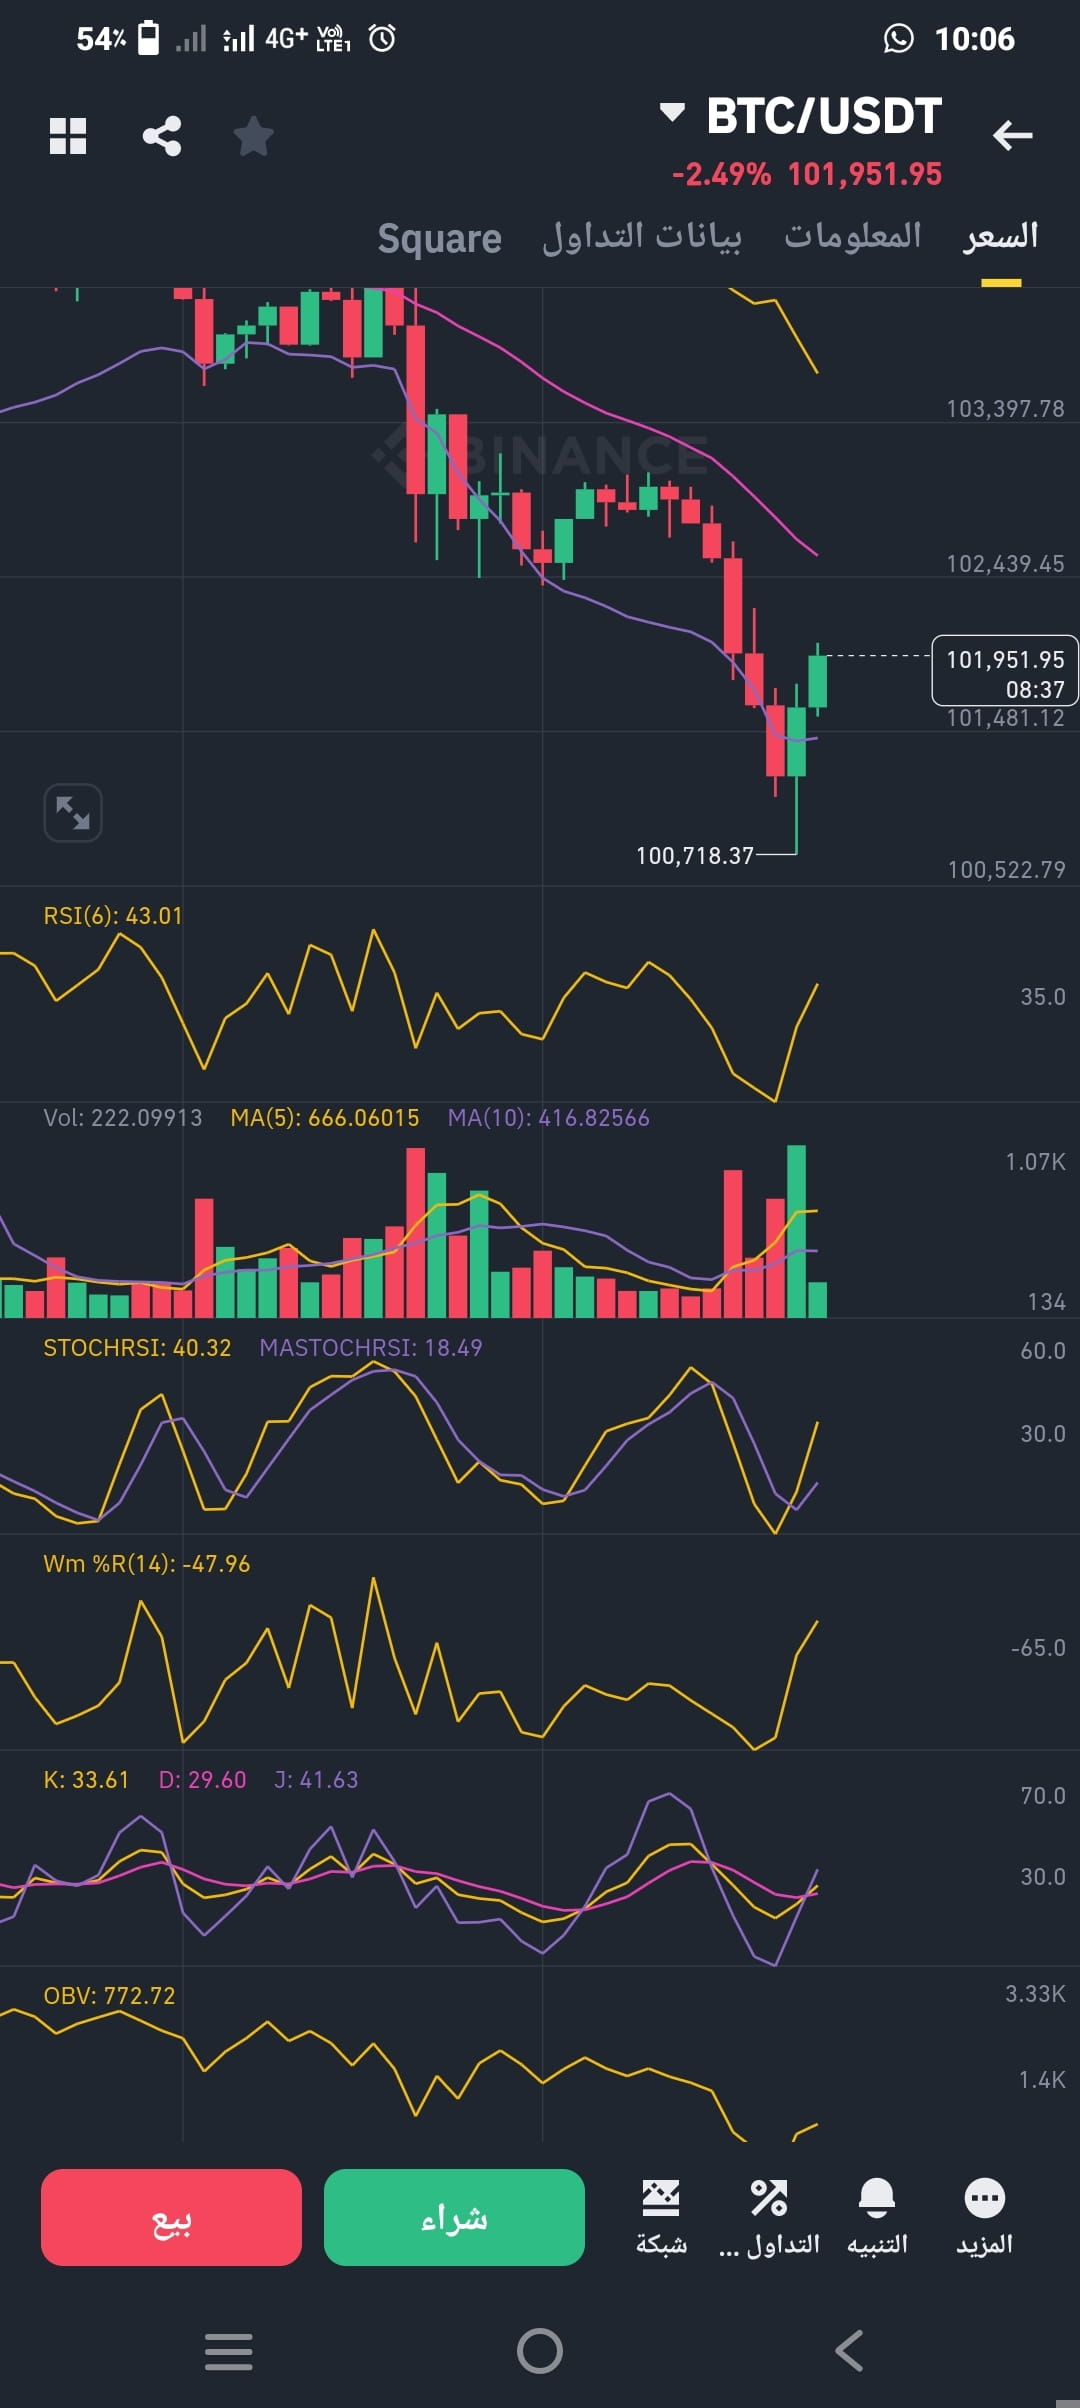
The current price is at 101,951.95 with a clear rebound from the lowest level of 100,718.37.
The last candle is green and indicates a recovery attempt.
2. Moving Averages MA
The price is still below the MA(5) and MA(10) averages, indicating that the overall trend is still bearish in the short term.
3. Relative Strength Index RSI (6) = 43.01
Close to the neutral zone, but rising, which may indicate the beginning of bullish momentum.
4. Stochastic RSI and %Williams
Both show a rebound from oversold levels, supporting the possibility of a short-term rise.
5. OBV Indicator (Volume with Price)
There is no clear upward movement in it, indicating that momentum in terms of volume has not yet been confirmed.
---
Expected outcome over the next 24 hours:
There are initial signals of a recovery attempt.
If the price breaks the 102,500 - 103,000 level with strong trading volume, we may see a rise towards 104,000.
However, if this resistance is not broken, the price may drop again to test 100,700.
The last candle is green and indicates a recovery attempt.
2. Moving Averages MA
The price is still below the MA(5) and MA(10) averages, indicating that the overall trend is still bearish in the short term.
3. Relative Strength Index RSI (6) = 43.01
Close to the neutral zone, but rising, which may indicate the beginning of bullish momentum.
4. Stochastic RSI and %Williams
Both show a rebound from oversold levels, supporting the possibility of a short-term rise.
5. OBV Indicator (Volume with Price)
There is no clear upward movement in it, indicating that momentum in terms of volume has not yet been confirmed.
---
Expected outcome over the next 24 hours:
There are initial signals of a recovery attempt.
If the price breaks the 102,500 - 103,000 level with strong trading volume, we may see a rise towards 104,000.
However, if this resistance is not broken, the price may drop again to test 100,700.