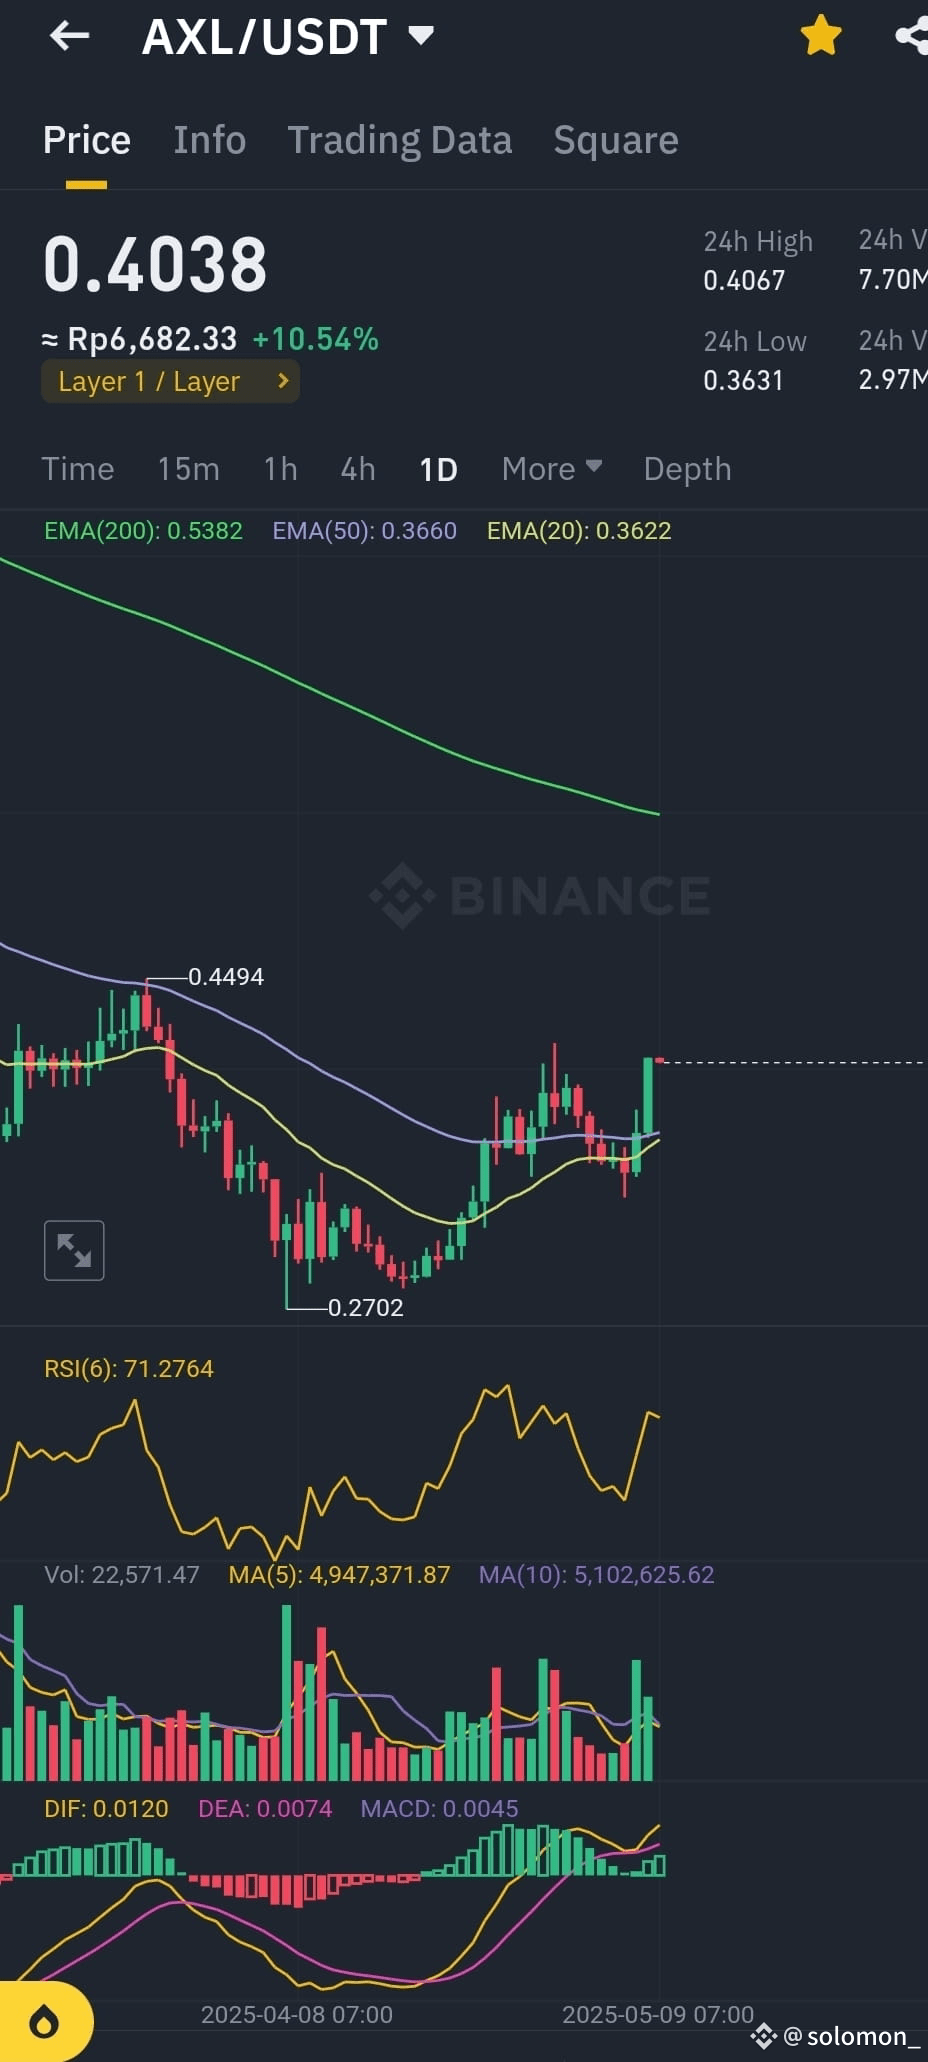
Here’s a concise analysis of the AXL/USDT chart on the 1D (Daily) timeframe:
Current Price: $0.4038 (+10.54%)
Trend Overview
EMA20: $0.3622 (price is above = short-term bullish)
EMA50: $0.3660 (just broken = potential trend reversal)
EMA200: $0.5382 (still far above = long-term downtrend still intact)
Indicators
RSI (6): 71.27 → Overbought territory; suggests caution or possible short-term pullback.
MACD: Bullish crossover with strong green histogram bars, indicating rising momentum.
Volume: Rising — buyers are stepping in strongly.
Price Structure
Price bounced off the $0.2702 low and made higher lows.
Breaking above $0.40 and the 50 EMA confirms bullish structure short term.
Next resistance: around $0.4494 (previous swing high).
Support now sits around $0.3620 - $0.3660 (EMA20/50 zone).
Summary
AXL is showing strong short-term bullish momentum. A daily close above $0.40 is significant. However, RSI being over 70 warns of a potential cooldown or sideways movement before continuing upward.
Plan:
Watch for retest and hold above $0.3660 for safe entry.
TP zones: $0.44 and $0.50+.
Avoid chasing if RSI keeps climbing without a pullback.
#BTCBackto100K #CryptoComeback #TradeStories #StripeStablecoinAccounts
$BTC $XRP $AXL
Current Price: $0.4038 (+10.54%)
Trend Overview
EMA20: $0.3622 (price is above = short-term bullish)
EMA50: $0.3660 (just broken = potential trend reversal)
EMA200: $0.5382 (still far above = long-term downtrend still intact)
Indicators
RSI (6): 71.27 → Overbought territory; suggests caution or possible short-term pullback.
MACD: Bullish crossover with strong green histogram bars, indicating rising momentum.
Volume: Rising — buyers are stepping in strongly.
Price Structure
Price bounced off the $0.2702 low and made higher lows.
Breaking above $0.40 and the 50 EMA confirms bullish structure short term.
Next resistance: around $0.4494 (previous swing high).
Support now sits around $0.3620 - $0.3660 (EMA20/50 zone).
Summary
AXL is showing strong short-term bullish momentum. A daily close above $0.40 is significant. However, RSI being over 70 warns of a potential cooldown or sideways movement before continuing upward.
Plan:
Watch for retest and hold above $0.3660 for safe entry.
TP zones: $0.44 and $0.50+.
Avoid chasing if RSI keeps climbing without a pullback.
#BTCBackto100K #CryptoComeback #TradeStories #StripeStablecoinAccounts
$BTC $XRP $AXL