

Technical analysis began to be used on traditional exchanges long before the advent of digital assets. Now it is actively used in the cryptocurrency market. The basic principles of such trading have remained almost unchanged, and the main innovations have affected programs and tools for optimizing a trader’s work.

The theory of technical analysis in the cryptocurrency market
For those who are not familiar with the cryptocurrency market, it may seem that price charts change chaotically. Proponents of fundamental analytics often argue that using technical analysis it is impossible to determine the reason for price changes and predict future movements. However, technical analysis is based on a completely fundamental theory that the dynamics of price changes depends on the psychology of market participants. In similar situations, people behave in the same way, and the balance of supply and demand is formed under the influence of human instincts - herding, greed, euphoria, fears, panic, etc.
In this case, the actions of each individual trader do not matter. “Crowd psychology” is at work here—the main driving force behind the price of any asset. It is the understanding of such processes that makes it possible to predict the movement of exchange rates.
Objectives of technical analysis of the cryptocurrency market
Technical analysis is the process of studying information about how the price of a cryptocurrency or any other asset changes. The main goal is to find on the chart the prices at which buyers are willing to buy and sellers are willing to sell. These price marks are called support and resistance levels. When the price approaches one of these marks, its “behavior” changes according to one of two scenarios:
rebound and reversal in the opposite direction;
“breakout” of the mark and a strong impulse to continue the movement.
At the same time, the “breakout” may also be false, when the price slightly passes the level and then sharply turns in the opposite direction.
By successfully identifying these levels, a trader can open positions in a favorable direction, that is, buy a cryptocurrency before its price begins to rise, and sell before its price begins to decline.
Depending on the strategy, additional factors may be taken into account in the analysis - for example, trading volumes, the amount of open positions, the number of executed orders, etc.
Basic principles of technical analysis of cryptocurrencies
There are three main principles of technical analysis of cryptocurrencies.
History repeats itself
This rule is based on the same crowd psychology. If market participants react in the same way to the same situations, it means that their reactions are already on the charts and are repeated periodically. Traders try to identify patterns in historical data to predict future changes.
All factors influencing the price are already included in the schedule
According to the theory of technical analysis, the current price takes into account all events and factors that may affect it, including:
technology, marketing and project prospects;
political and economic events;
natural or man-made incidents.
Under the influence of these factors, the price was established at the level at which it is now. That is, the current exchange rate of the cryptocurrency corresponds to its real price.
Price moves according to trends
One fluctuation in the chart may be an accident. A sequence of fluctuations over a certain time is already a trend, that is, the direction in which the price of a cryptocurrency is moving. However, any movement will end sooner or later, and the price will move in a different direction. The trend itself also does not look like a straight line: it is a certain range of successive minimums and maximums.
Trends can be roughly divided into three categories:
sideways - the price fluctuates around the current level without strong deviations;
ascending is a sequence of fluctuations in which each subsequent maximum exceeds the previous one;
downward - each low is lower than the previous one.
The trader’s task is to identify the current trend and predict its stop or change in time.
Features of cryptocurrency trading based on technical analysis
Cryptocurrency trading based on technical analysis is carried out according to the following rules:
All cryptocurrencies are the same. For a trader, it does not matter what to trade: if he sees a suitable situation on the chart, he opens a deal.
The direction doesn't matter. An experienced trader can make money from both the rise and fall of the cryptocurrency price.
There is no bottom or ceiling. No matter how much the cryptocurrency price rises, it can rise even higher. And vice versa: no matter how much the rate falls, it can fall even lower.
Refusal of speculation. The purpose of technical analysis is not to determine the reason for a rise or fall in price (except for crowd psychology).
Refusal to support projects. The trader does not “hope for the best,” does not “believe in the team,” does not “want to support the project,” etc.
Ignoring fundamental factors. The trader does not study projects, their technologies, development features, business methods, etc.
Ignoring the news background. If an event occurs that greatly affects the price of a cryptocurrency, then the trader simply stops trading for a certain period.
If a trader violates any of these rules, then he is not trading according to technical analysis.
Timeframes
A timeframe is a time interval that is used to account for price fluctuations: for example, minute, 15 minutes, hour, 12 hours, day, week, month. The sequence of such intervals forms a graph.
Depending on the timeframe the trader uses, there are several strategies:
Scalping - with such trading, positions can be kept open for a period from several minutes to an hour, rarely more.
Day trading is intraday trading. As a rule, positions are held open for several hours, rarely longer than a day.
Swing trading - trades are held open from one day to several weeks.
Medium-term trading - a trader can hold a position open from several weeks to a year.
Long-term trading - this method is used by passive investors who hold their positions for a year or more.
On short time frames, traders analyze not only the chart, but also order books to determine the current mood of the crowd.
Types of price charts
The exchange terminal allows you to build price charts in different ways. Thus, the same information is displayed in different ways.
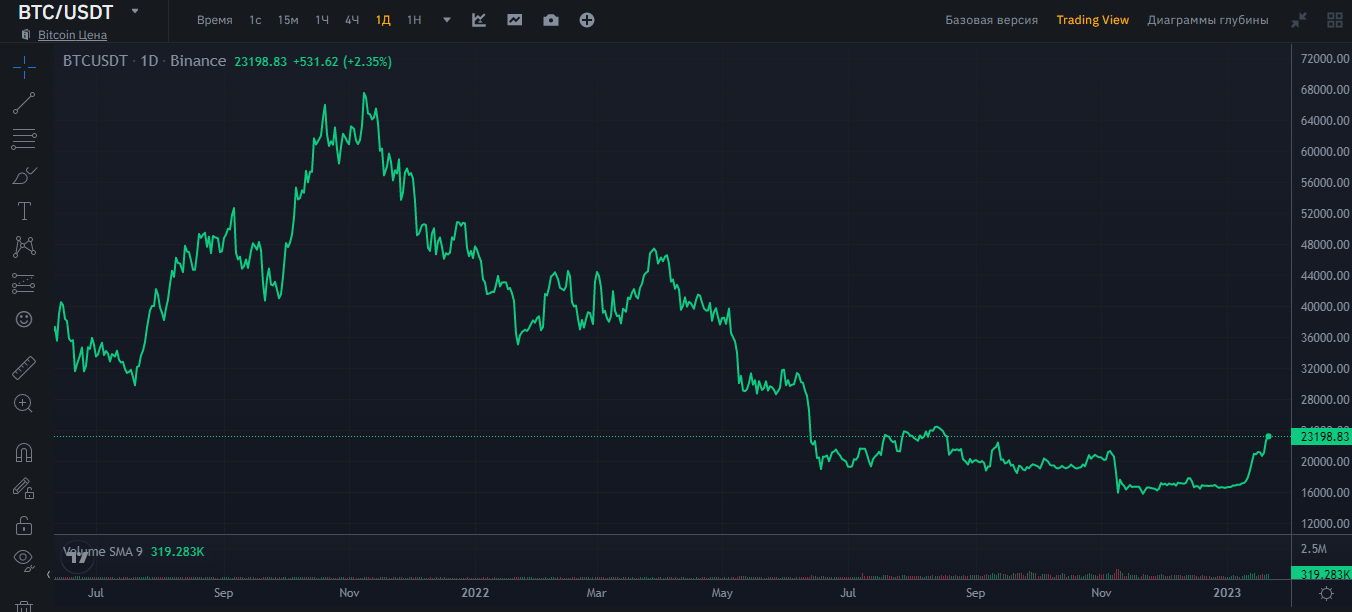
Line graph
Such a graph is constructed in the form of a curved line that connects the end points of periods (minutes, hours, days, etc.). Such a line does not show the maximum and minimum values within one period. It is believed that it does not provide enough information for technical analysis, so it is rarely used in practice.
Everything
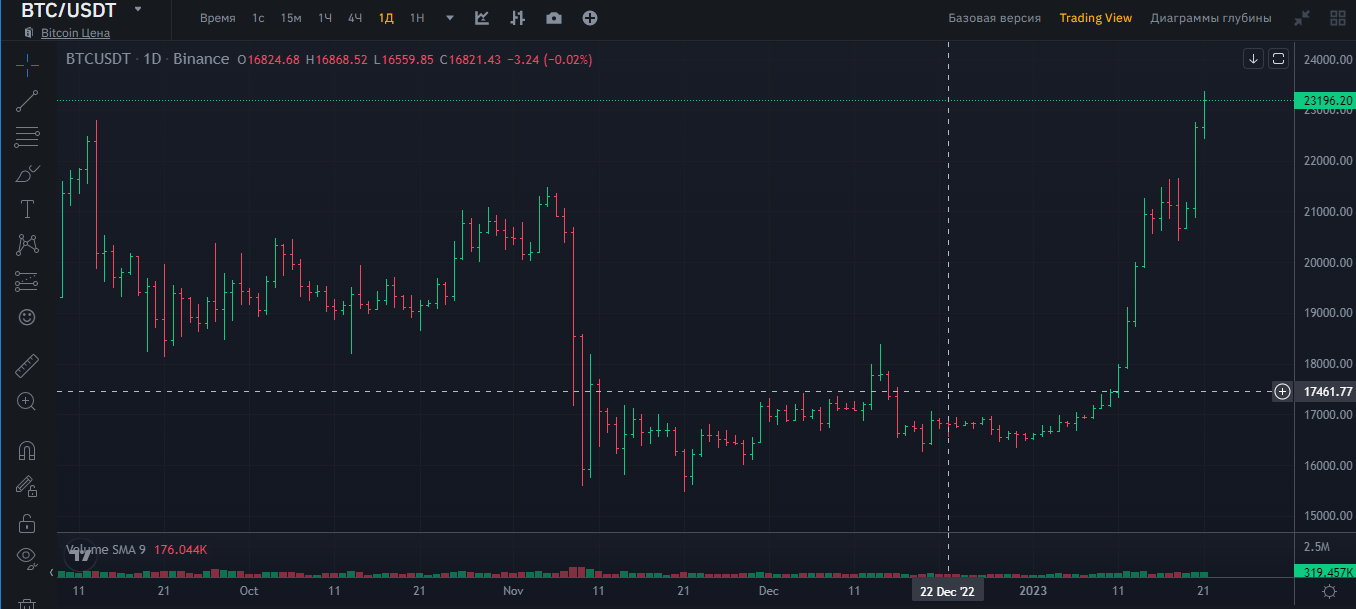
This chart displays the closing level of the period, as well as its maximum and minimum prices. A bar is a vertical line that contains the necessary information:
the top of the line is the maximum cryptocurrency rate for the period;
bottom of the line - minimum rate;
the tick mark on the left is the opening price;
the notch on the right is the closing price.
If the line is red, it usually means that the close was lower than the open, and if it is green, it usually means the opposite.
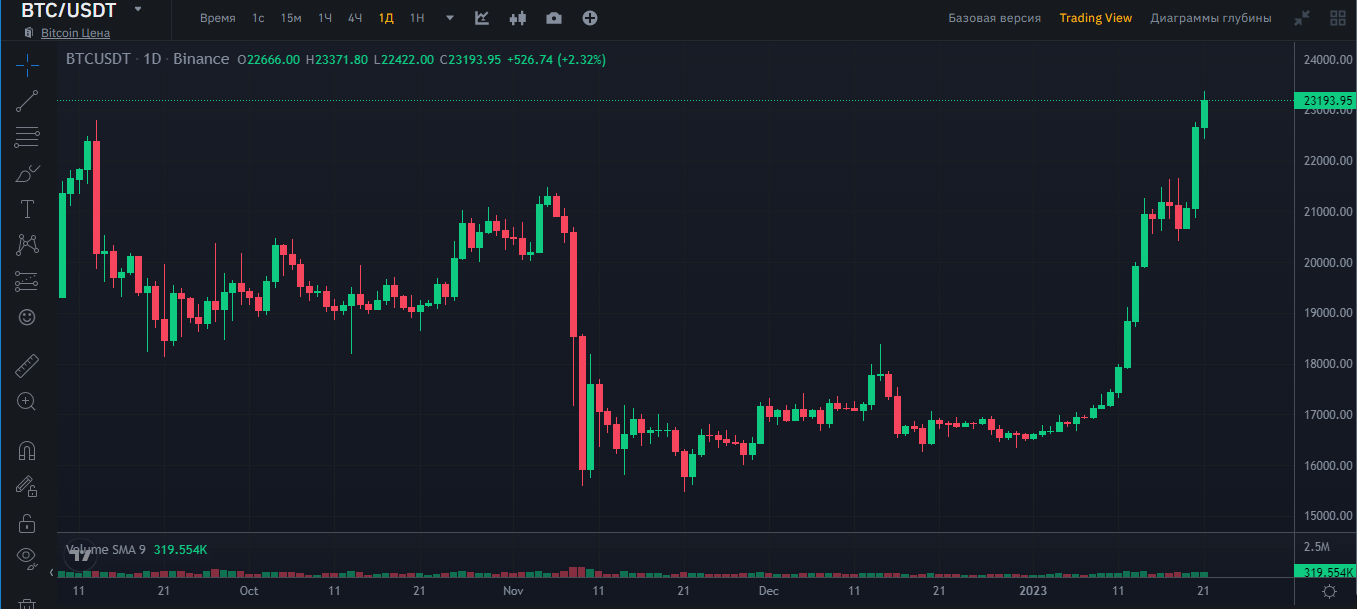
Japanese candles
This chart works similarly to bars, but instead of lines, double-sided candles are used:
The upper wick shows the maximum price for the period.
The lower wick displays the minimum.
The lower and upper end of the candle body shows the opening and closing levels.
A red candle usually indicates that the closing level was lower than the opening, and a green one - vice versa.
Technical analysis figures
To systematize the known patterns of crowd psychology, traders identify technical analysis figures. These are patterns and models that have repeatedly proven themselves in real market conditions. When a familiar figure appears on the chart, the trader opens a position in the desired direction.
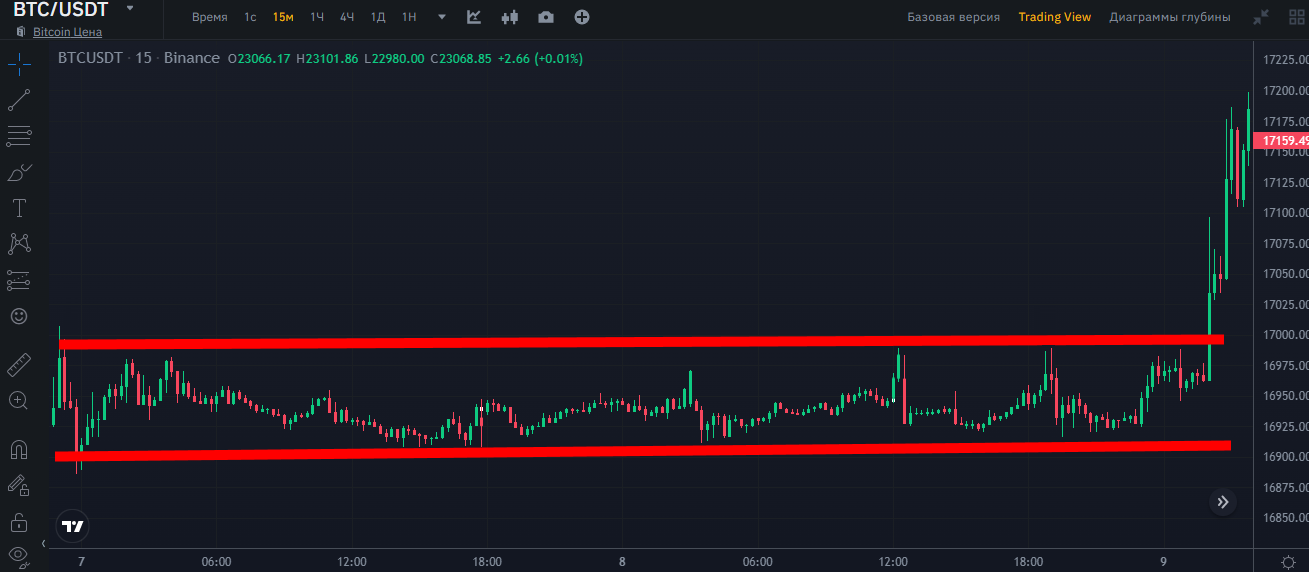
Rectangle (box, corridor)
This is one of the simplest figures, which is formed by two straight lines (support and resistance levels). The price moves between them over a certain period of time.
There are three options for using this figure:
Inside trading is a series of transactions that are opened and closed as they approach the lines of the rectangle.
Breakout up - opening a long position after passing the resistance level.
Breakdown downward - opening a short position after passing the support level.
As a rule, after breaking through the level there is a strong impulse of price movement. The longer the rectangle has been formed, the stronger this movement will be.
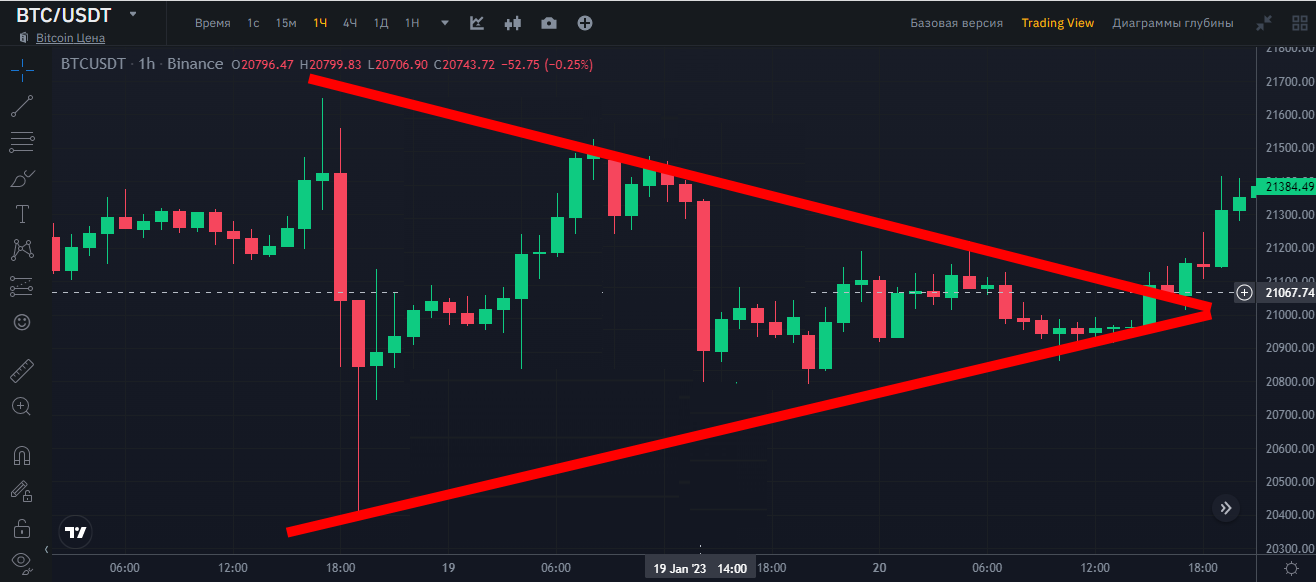
Triangle
A triangle is also a fairly simple figure, which is formed by two lines when volatility subsides. It is expected that after one of the sides of this figure is broken, the movement should continue. The sharper the top of the triangle, the sharper and longer the impulse will be.
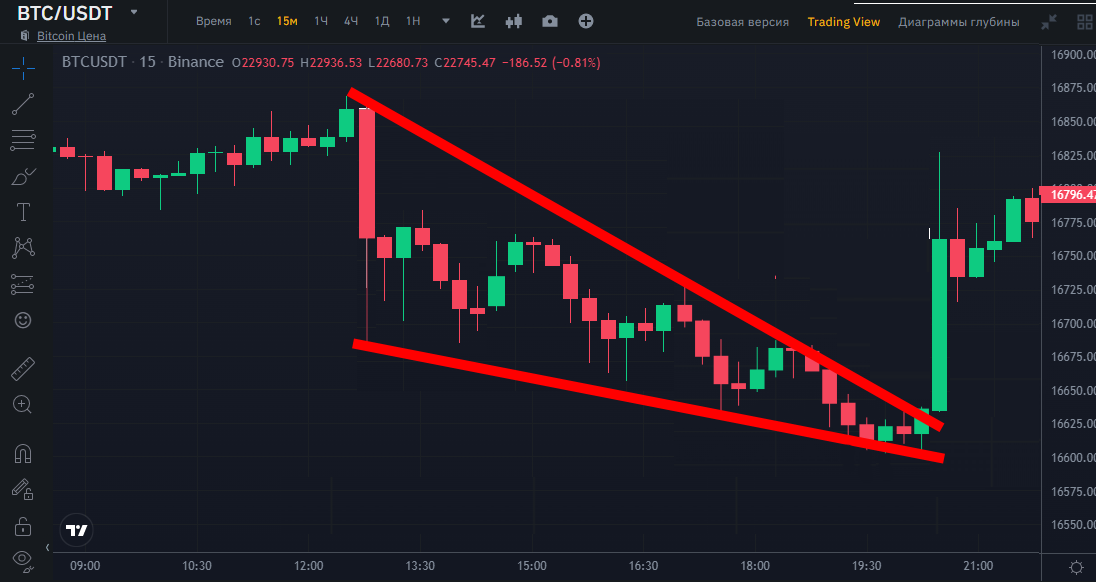
Klin
This figure is similar to a triangle, but both sides of it are directed in the same direction (up or down). The wedge is considered a reversal pattern, so its completion is easier to predict:
the rising wedge breaks down;
descending - upward.
This is its fundamental difference from a triangle, which with equal probability can be broken both up and down.
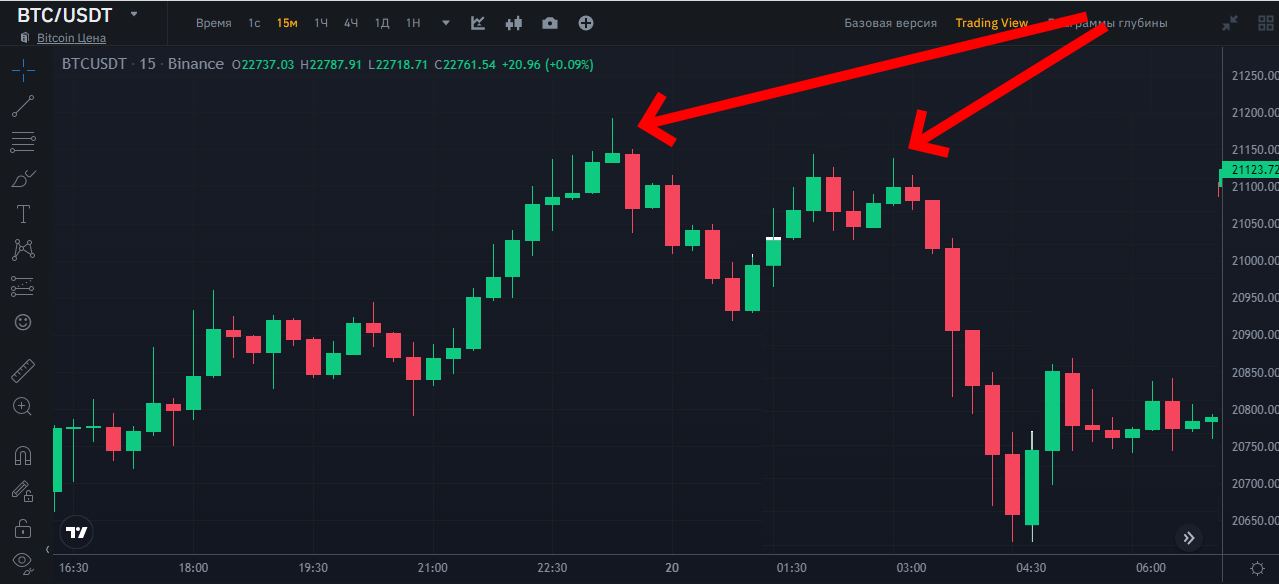
Double top (double bottom)
This is also a reversal pattern, which is quite easy to identify on the chart. A double top forms at a level that the trend cannot break twice. After this, the graph turns around and goes in the opposite direction. The trend is strengthened by the situation when the second peak is smaller than the first.
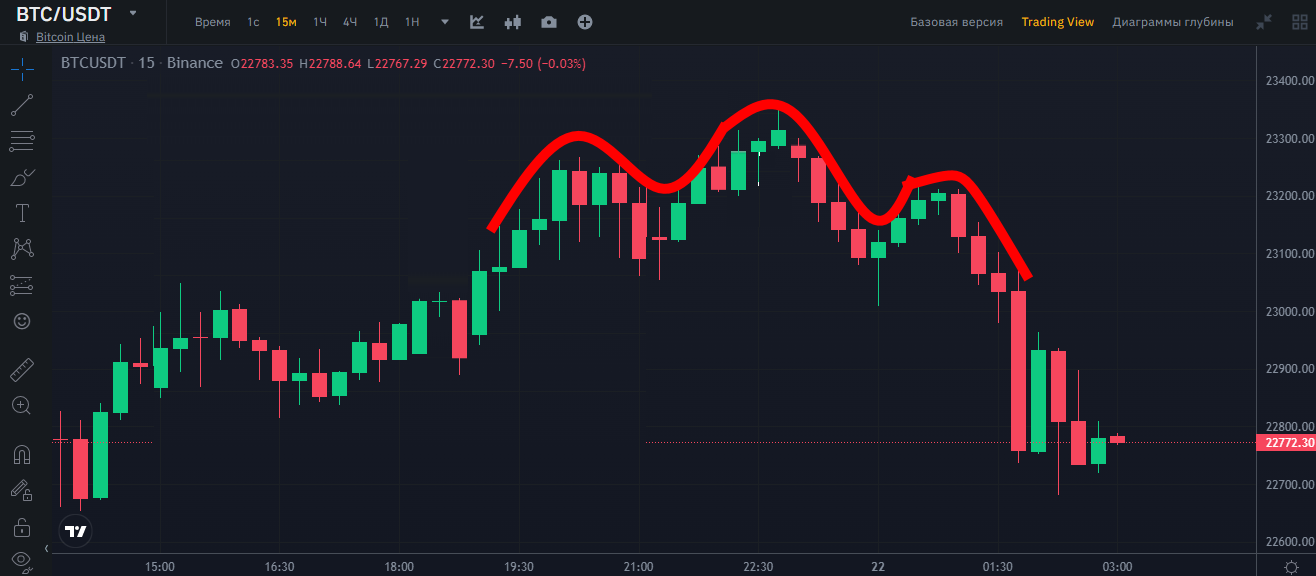
Head and shoulders
Another reversal pattern consisting of three peaks, among which the middle one is higher (or lower) than the other two. The trade must be opened after the second shoulder appears; a riskier option is at the third peak (since the figure has not yet been formed).
Technical analysis indicators
Technical indicators are additional metrics that are the result of automatic analysis of cryptocurrency charts using specified algorithms. They can be divided into four main categories:
trend indicators - display the direction of the trend;
momentum indicators - measure the speed and power of price movement;
volatility indicators - determine the amplitude of the exchange rate movement;
volume indicators - show the strength of the trend taking into account the trading volume.
Depending on the strategy, a trader can use several indicators at once or do without them at all.
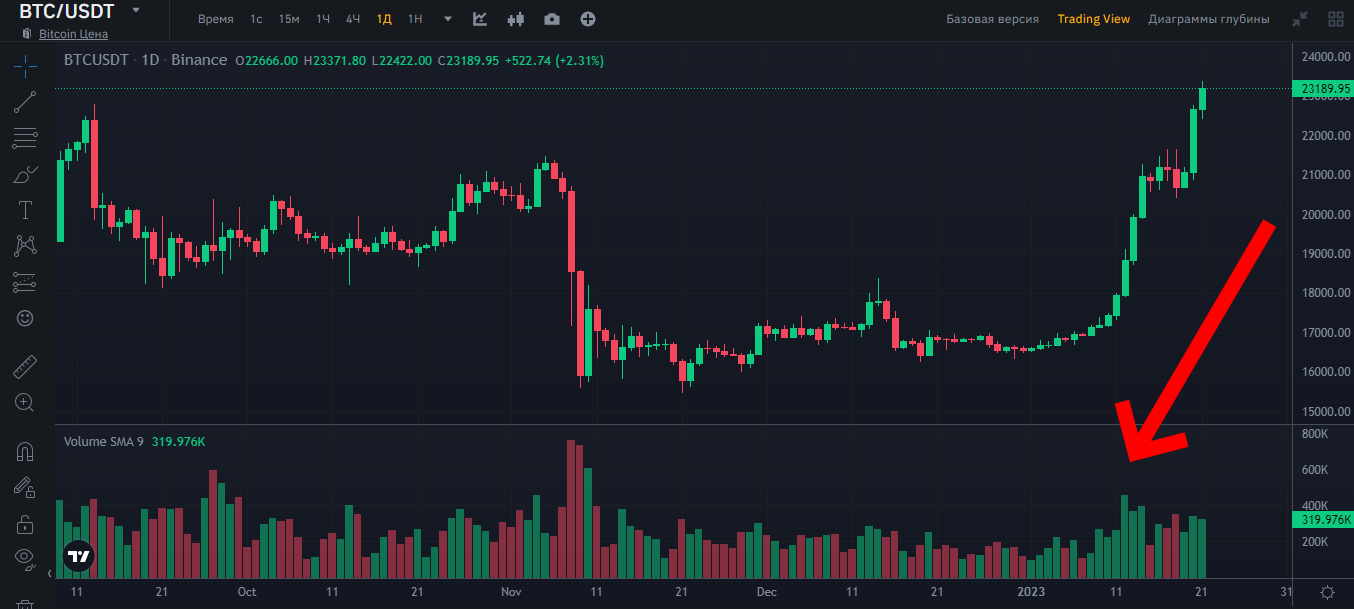
Volume is considered one of the basic indicators of technical analysis. This indicator displays the volume of transactions in each candle and allows you to determine the reliability of the formed trend.
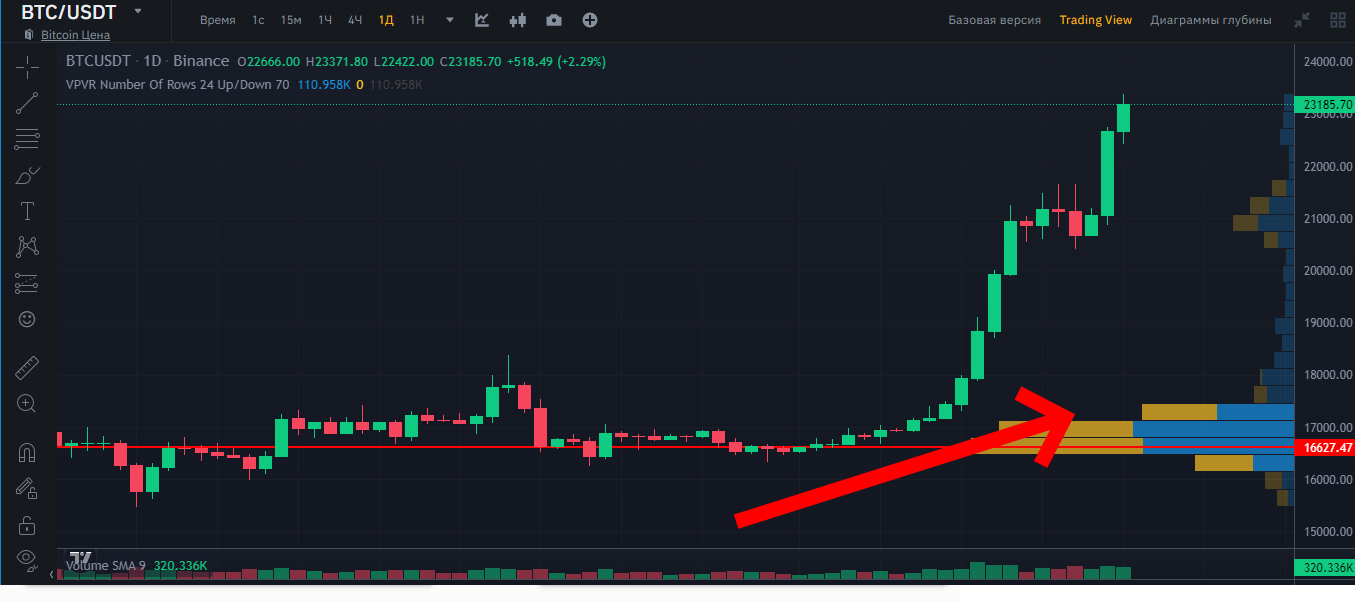
The volume profile works similarly to the standard volume, only it is displayed on the side of the chart rather than from the bottom. This allows you to determine the volumes that were sold at specific price levels.
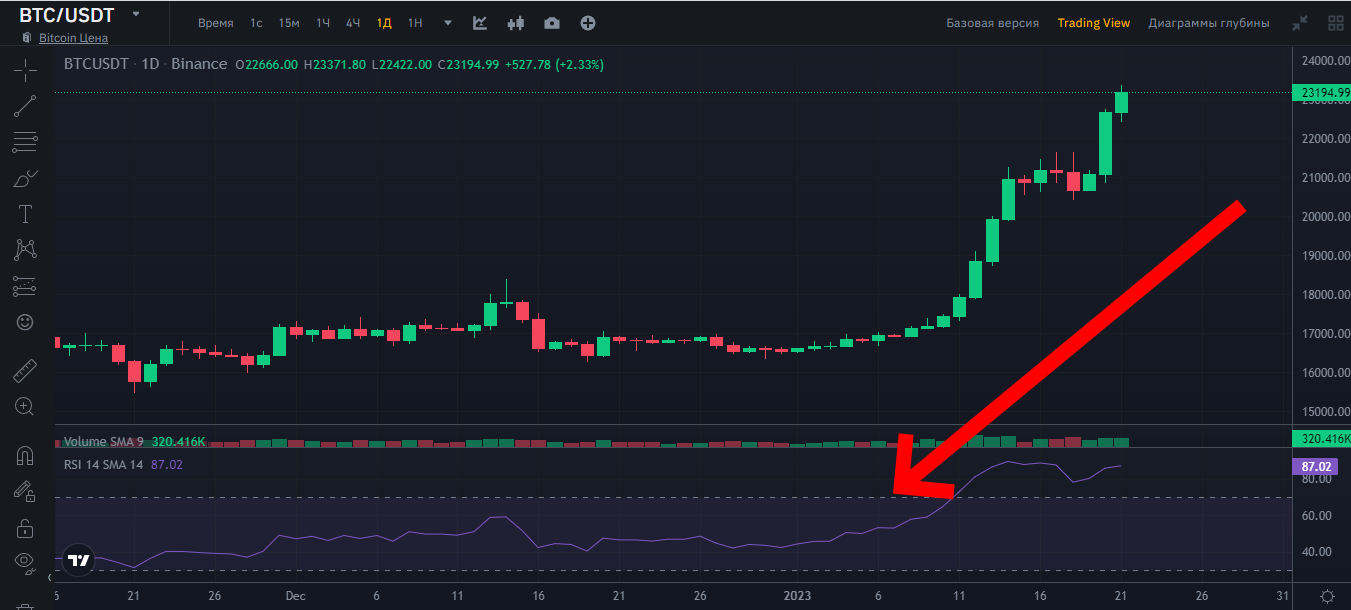
Relative Strength Index (RSI) is a momentum indicator that helps analyze recent price movements and determine whether a cryptocurrency is overbought or oversold.
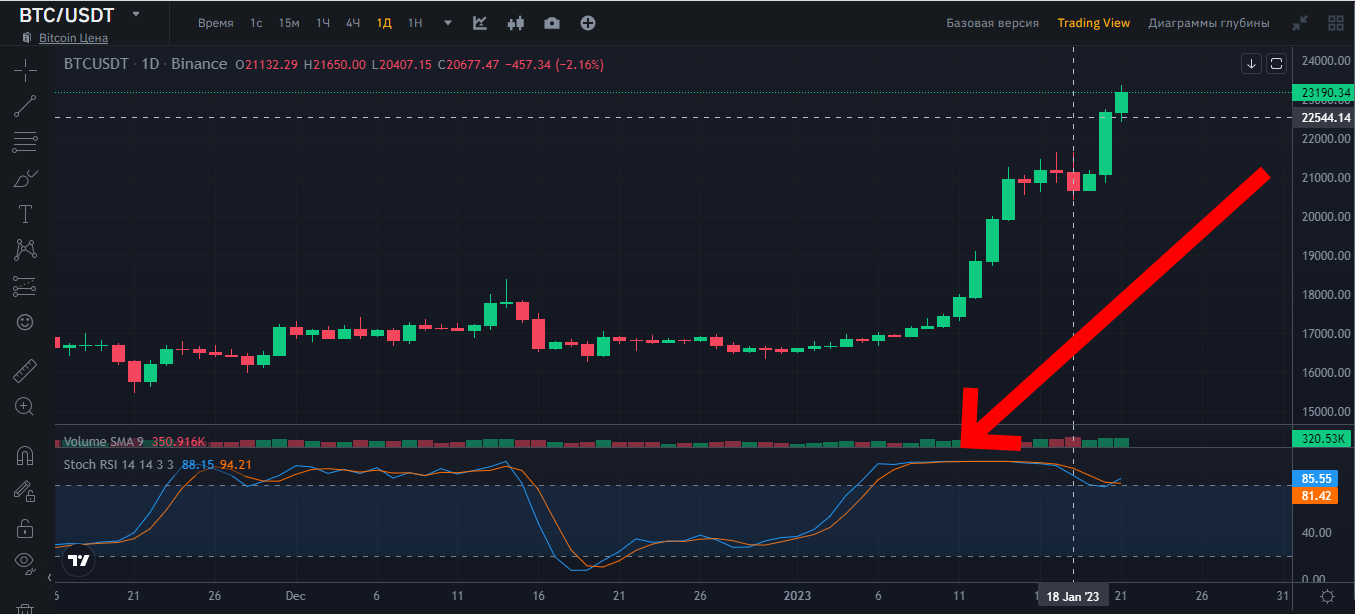
Stochastic RSI also determines overbought and oversold conditions. It is considered a “strengthened” version of the basic RSI, as it works according to more stringent criteria.
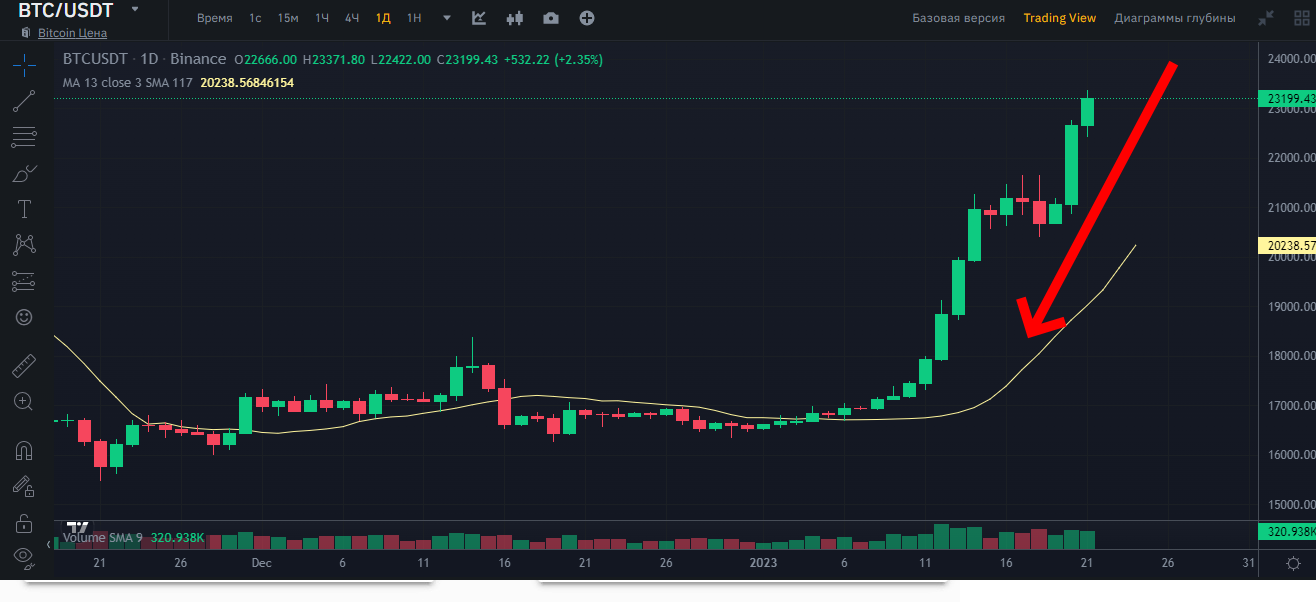
A moving average (MA) is a line that shows the average price of a cryptocurrency over a certain period of time. The interval can be adjusted manually.
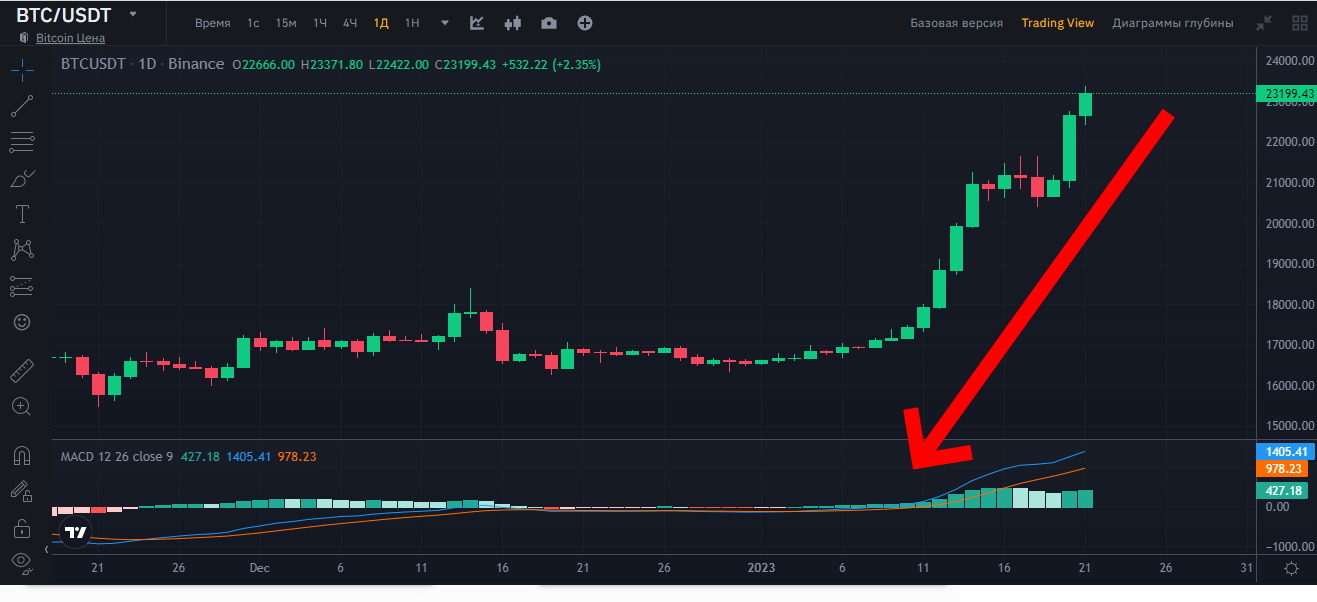
Moving Average Convergence/Divergence (MACD) is an indicator that allows you to determine the strength and direction of a trend, as well as find turning points. It consists of two moving averages, upon the intersection of which you need to open a position.
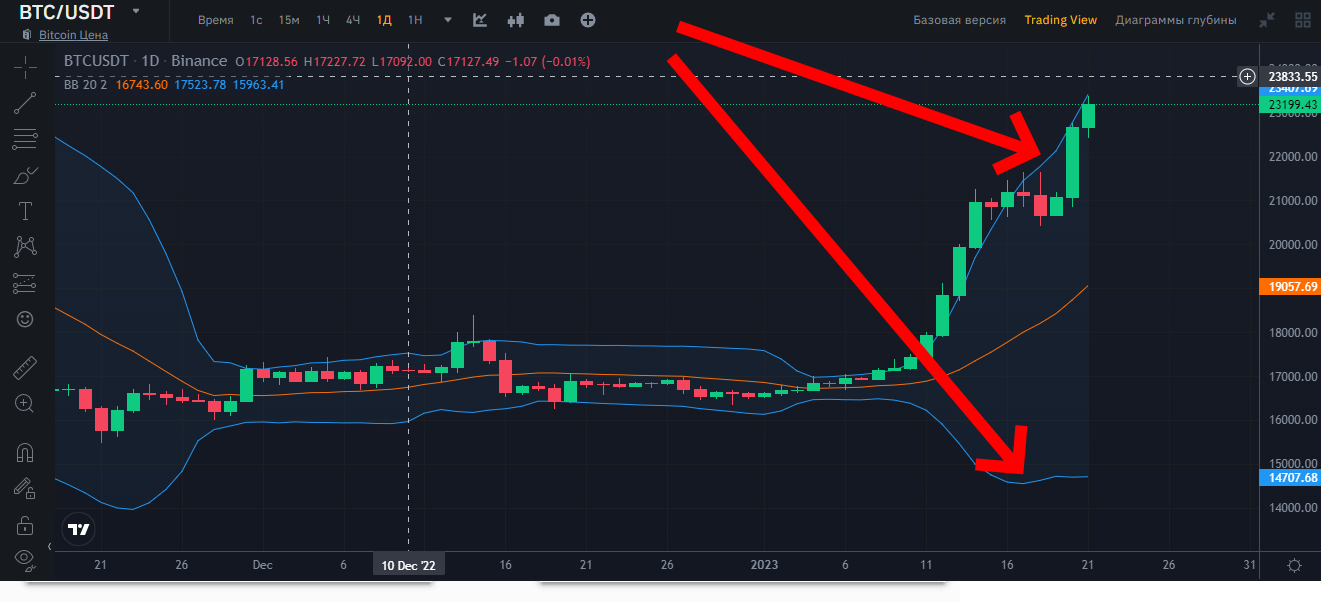
Bollinger Bands are two moving averages, the distance between which reflects the level of volatility of the cryptocurrency. If the price goes beyond the upper or lower line, this indicates that the cryptocurrency is overbought or oversold.
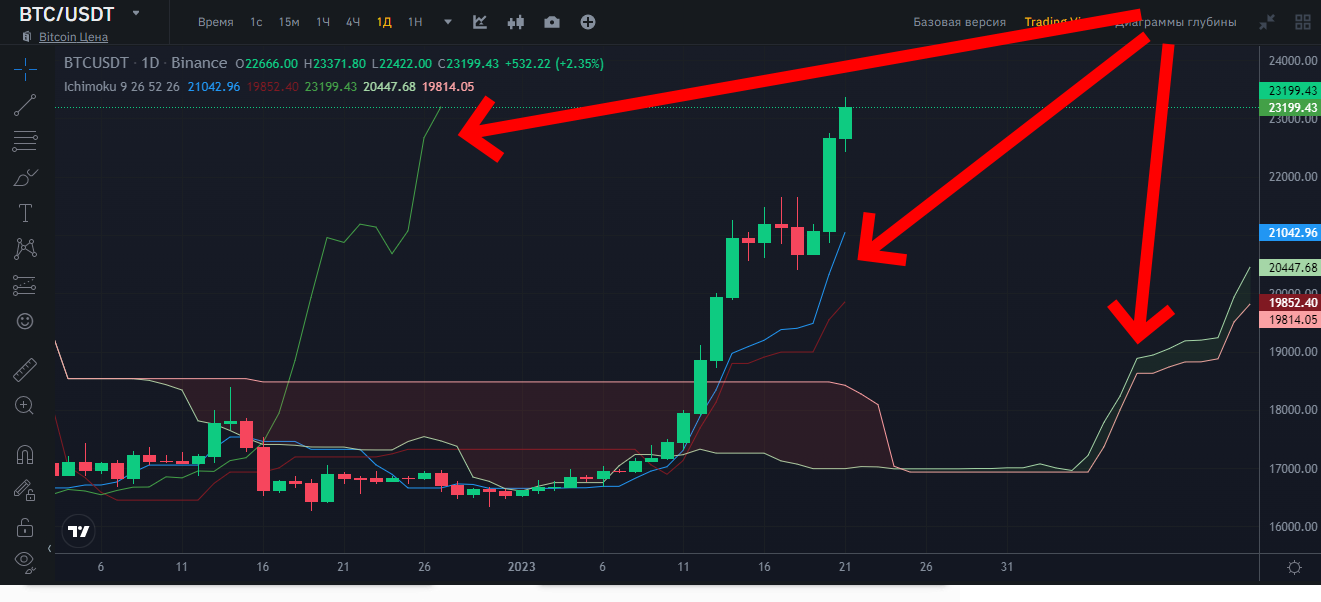
The Ichimoku Cloud takes into account five moving averages to identify support and resistance levels, and also allows you to predict the strength and direction of the trend.
Fibonacci levels are an indicator that shows several support and resistance levels. It is based on the idea that a graph representing crowd behavior corresponds to the proportions of the golden ratio.
Main mistakes in technical analysis of cryptocurrencies
How successfully the theory of technical analysis will be applied primarily depends on the emotional state of the trader himself. Any emotions - both negative and positive - negatively affect trading results, leading in most cases to losses. Traders are advised to remain completely calm.
Patterns and indicators are easy to learn. It is much more difficult to constantly follow the intended strategy. If a trader's psychological state becomes destabilized, he begins to violate his own trading rules. For example:
Lost profit. A trader may close a profitable position too early and thereby reduce his profit from the transaction.
Decrease in profits. The trader may not close the position at the local maximum, waiting for the movement to continue. After the reversal, he will partially or completely lose his profit.
Premature losses. A trader may close a losing position too early. If the price reverses, he will not make his profit.
Excessive losses. A trader may not close a losing position for too long, waiting for a reversal. As a result, he will lose a significant amount.
Excessive self-confidence. After a series of successful trades, a trader may “believe in himself”, begin to analyze the chart less carefully and make mistakes.
Excitement. After a series of losing trades, a trader may begin to take more risks in order to “win back.” As a result, you may incur even more losses.
Information noise. A trader can open trades not according to his own strategy, but on the recommendations of famous personalities, bloggers, news publications, etc. As a rule, this also leads to losses.
You cannot do without losing trades when trading. The trader’s task is to make his profits greater than his losses, and for this he needs to adhere to the intended strategy.
Experienced market participants advise carefully monitoring your psychological state and stopping trading if you become overly emotional. It does not matter whether these emotions are caused by the trading process itself or by external factors. For example, a person may be in an upbeat mood during a vacation or depressed because of problems in the family. During such periods, it is also better to refuse trading.