



The SUI blockchain has gained strength in recent weeks, and its market value is now approaching US$ 7 billion. Driven by memecoin activity and increased engagement in DeFi, the network has seen a surge in DEX volume and technical momentum.
Although indicators such as RSI lines and EMA show early signs of a possible trend change, the overall strength remains mixed. SUI is at a crucial point—supported by short-term enthusiasm, but still needing a stronger confirmation to challenge major blockchains.
SUI ranks behind only the major chains
The recent increase in SUI's DEX activity has drawn attention, largely driven by growing interest in memecoins and speculative trading in its ecosystem. In the last seven days, SUI's DEX volume reached US$ 2.1 billion, marking a 4.49% increase and continuing its upward trend.
This momentum has helped SUI surpass other ecosystems, overtaking Arbitrum in the last 24 hours to become the fifth-largest blockchain by DEX volume.
However, despite short-term gains, SUI is still far behind top-tier networks like Base, BNB Chain, Ethereum, and Solana in total DEX activity.
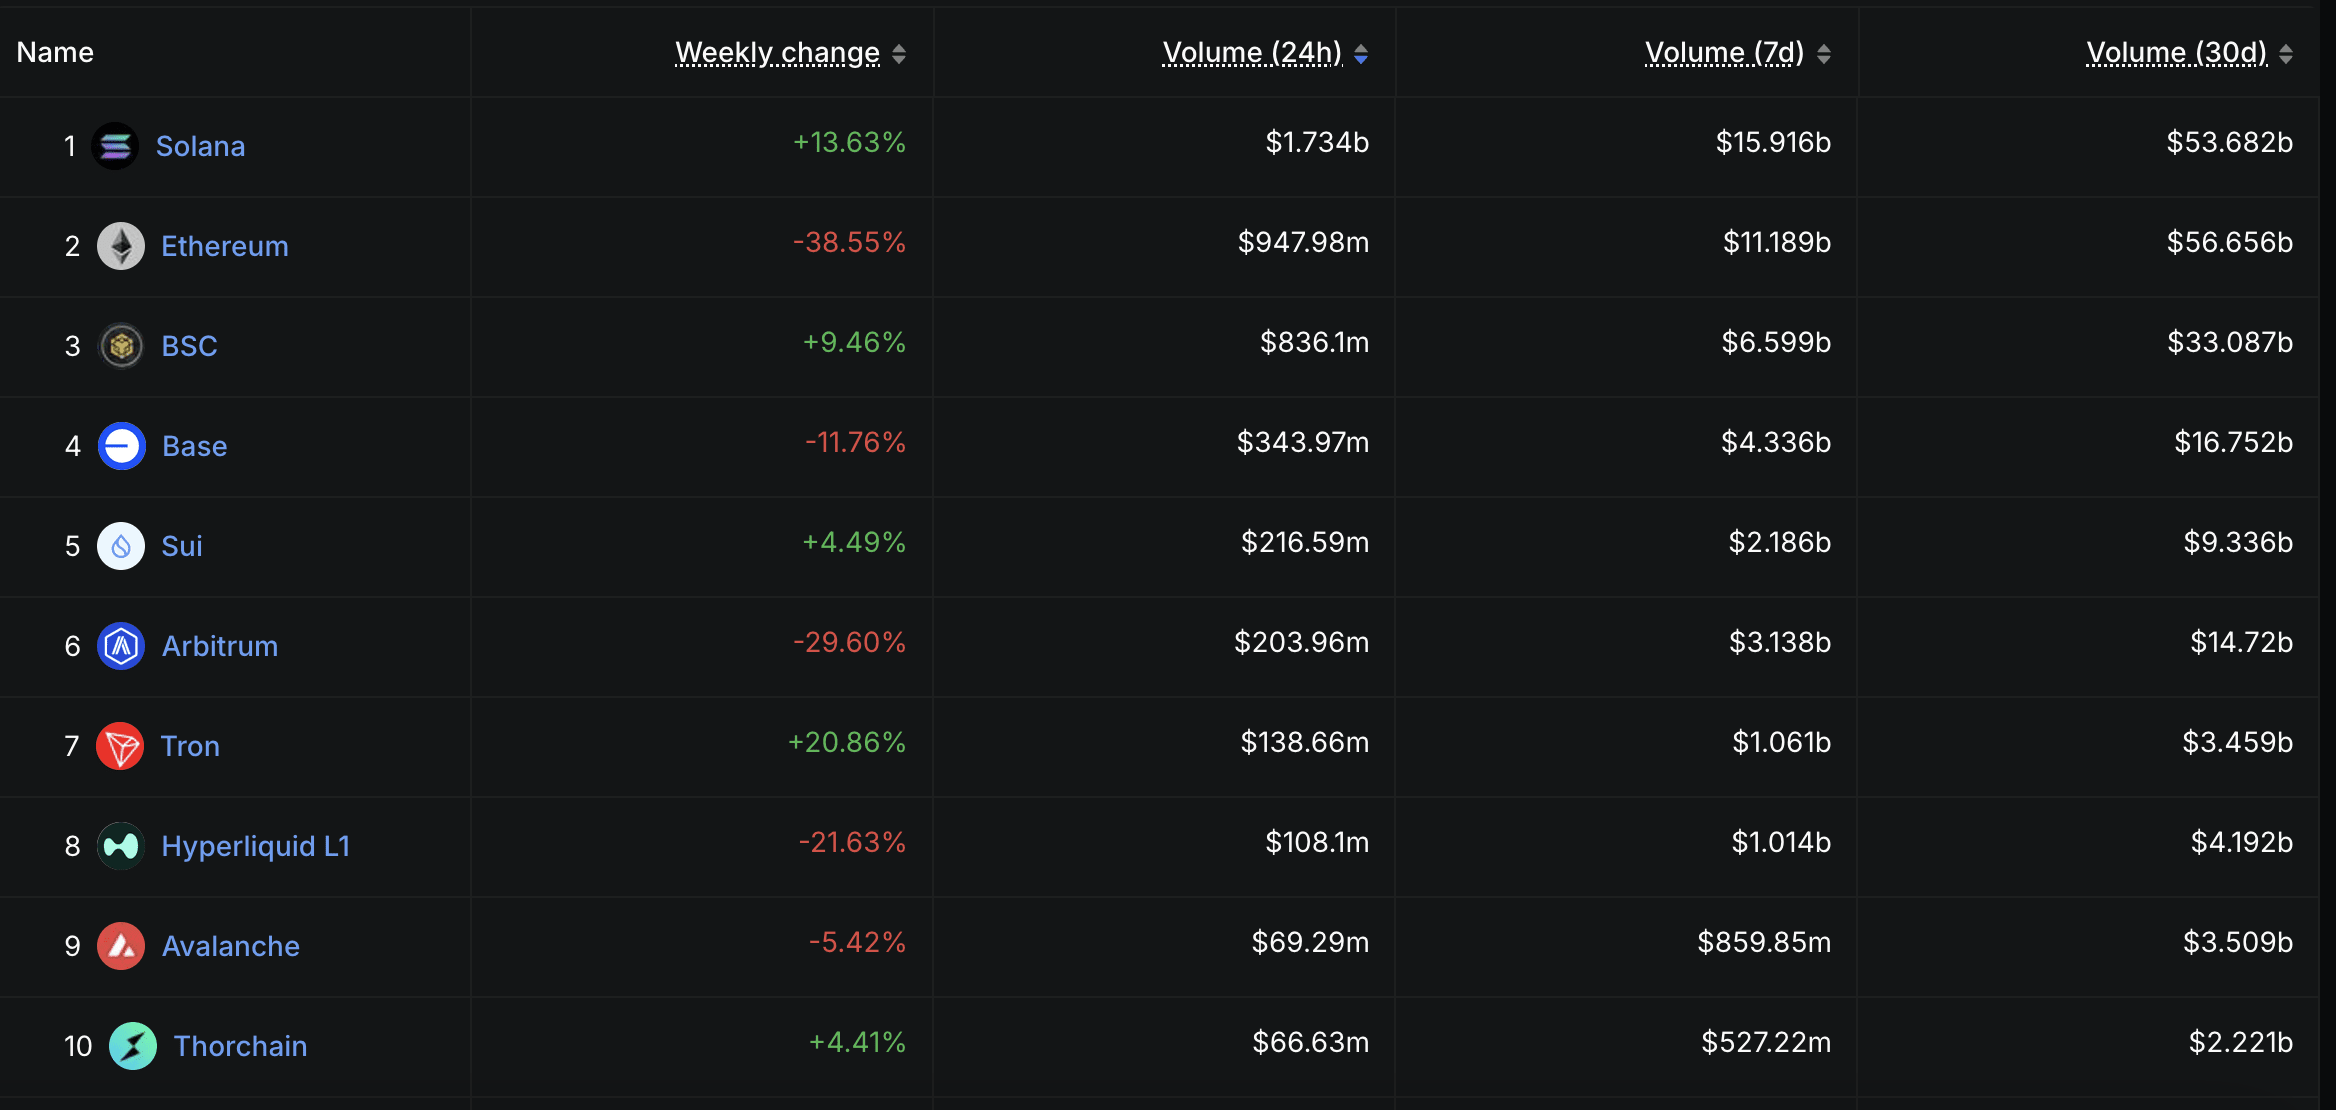 Blockchains ranked by DEX volume in the last 24 hours. Source: DeFiLlama.
These established ecosystems continue to dominate in terms of liquidity, user base, and total transaction volume.
For now, SUI remains an exciting contender with momentum—but not yet a major competitor.
SUI Forecast: trend remains weak
SUI's RSI is now at 51.86, up from 35.22 just three days ago. This suggests that buying pressure has returned after a short-term decline, helping to stabilize the price action.
The Relative Strength Index (RSI) measures momentum on a scale from 0 to 100. Readings above 70 are considered overbought, while those below 30 indicate oversold conditions.
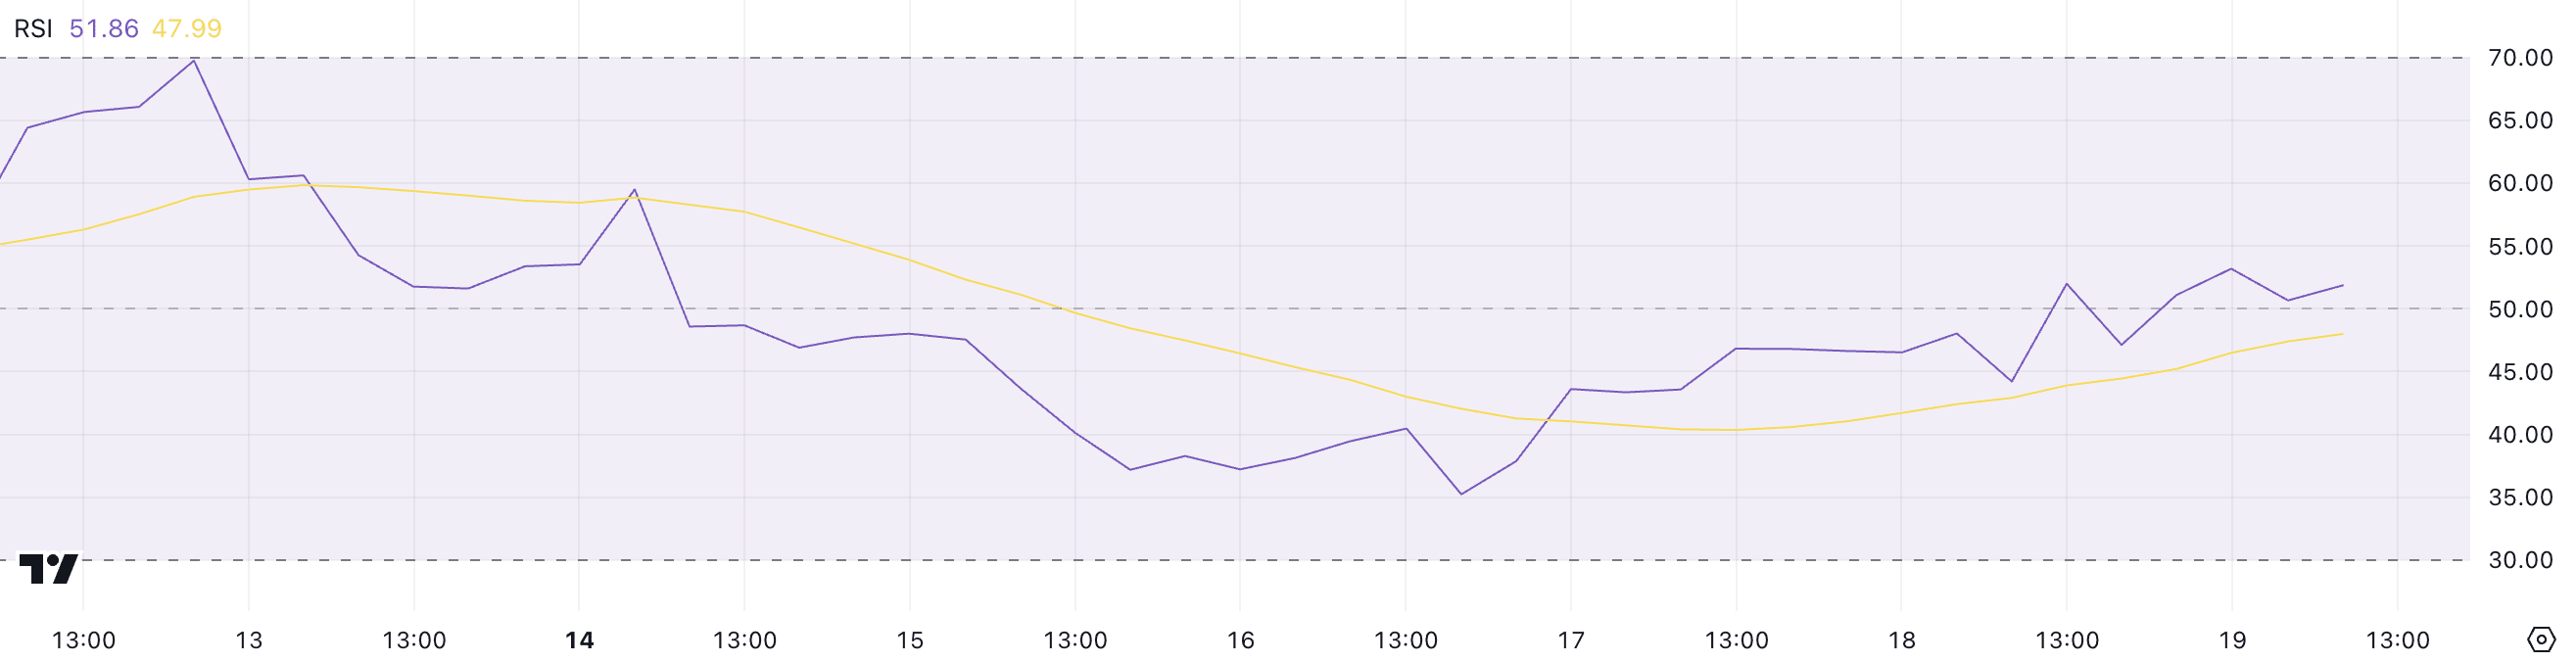 SUI RSI. Source: TradingView.
Situated near the midpoint, SUI's RSI points to neutral momentum. It has not exceeded 70 in almost a month, showing that bullish strength has remained limited.
Meanwhile, SUI's DMI (Directional Movement Index) shows that its ADX has dropped to 9 from 14.79 just two days ago. The ADX measures the strength of the trend, and any value below 20 signals a weak or nonexistent trend.
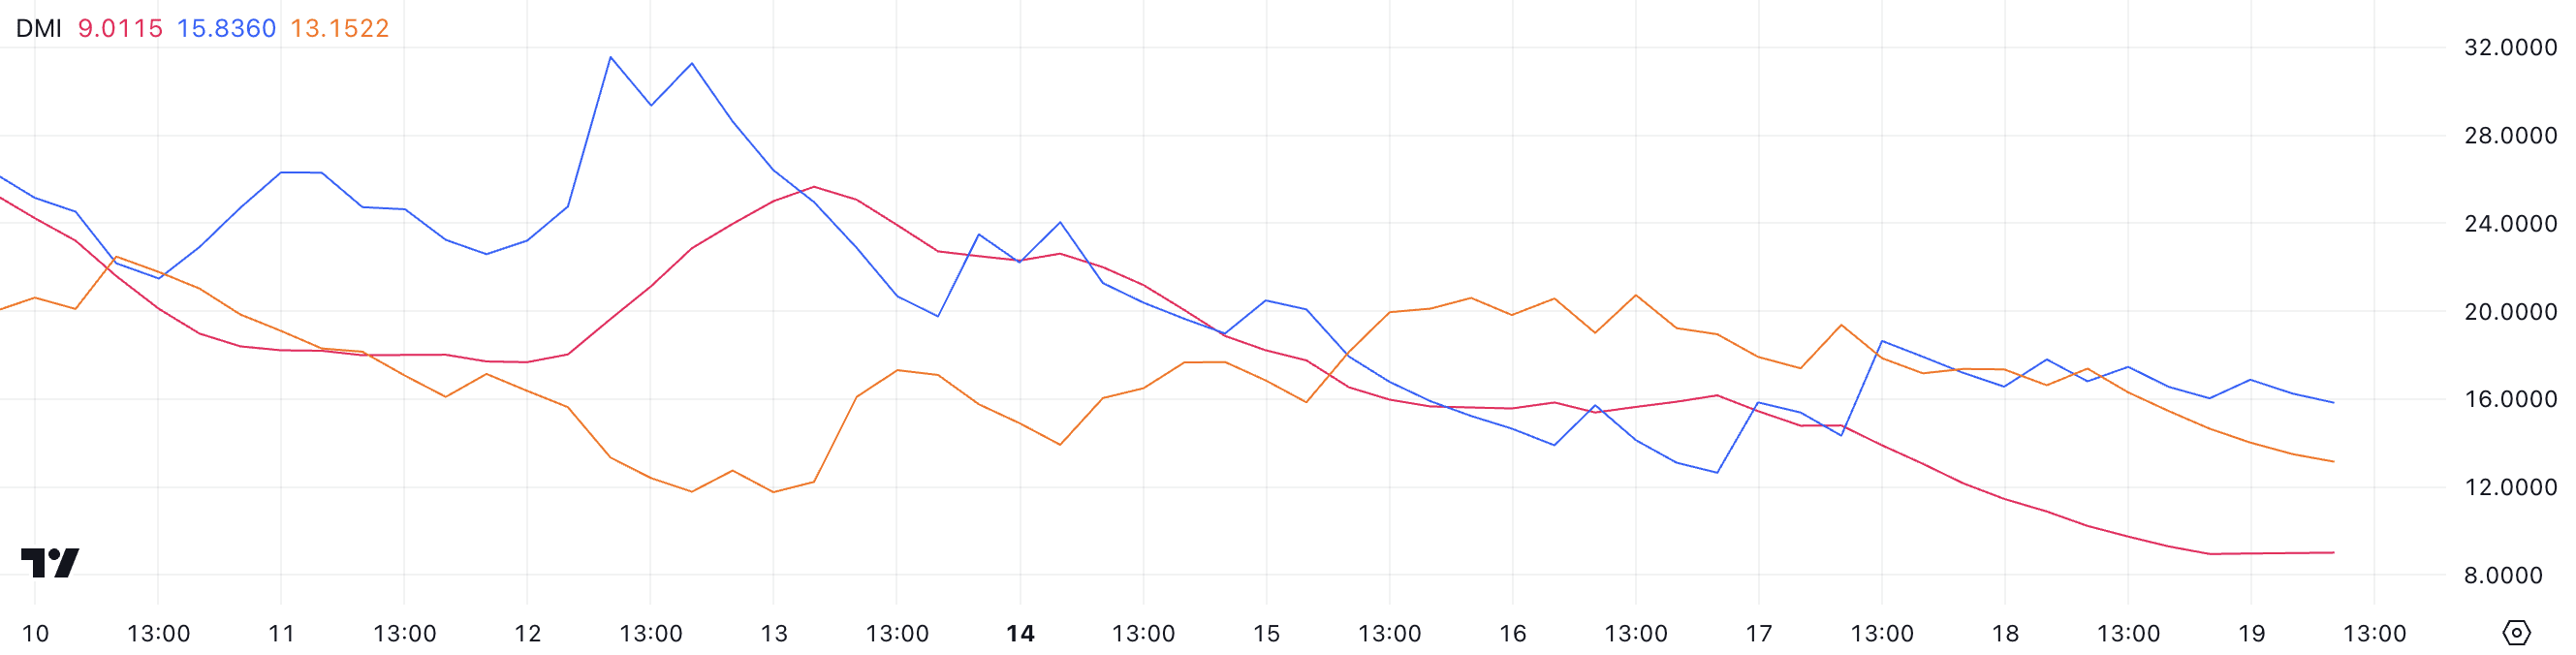 SUI DMI. Source: TradingView
The +DI is at 15.83 while the -DI is at 13.15, indicating that buyers have a slight edge—but the low ADX suggests that this advantage is not strong. There is no clear trend dominating the market right now.
Together, the RSI and DMI suggest that SUI is in a consolidation phase. Buyers are showing some activity, but not enough to build a strong and sustained trend—at least for now.
SUI bulls show signs of life
SUI's EMA lines still show a bearish setup, with short-term averages below long-term ones. However, the gap between them has narrowed, and a potential golden cross may be forming.
A golden cross occurs when a short-term EMA crosses above a long-term EMA, often seen as a bullish sign. If this happens, the network may gain momentum and advance toward the resistance level of US$ 2.28.
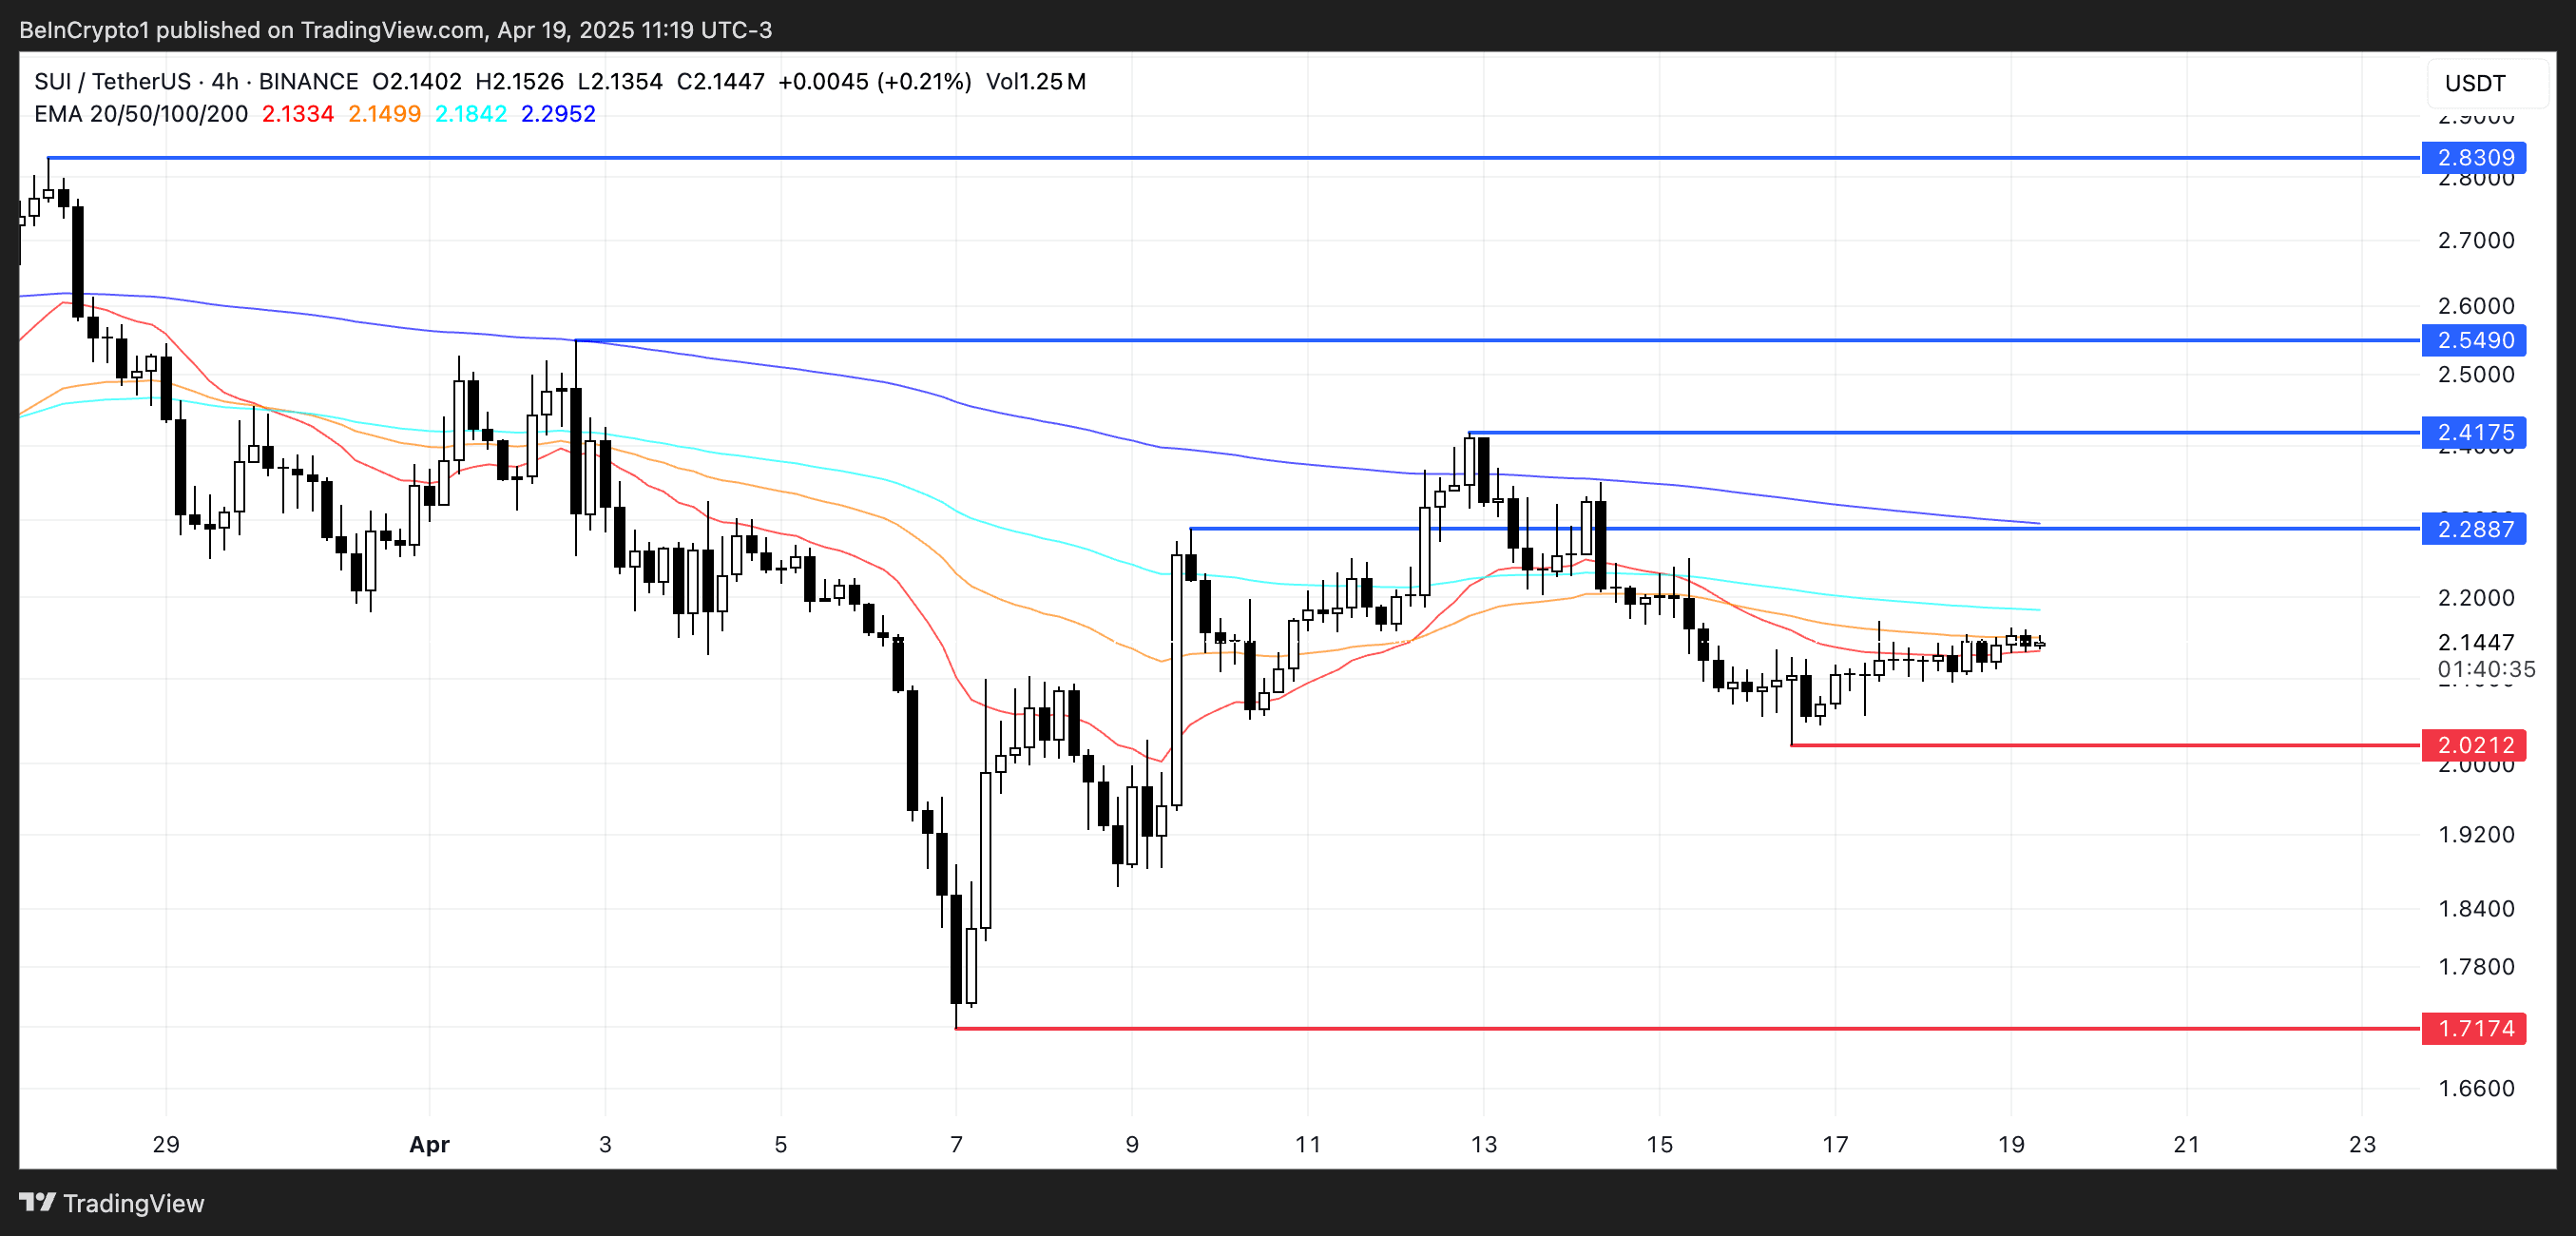 SUI Price Analysis. Source: TradingView
Overcoming this level could pave the way for US$ 2.41 and US$ 2.54. If bullish momentum increases further, the SUI blockchain may even test the level of US$ 2.83—its highest since early March.
But if the market fails to maintain current levels and selling pressure returns, a correction may begin. In that case, it could drop again to test the support of US$ 2.02.
Losing this support may bring a sharper decline, potentially pushing SUI toward US$ 1.71. For now, the price action is at a critical point, with breakout and breakdown scenarios in play.
The article 'Is She Back? SUI ranks in the top 5 in traded volume' was first seen on BeInCrypto Brazil.