Waiting for a long time 😆💥💥
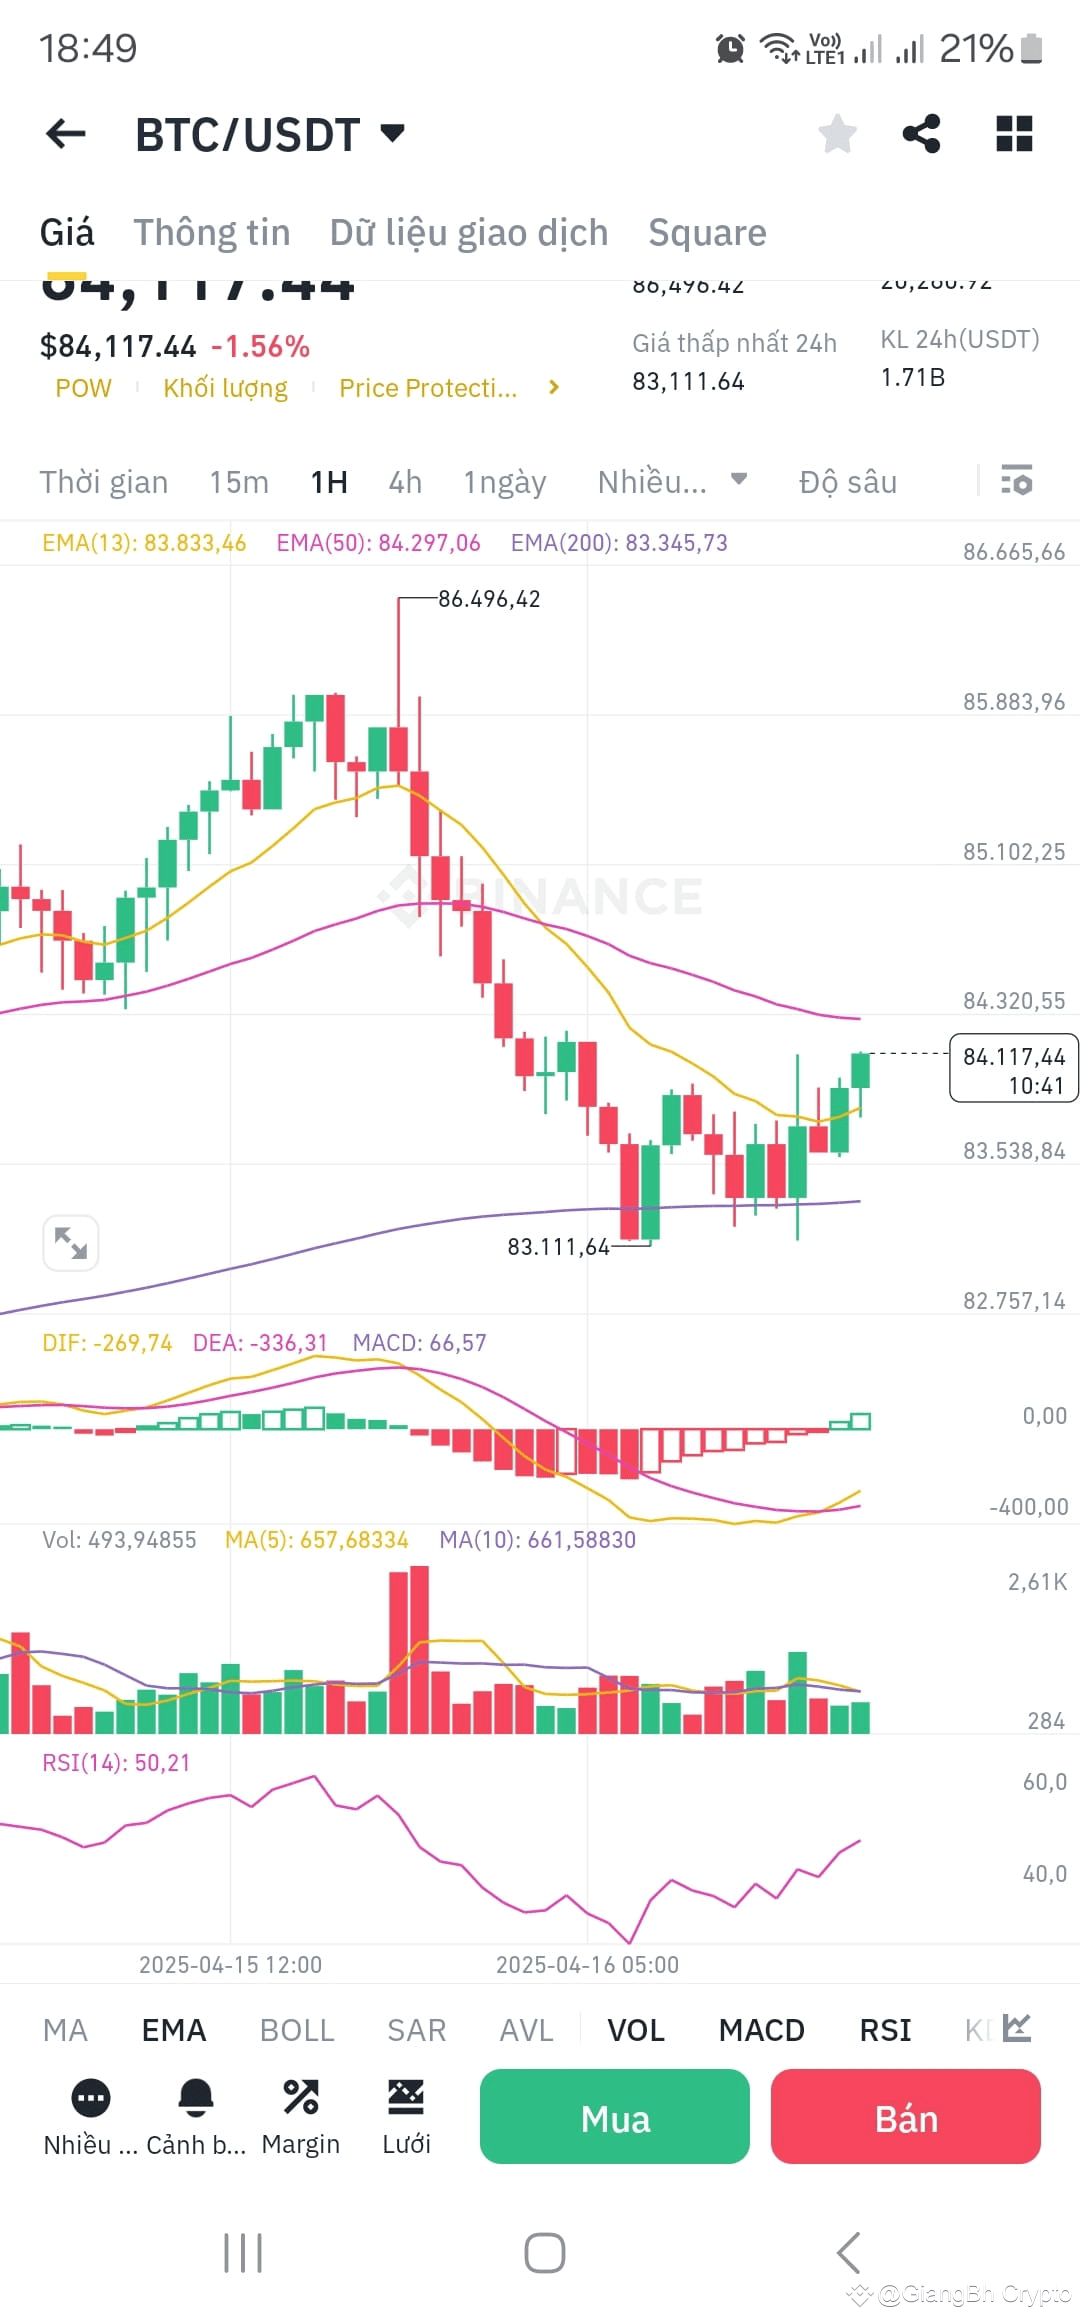
The BTC/USDT chart on the 1H timeframe shows a short-term retracement and then:
The price has closed above EMA13 (83,833) and touched EMA50 (84,297) → short-term EMA breakout signal.
The histogram has clearly turned green → confirming the uptrend.
RSI: For the first time exceeding the 50 mark (currently 50.21)
→ buying power is returning to the market.
Volume is stable, no money is being withdrawn, positive signal.
Near resistance: EMA50 (84,297)
If it clearly breaks EMA50, the next targets could be:
85,000 – 85,300
Even 85,800 – 86,000.
#CanadaSOLETFLaunch
💥 Note: I only write personal opinions for you to follow and gain more information and perspective for reference. Not investment advice, and I don't have any groups or links for you!!!
The market this season is sensitive, all opinions are short-term!
The BTC/USDT chart on the 1H timeframe shows a short-term retracement and then:
The price has closed above EMA13 (83,833) and touched EMA50 (84,297) → short-term EMA breakout signal.
The histogram has clearly turned green → confirming the uptrend.
RSI: For the first time exceeding the 50 mark (currently 50.21)
→ buying power is returning to the market.
Volume is stable, no money is being withdrawn, positive signal.
Near resistance: EMA50 (84,297)
If it clearly breaks EMA50, the next targets could be:
85,000 – 85,300
Even 85,800 – 86,000.
#CanadaSOLETFLaunch
💥 Note: I only write personal opinions for you to follow and gain more information and perspective for reference. Not investment advice, and I don't have any groups or links for you!!!
The market this season is sensitive, all opinions are short-term!