$BTC
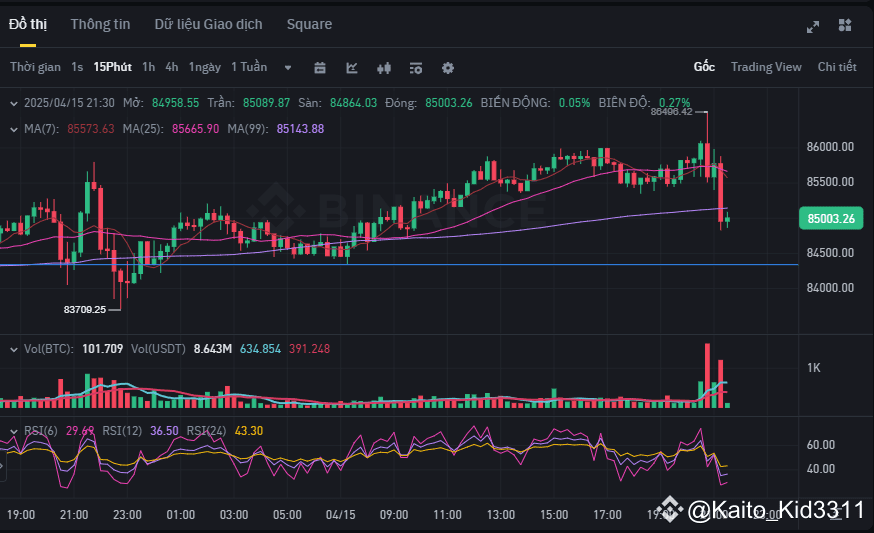
Based on the Bitcoin (BTC) trading chart with USDT on Binance that you uploaded, we can analyze some important factors to predict the price in the next hour:
Technical Analysis
Current Price: 85,003.26 USDT
Recent High: 84,958.55 USDT
Recent Low: 83,708.25 USDT
RSI Index (6): 29.91 (oversold)
RSI Index (12): 36.50 (neutral)
RSI Index (24): 43.30 (neutral)
Trading Volume: 101.709 BTC
Trend Prediction
Short-term Trend: The price is fluctuating around the moving averages MA(7) and MA(25), indicating stability but may have slight volatility.
Upside Potential: If the price breaks through the nearest resistance level (84,958.55 USDT), it may continue to rise towards the 85,500 USDT range.
Downside Risk: If the price drops below the support level (83,708.25 USDT), it may adjust to the 83,500 USDT range.
Recommendation
If you are trading short-term, monitor the resistance and support levels to make informed buying/selling decisions.
The RSI index indicates that the market may be in the oversold region, with potential for a slight recovery.
Would you like me to analyze a specific indicator in more detail? 🚀
Based on the Bitcoin (BTC) trading chart with USDT on Binance that you uploaded, we can analyze some important factors to predict the price in the next hour:
Technical Analysis
Current Price: 85,003.26 USDT
Recent High: 84,958.55 USDT
Recent Low: 83,708.25 USDT
RSI Index (6): 29.91 (oversold)
RSI Index (12): 36.50 (neutral)
RSI Index (24): 43.30 (neutral)
Trading Volume: 101.709 BTC
Trend Prediction
Short-term Trend: The price is fluctuating around the moving averages MA(7) and MA(25), indicating stability but may have slight volatility.
Upside Potential: If the price breaks through the nearest resistance level (84,958.55 USDT), it may continue to rise towards the 85,500 USDT range.
Downside Risk: If the price drops below the support level (83,708.25 USDT), it may adjust to the 83,500 USDT range.
Recommendation
If you are trading short-term, monitor the resistance and support levels to make informed buying/selling decisions.
The RSI index indicates that the market may be in the oversold region, with potential for a slight recovery.
Would you like me to analyze a specific indicator in more detail? 🚀