

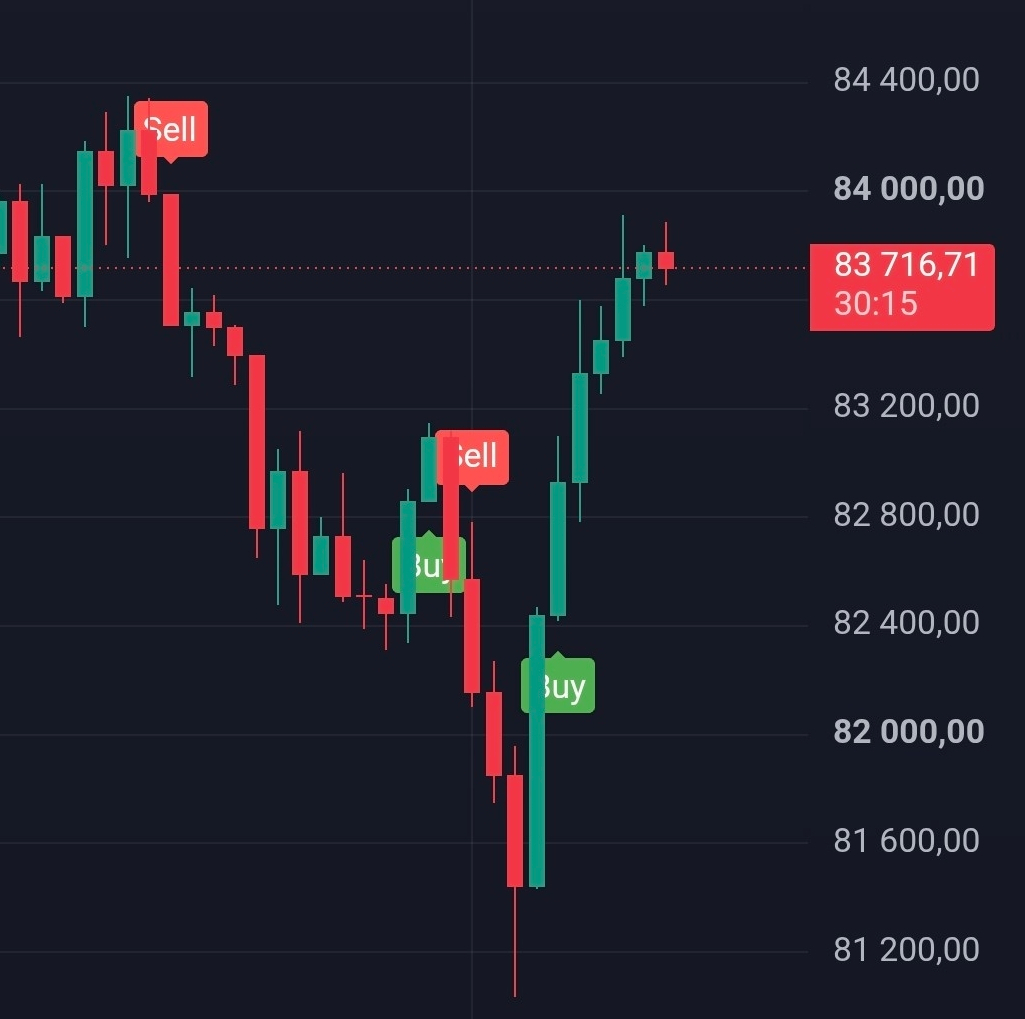
$XRP
Here is the current technical and engineering analysis for XRP (Ripple) as of April 13, 2025:
🔍 Technical Analysis
Overall Trend: Bullish with some sideways corrections.
Support and Resistance:
First Support: $1.85
Second Support: $1.55
Current Resistance: $2.00
Next Resistance: $2.44 then $3.00
Technical Indicators:
Relative Strength Index (RSI): 58.946 – indicates a buying condition
MACD: 0.022 – Buy signal
Williams %R: -28.662 – Buy signal
CCI (14): 58.1609 – Buy signal
ADX (14): 31.007 – indicates a strong trend
📐 Engineering Analysis (Technical Patterns)
Head and Shoulders Pattern: A head and shoulders pattern has formed, indicating further decline in April. Any rise above $3.00 would invalidate the bearish outlook.
Descending Triangle Pattern: A descending triangle is forming on the daily chart for XRP, with strong support at $2.00. This level has prevented previous declines, suggesting a potential bullish rebound if maintained.
📊 Future Predictions
Bullish Scenario: If $XRP continues to hold the current support level and breaks resistance at $2.44, it could target levels of $3.00 and above.
Bearish Scenario: If the support at $1.85 is broken, XRP could drop to levels of $1.55 or lower, indicating a need for caution.
#VoteToListOnBinance #BinanceSafetyInsights