



Many retail investors use predictive tools to devise their investment strategies in the current unstable global financial landscape. One tool that has recently gained wide attention is the Benner Cycle.
This economic forecasting chart has over 150 years of history. Many believe it accurately predicted major financial crises since the mid-1920s. However, recent economic developments are putting this belief to the test.
Benner Cycle attracts attention again with economic forecasts
Samuel Benner suffered significant losses during the 1873 crisis. Afterward, he began studying economic patterns and published a book documenting the highs and lows of asset prices. In 1875, he wrote Business Prophecies of the Future Ups and Downs in Prices, introducing the Benner Cycle.
This cycle is not based on complex mathematical models of quantitative finance. Instead, Benner grounded it in agricultural price cycles, which he observed through his own experience.
At the end of his findings, Benner – then a farmer – left a note: "Absolute certainty." Almost two centuries later, this note is resurfacing and gaining interest again.
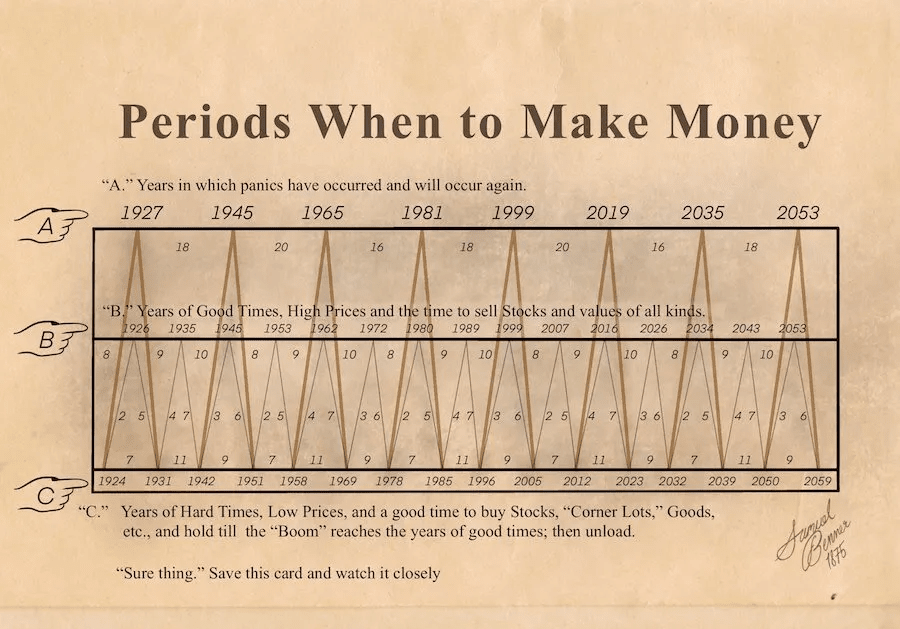 Benner Cycle. Source: Business Prophecies of the Future Ups and Downs in Prices
Benner Cycle returns to the spotlight with optimistic forecasts for the market
With his perspective, Benner believed that solar cycles significantly impacted crop productivity, which in turn influenced agricultural prices. From this idea, he created a market prophecy.
In the Benner chart:
Line A marks years of panic.
Line B indicates boom years, which are good for selling stocks and assets.
Line C highlights recession years, which are ideal for accumulation and buying.
Benner mapped his forecast until 2059, although modern agriculture has changed drastically in the nearly 200 years since then.
According to Wealth Management Canada, although the cycle does not predict exact years, it has closely aligned with major financial events – such as the Great Depression of 1929 – with only small variations of a few years.
However, investor Panos highlighted that the Benner Cycle successfully predicted several major events: the Great Depression, World War II, the Internet bubble, and the COVID-19 crash. The chart also suggests that 2023 was an ideal year to buy, and 2026 will mark the next big market peak.
2023 was the best time to buy in recent times and 2026 would be the best time to sell, Panos emphasized.
Retail investors in the crypto market widely share this chart, using it to support optimistic scenarios for 2025–2026.
The Benner Cycle suggests a market peak around 2025, followed by a correction or recession in the subsequent years. If this is confirmed, the speculative hype in Crypto AI and emerging technology may intensify in 2024–2025 before a downturn, predicted investor mikewho.eth.
Belief in the Benner Cycle faces increasing challenges
Despite the growing popularity, belief in the Benner Cycle is under pressure due to recent economic developments.
On April 2, President Donald Trump announced a new controversial tariff plan. Global markets reacted negatively, opening the week with a sharp decline.
Market movements on April 7 were so severe that some dubbed it "Black Monday" in reference to the infamous stock crash of 1987. On April 7, the total market value of crypto fell from $2.64 trillion to $2.32 trillion. Although a recovery has begun, investor sentiment remains deeply fearful.
Moreover, JPMorgan recently raised its probability of a global recession in 2025 to 60%. This change was triggered by the economic shock caused by the newly announced "Tariff" by Donald Trump. Goldman Sachs also raised its recession forecast to 45% in the next 12 months – the highest level since the post-pandemic era of inflation and rate hikes.
Veteran trader Peter Brandt criticized the Benner chart in a post on X (formerly Twitter) yesterday (7).
I don’t know how much I would trust this. In fact, I need to deal only with the trades I enter and exit. This kind of chart is more of a distraction than anything else for me. I can't trade long or short on this specific chart, so it's all fantasy to me, Peter commented.
Still, despite concerns about a recession and market behavior contradicting the optimistic outlook of the Benner Cycle, some investors believe in Samuel Benner's prophecy.
Market peak in 2026. This gives us one more year if history decides to repeat itself. Sounds crazy? Of course. But remember: markets are more than just numbers; they are about mood, memory, and momentum. And sometimes these old charts work – not because they are magical, but because many people believe in them, said investor Crynet.
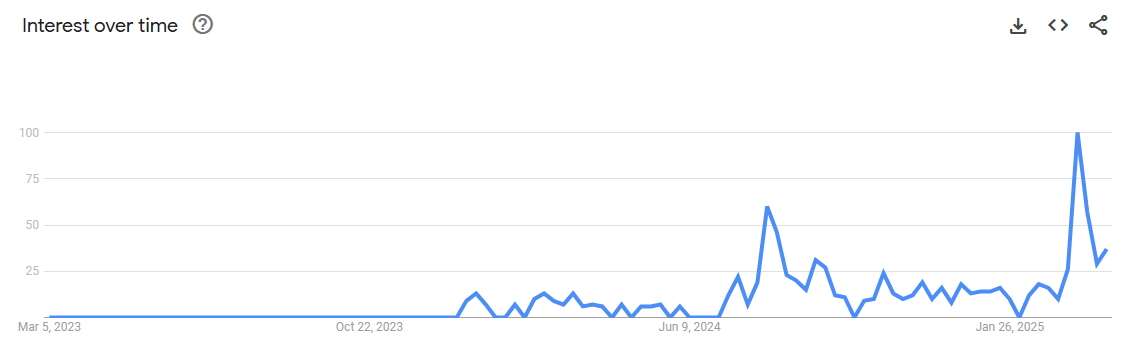 Search Trends for the Keyword "Benner Cycle". Source: Google Trend
Moreover, according to Google Trends, search interest in the Benner Cycle peaked last month. This reflects a growing demand among retail investors for optimistic narratives, especially amid fears of heightened economic and political instability.
The article Benner Cycle: Can the chart predict the next peak of the crypto market? was first seen on BeInCrypto Brazil.