

The most famous Japanese candlestick patterns and their explanation on the chart
Japanese candlesticks are representative bars on charts that represent price movements over specific periods, from the opening price, high, low, and closing price. They were used by traders in the Middle Ages to determine and track prices for rice and other food commodities.
Japanese candlesticks should provide different visual cues that make understanding price action easier. Trading with candlestick patterns on timeframe charts allows for a better understanding of market sentiment. Candlestick charts offer greater depth of information than traditional bar charts.
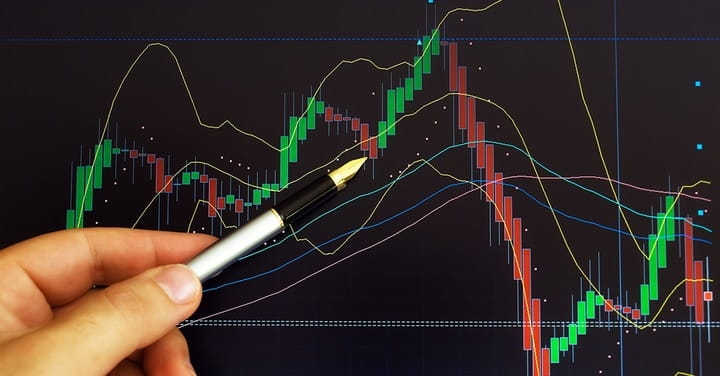
In this article, we will explain the types of Japanese candlesticks, understand their components, the most popular Japanese candlestick patterns, and strategies for trading various Japanese candlestick patterns and predicting their future trends.
Note: We will use some terms in this article based on their internationally recognized English names, to facilitate understanding and avoid conflicting terms.
Japanese Candlestick Patterns - The Most Important Titles:
Explaining the components of Japanese candlesticks in detail
How to measure the length of Japanese candles
3 Main Components of Japanese Candlestick Charts
12 of the most famous Japanese candlestick patterns on the chart
Types of Japanese candlesticks that you should know
What are Marbuzu High Momentum Candles?
What is a Doji candle?
Master Candle Concept
How to Validate Japanese Candlestick Patterns
Japanese Candlestick Pattern Trading Strategies
Summary of a detailed explanation of the most important types and models of Japanese candlesticks
Explaining the components of Japanese candlesticks in detail
Japanese candlesticks focus on the relationship between the opening and closing prices. A candlestick chart provides traders with a detailed description of the price chart, with an almost three-dimensional representation. Unlike Japanese candlesticks, bar charts focus more on highs and lows than anything else.
The most important advantage of candlestick charts is that they enable you to see more distinct and distinct patterns compared to other chart types. Traders using different candlestick patterns should also identify the different types of accompanying price action, which tend to predict reversals or trend continuations. Furthermore, when combined with other technical analysis tools, they should provide a more accurate assessment of potential price movements.
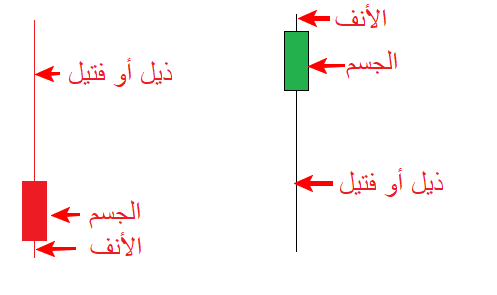
As we can see from the image above, candles that close at a higher price than their opening price will form white (bullish) candles. Conversely, candles that close at a lower price than their opening price will form black (bearish) candles. The boxes formed by the price action are called the "body." The extremes of the daily price movement, represented by lines extending from the body, are called the "tail" (wick or shadow). The small part of the candle that trails behind is called the "nose."
To sum it up better - Japanese candlesticks contain the following components:
Body: The thickest part of the candle that indicates the discrepancy between the opening and closing prices.
Wick or tail: It can be called (candle shadow). The names vary, but they all refer to the upper and lower lines of the candle body, which represent the entire price path within a specific time frame, indicating the maximum and minimum of the candle body on the price chart.
Color: This will allow us to determine whether the candle is bullish or bearish, i.e., whether the price is rising or falling. These colors can be customized according to the trader's own preferences.
With the ability to be used in different time frames (H1, D1, etc.), the Japanese candlestick trading chart provides us with four basic data in that chosen time period:
Opening price
After the previous candle closes, a new one begins to form, with the starting point being the previous candle's closing level. There may be exceptions if there is a gap in the market.
Closing price
It's the highest point of the candle's body if it's bullish. If it's bearish, it's the lowest point of the body. Under normal circumstances, this level is where the next candle begins.
Highest price
It is the highest level reached by the price during the given time period. The price fluctuates and reaches its maximum at the end of the wick. It is less noticeable when the closing price is at the upper end of the candle.
Lowest price
This is the lowest price reached during the time period in question. The price fluctuates and reaches its minimum at the end of the wick. It is less noticeable when the closing price is at the lower end of the candle.
How to measure the length of Japanese candles
A candle is measured from its high to its low in pips. The highest level represents the resistance point, while the lowest level represents the support point. The larger the candle, the greater the support and resistance levels, especially when trading with a master candle.
Note: The topic of master candles will be covered later in the article.
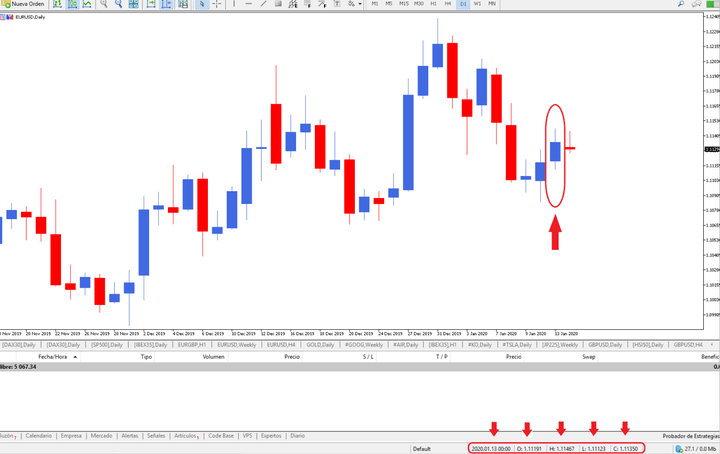
Source: Demo Account - MetaTrader Supreme Edition - EUR/USD - Daily Chart - Data range: November 8, 2018 to January 14, 2020. Accessed January 14, 2020. Please note that past performance is not a reliable indicator of future results.
The window on your left—the Data Window—will show you the basic candlestick data you need to know, including the high and low prices, as well as the open and close prices. This is the main data provided in the MetaTrader 4 and MetaTrader 5 platforms.
If you place your mouse cursor on the Japanese candle you want to measure, all the necessary information will appear in the bottom right of the trading platform:
Date of the candle in question
O: Candle opening price
H: Maximum price reached
L: Minimum price reached
C: Candle closing price
Simply measure the candle in pips by taking the highest price and the lowest price.
In the previous example:
H = 111167
L = 1.11123
H - L = 1.11467 - 1.11123 = 0.00344
So, candle size = 34.4 pt
3 Main Components of Japanese Candlestick Charts
1. Size/length of the entire candle
2. Correlation between the opening and closing levels
3. Shadows and their relationship with the candle body
Let us now explain these three points in more detail:
Size/length of the entire candle
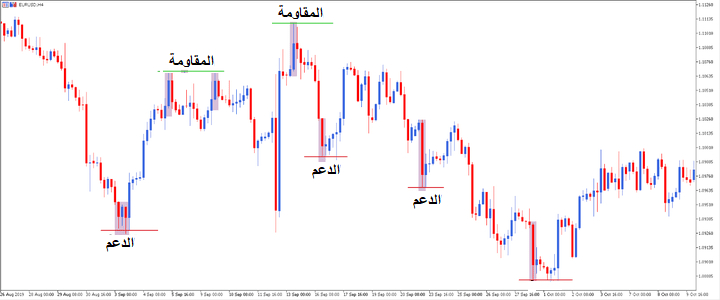
Candles that open at a low and close at a high, or very long candles, are also common. If there has been a long downtrend, such a candle signals a major trend reversal. Conversely, after a long uptrend, if an unusually long candle closes, showing a long "wick" to the upside, or a strong bearish candle directly from the top, we are talking about exhaustion or a "blow-out-of-the-top" situation. In the example below, reversal candles are highlighted in blue:
Correlation between the opening and closing levels of the candle
Since the colored body of a candlestick represents either a positive or negative reading during an uptrend, or in bullish market conditions, buying typically occurs at the open. The price should rise, and a hollow white candle (white as in the example above) should form. Bulls, or "bullish traders," control the market price action. The length or distance between the open and close reflects their dominance of the market movement.
In bearish market conditions, or during strong downtrends, dark-bodied black candles form (as in the example). This represents sellers entering the market at the open and dominating the market for that specific time. Compared to bar charts, Japanese candlestick charts allow for excellent analysis based on the shape and color of the candle body.
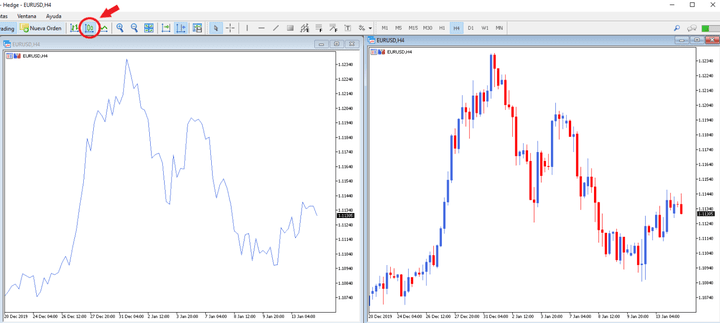
Source: EUR/USD, 4-hour chart - MT5 Admirals. Created on January 14, 2020. Please note that past performance is not a reliable indicator of future results.
Shadows and their relationship with the candle body
The length of the wick represents the candle's price highs and/or lows, compared to the opening and closing prices shown in the actual body of the candle. This can also indicate the market's denial of a support or resistance level. If we see long tails, shadows, or wicks, an important factor to consider is whether they form after a long downtrend, as this indicates the trend may be exhausting itself, with demand increasing or supply decreasing.
If we see tails, shadows, or wicks forming at the tops of Japanese candlestick bodies, especially after a long price rise, this indicates that demand is declining and supply is increasing. The larger the shadow, the more important it is to analyze it relative to the candle body, as this may indicate the strength of the reversal. The strongest of these candles are pin bars, as in the figure below:
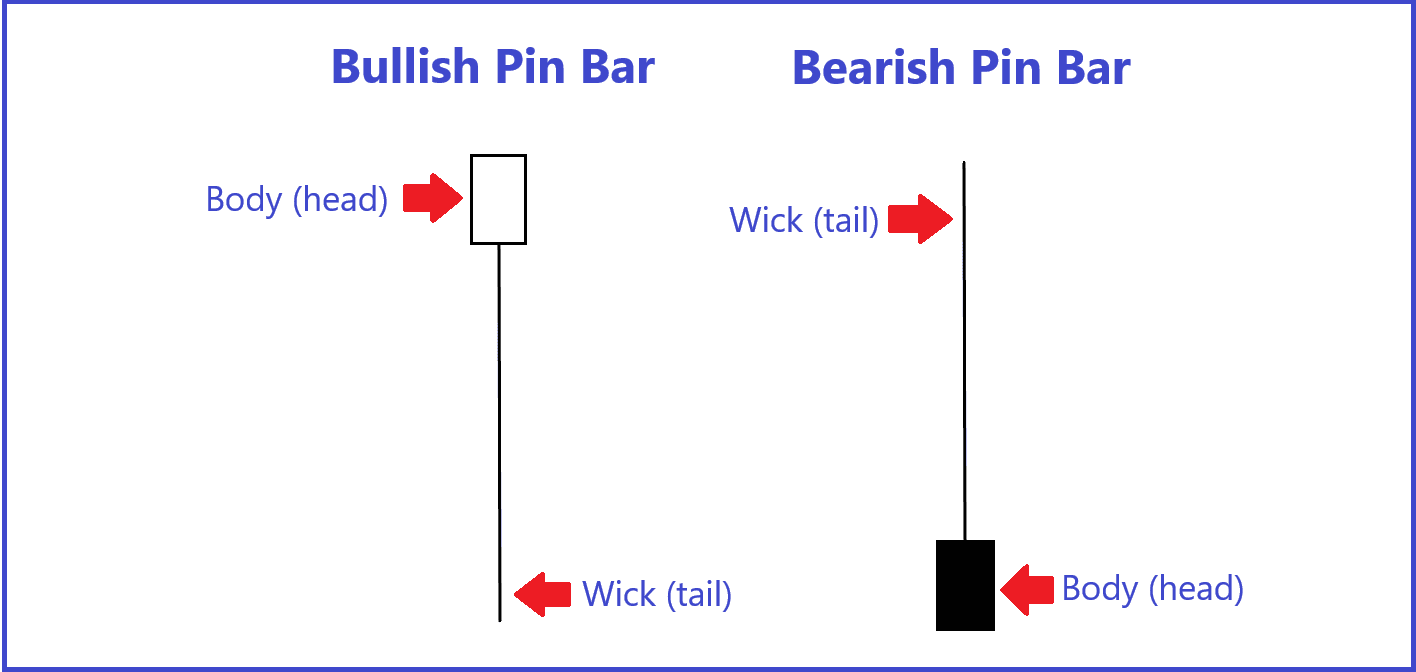
In the image above, the tail of a bullish pin bar is extending upwards and rejecting support. We refer to this type of Japanese candlestick as a "bullish pin bar." After a bullish pin bar forms, we typically see a surge in "buyers in the moment," and therefore, the price will rise. Conversely, when the tail of a bearish pin bar extends upwards and rejects resistance, we will see a surge in "sellers in the moment," and the price will usually fall. The strongest reversal candles are those with wicks much longer than their bodies and a very small nose, or sometimes no nose at all.
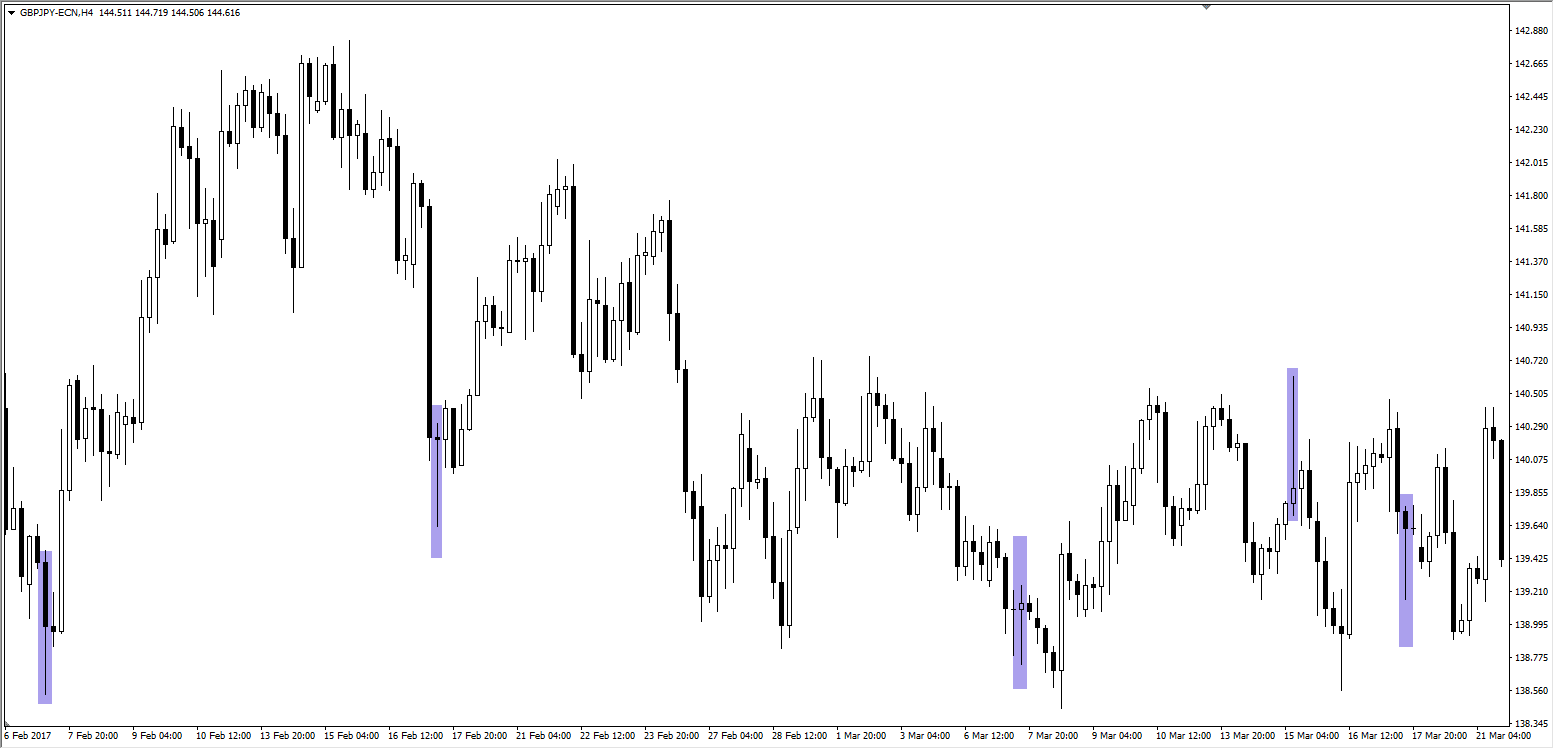
Source: GBP/JPY H4 Chart - Disclaimer: Charts for financial instruments in this article are for illustrative purposes and does not constitute trading advice or a solicitation to buy or sell any financial instrument provided by Admirals (CFDs, ETFs, Shares). Past performance is not necessarily an indication of future performance.
12 of the most famous Japanese candlestick patterns on the chart
Japanese candlestick patterns appear frequently in the forex, stock CFD, and index markets. Let's get to know them and how to identify them on the charts of various trading platforms—the nine most popular patterns:
1. Hammer candlestick
2. Inverted Hammer candlestick
3. Harami Candlestick
4. Shooting Star candlestick
5. Hanging Man candlestick
6. Piercing Line candlestick
7. Bullish/Bearish Engulfing candlestick
8. Dark Cloud candlestick
9. Three Black Crows candlestick
10. The 3 soldiers candlesticks
11. Morning Star candlestick
12. Evening Star Candlestick
Of course, there are many other Japanese candlestick patterns that you will encounter during trading, whether on the upside or the downside, but we will discuss them in other articles specifically about them.
Let us now explain to you, dear reader, the patterns and types of Japanese candlesticks, with pictures and in more detail. But before we begin, why not open a demo account so you can open live charts and try to identify the candlestick formations you'll learn about in the next section?
1. Hammer Candlestick
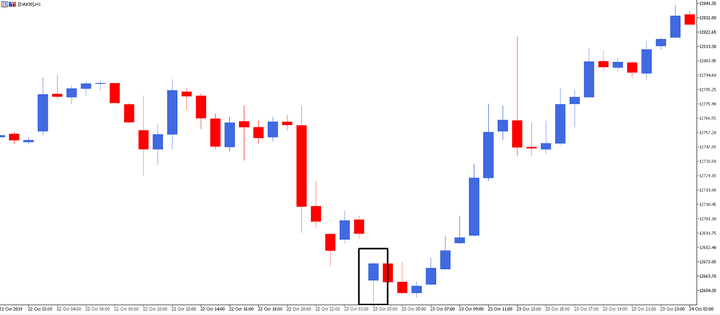
Source: Demo Account - MetaTrader 4 Ultimate - DAX30 Chart - H1 Chart - Data Range: October 21, 2019 to October 24, 2019. Conducted on January 13, 2020. Note that past performance is not a reliable indicator of future results.
The hammer candlestick has a long lower shadow, which is usually twice the length of the actual body. It is a bullish reversal candlestick pattern, typically appearing at the bottom of downtrends. The body can be either bullish or bearish, but it is considered stronger if it is bullish.
2. Inverted Hammer Candlestick
As the name suggests, the Japanese inverted hammer candlestick has the same silhouette as the one described in the previous section, but the difference is that it is symmetrically reversed. This means that the long wick that characterizes the hammer this time is the upper portion, located on the body.
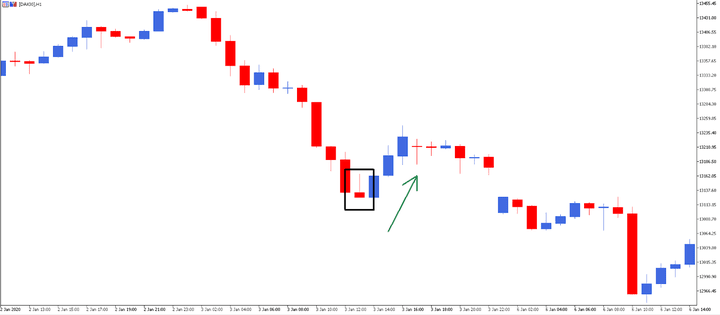
Source: Demo Account - MetaTrader 5 Ultimate - DAX30 Chart - H1 Chart - Data Range: January 2, 2020 to January 6, 2020. Produced on January 13, 2020 - Please note that past performance is not a reliable indicator of future results.
This signal remains valid for the hammer and also indicates a potential bullish signal.
3. Harami Candlestick
The number of candles in the pattern is 2. The market is characterized by a prevailing trend.
Bullish Harami Candle
The body of the first candle is red, while the second is a bullish Japanese candle (blue). But more importantly, the second candle must be fully included within the body of the previous red candle, just unlike the enveloping candle we saw before.
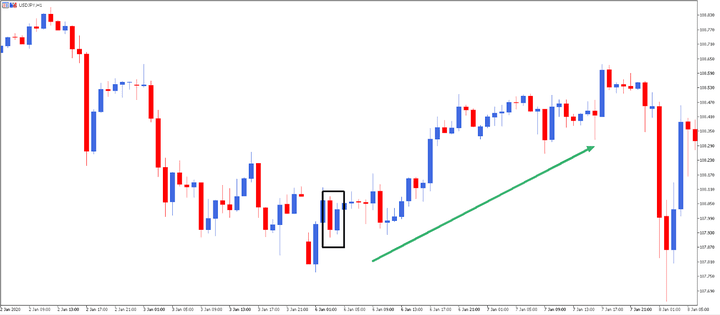
Source: Demo Account - MetaTrader 5 Ultimate - USDJPY Chart - H1 Chart - Data Range: January 2, 2020 to January 8, 2020. Produced on January 13, 2020 - Please note that past performance is not a reliable indicator of future results.
Pattern Type: Change of Trend
Future trend: Upward
Bearish Harami Candlestick
The body of the first candle is blue, while the second candle is red. But most importantly, the second candle must be fully included within the body of the previous blue candle.
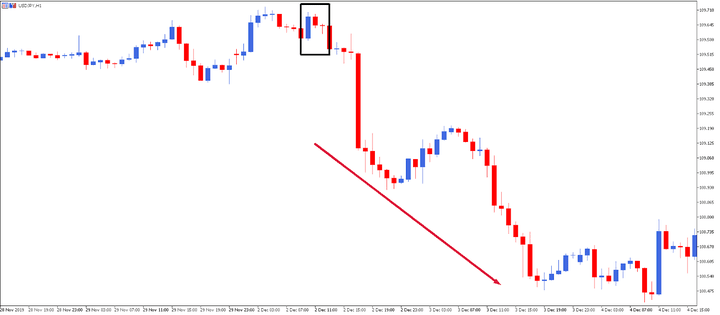
Source: Demo Account - MetaTrader 5 Supreme Edition - USDJPY - H1 Chart - Data Range: November 28, 2019 to December 4, 2019. Created on January 13, 2020 - Please note that past performance is not a reliable indicator of future results.
Pattern Type: Change of Trend
Future trend: Bearish
Forex and CFD Trading
Trade over 40 currency pairs via CFDs 24/5
Start trading

4. Shooting Star Candlestick
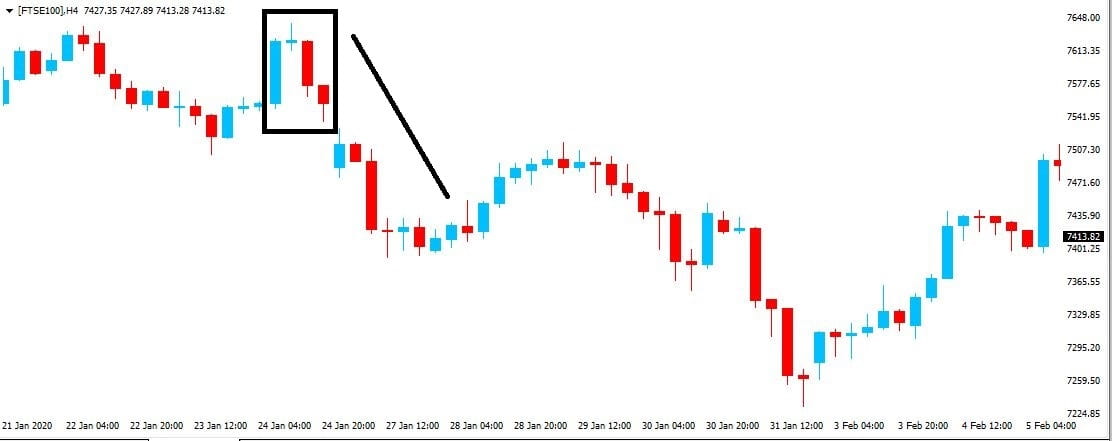
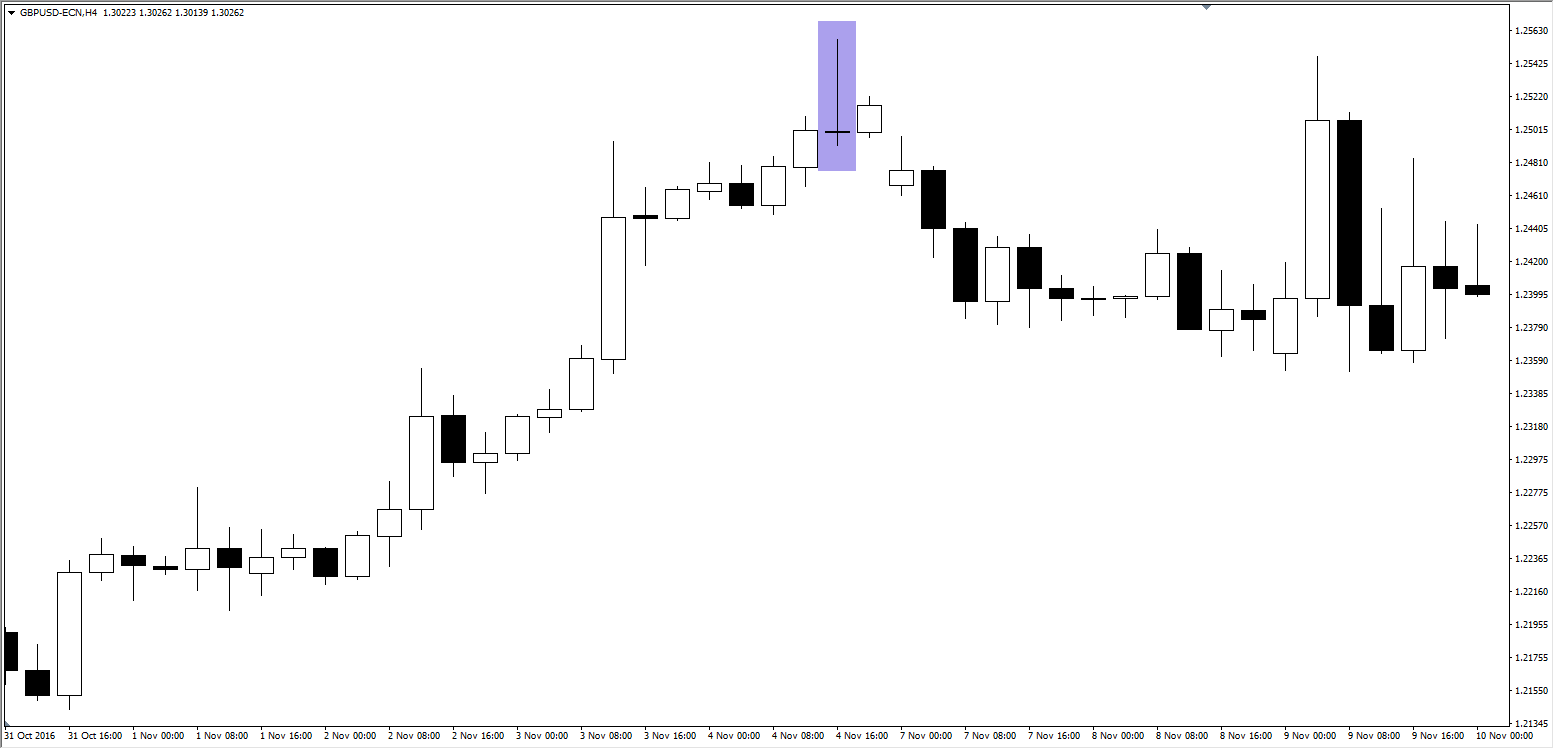
Source: Demo Account - MetaTrader 4 Ultimate - FTSE 100 Chart - H4 Chart - Data Range: January 16, 2020 to February 17, 2020. Conducted on January 17, 2020. Note that past performance is not a reliable indicator of future results.
Disclaimer: Charts for financial instruments in this article are for illustrative purposes and do not constitute trading advice or a solicitation to buy or sell any financial instrument provided by Admirals (CFDs, ETFs, Shares). Past performance is not necessarily an indication of future performance.
The shooting star candle appears in uptrends, indicating a potential trend reversal. The wick is long in the market direction, upside down, and longer than the candle body. The body can be either bullish or bearish, but is considered stronger if it is bearish.
5. Hanging Man Candlestick
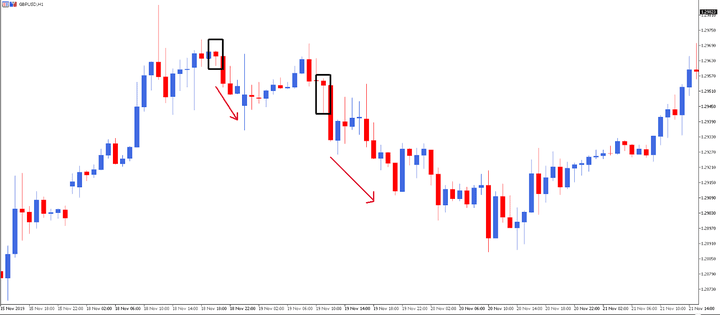
Source: Demo Account - MetaTrader 5 Supreme Edition - GBPUSD - H1 Chart - Data Range: November 15, 2019 to November 21, 2019. Created on January 13, 2020 - Please note that past performance is not a reliable indicator of future results.
The Hanging Man candlestick is similar to the Hammer candlestick, but it mainly occurs at the top of an uptrend and can serve as a warning of a potential bearish reversal.
6. Piercing Line Candlestick
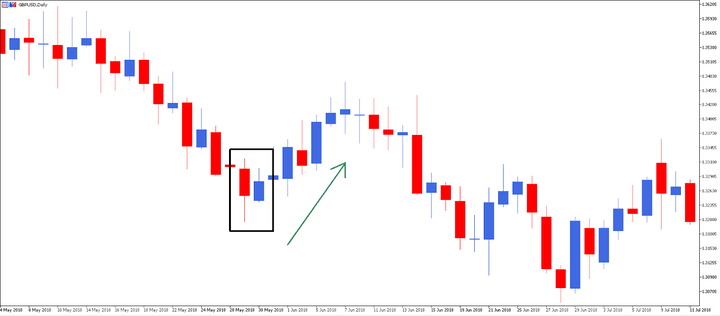
Source: Demo Account - MetaTrader 5 Supreme Edition - GBPUSD - D1 Chart - Data range: May 4, 2018 to July 11, 2018. Created on January 13, 2020 - Please note that past performance is not a reliable indicator of future results.
The Piercing Line candlestick is a Japanese candlestick pattern for bullish reversals. It is very common in the forex market. This pattern occurs when the second bullish candle closes above the midpoint of the first bearish candle. The low of the second candle is lower than the low of the first candle. In the forex market, the pattern is valid even if the low of the second candle equals the low of the first candle.
7. Bullish and Bearish Engulfing Candlesticks
Bullish and bearish engulfing candlesticks are reversal patterns. Bullish engulfing candlesticks typically occur at the bottom of a downtrend, while bearish engulfing candlesticks are observed at the top of an uptrend. The bullish engulfing pattern features two candlesticks. The first candlestick is contained within the real body of the second candlestick, which is always bullish. The bearish engulfing pattern also features two candlesticks. The first candlestick is contained within the real body of the second candlestick, which is always bearish.
Example of a bullish engulfing pattern:
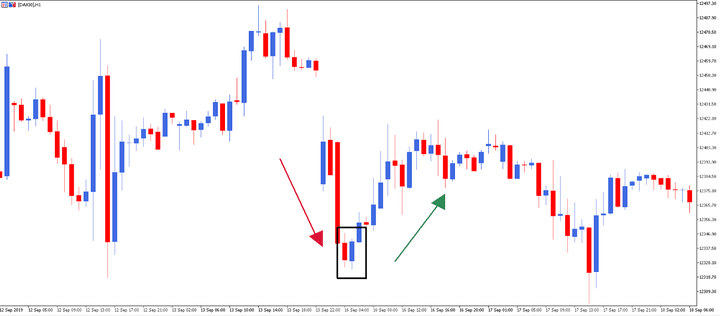
Source: Demo Account - MetaTrader 4 Ultimate - DAX30 - H1 Chart - Data Range: September 12, 2019 to September 18, 2019. Conducted on January 13, 2020. Note that past performance is not a reliable indicator of future results.
Example of a bearish engulfing pattern:
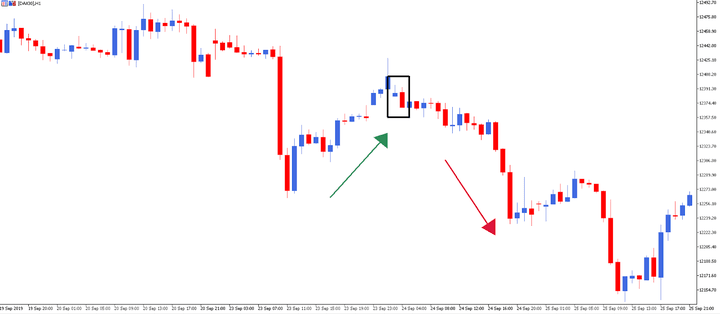
Source: Demo Account - MetaTrader 4 Ultimate - DAX30 - H1 Chart - Data Range: September 19, 2019 to September 25, 2019. Conducted on January 13, 2020. Note that past performance is not a reliable indicator of future results.
8. The Dark Cloud Candlestick
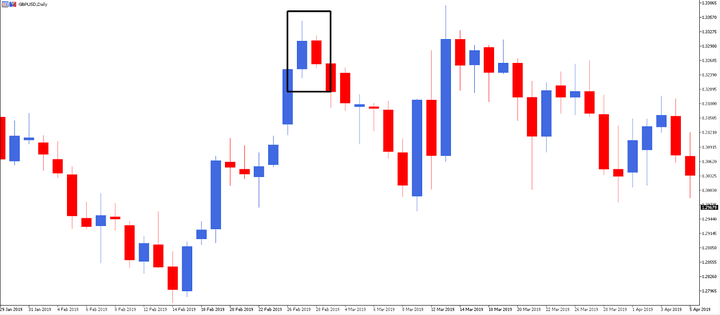
Source: Demo Account - MetaTrader 5 Supreme Edition - GBPUSD - D1 Chart - Data range: January 29, 2019 to April 5, 2019. Created on January 13, 2020 - Note that past performance is not a reliable indicator of future results.
The Dark Cloud candlestick is a bearish reversal pattern that appears in uptrends. It consists of two candles: one bullish and the other bearish. A Dark Cloud candlestick forms when the second candle opens above the close of the first candle, but then declines and closes above the opening price of the first bullish candle.
This pattern is the opposite of the piercing line. Similarly, in the forex market, a dark cloud candlestick is valid even when the second candle opens at the high of the first candle, but not necessarily above it. However, the important thing is that the second candle in this pattern must close somewhere less than 50% of the high of the first candle (the real body of a bearish candle).
9. Three Black Crows candlestick
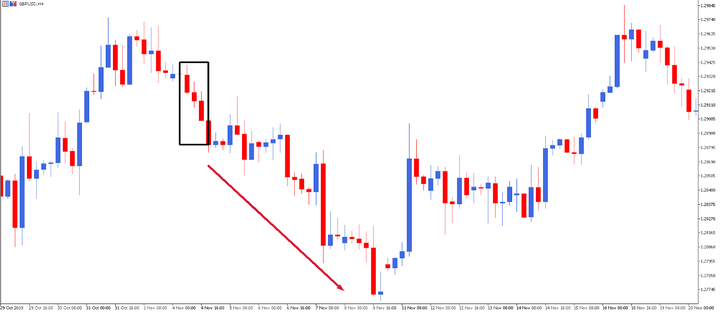
Source: Demo Account - MetaTrader 5 Supreme Edition - GBPUSD - H4 Chart - Data Range: October 2, 2019 to October 24, 2019. Produced on January 13, 2020 - Please note that past performance is not a reliable indicator of future results.
This type of Japanese candlestick pattern consists of 3 candles. The market is characterized by an upward trend. There are 3 consecutive red candles on the chart. Each candle opens within the range of the previous candle's body, and each candle closes at new low levels.
These three consecutive red candles, in the context of a bearish market, represent a continuation of the primary trend.
Pattern Type: Continuation of the Primary Trend
Trend: Bearish
10. The 3 Soldiers Candles
To correctly identify this pattern, we need to observe three candles. Each candle will open and close at higher levels than the previous candle.
Pay attention to each candle, the opening price should be in the body of the previous candle.
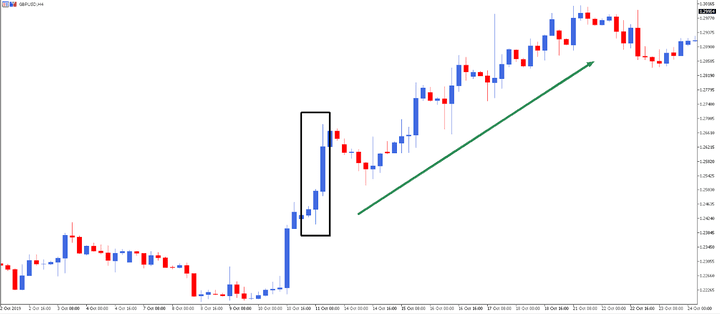
Source: Demo Account - MetaTrader 5 Supreme Edition - GBPUSD - D1 Chart - Data range: October 2, 2019 to October 24, 2019. Created on January 13, 2020 - Please note that past performance is not a reliable indicator of future results.
These three consecutive candles are blue (bullish), while the market has an upward trend.
Pattern Type: Continuation of the Primary Trend
Trend: Upward
11. Morning Star Candlestick
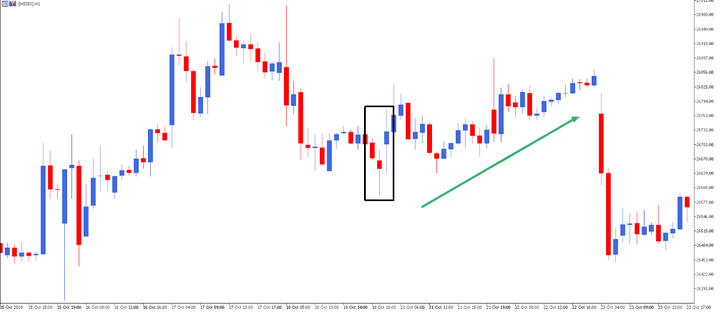
Source: Demo Account - MetaTrader 5 Supreme Edition - GBPUSD - H4 Chart - Data Range: October 2, 2019 to October 24, 2019. Produced on January 13, 2020 - Please note that past performance is not a reliable indicator of future results.
This type of Japanese candlestick pattern also consists of three candles and appears on charts during bearish markets. The pattern begins with a bearish black candle, followed by a doji, or small black candle, and then a bullish white momentum candle that reverses the trend.
12. Evening Star Candlestick
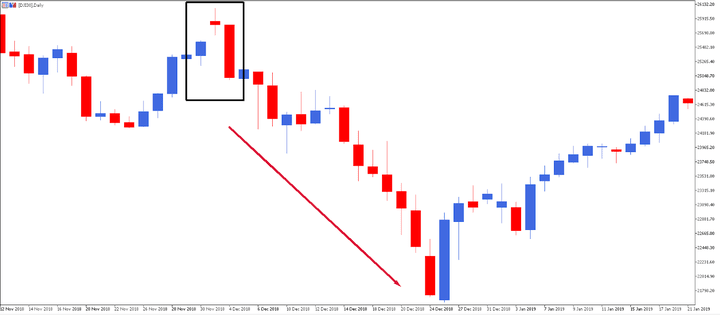
In this case, the market is bullish, and the pattern consists of three candles. The first candle is a bullish white candle, followed by a short-bodied candle with a long wick in the upward direction. Immediately after, a bearish black candle appears on the chart.
Continue reading the article to learn more about the most common Japanese candlestick formations and types.