


Bitcoin's 24-hour active buyer net volume has turned bullish after weeks of sell-side dominance.
Despite the short-term optimism, long-term buyer flows remain negative, leaving investors wary of a complete trend reversal.
Bitcoin [BTC] appears to be regaining strength as selling pressure from active buyers eases. With no major macroeconomic headwinds, BTC could see moderate upside this week.
Is this recovery sustainable?
24-hour net buying volume shows positive movement
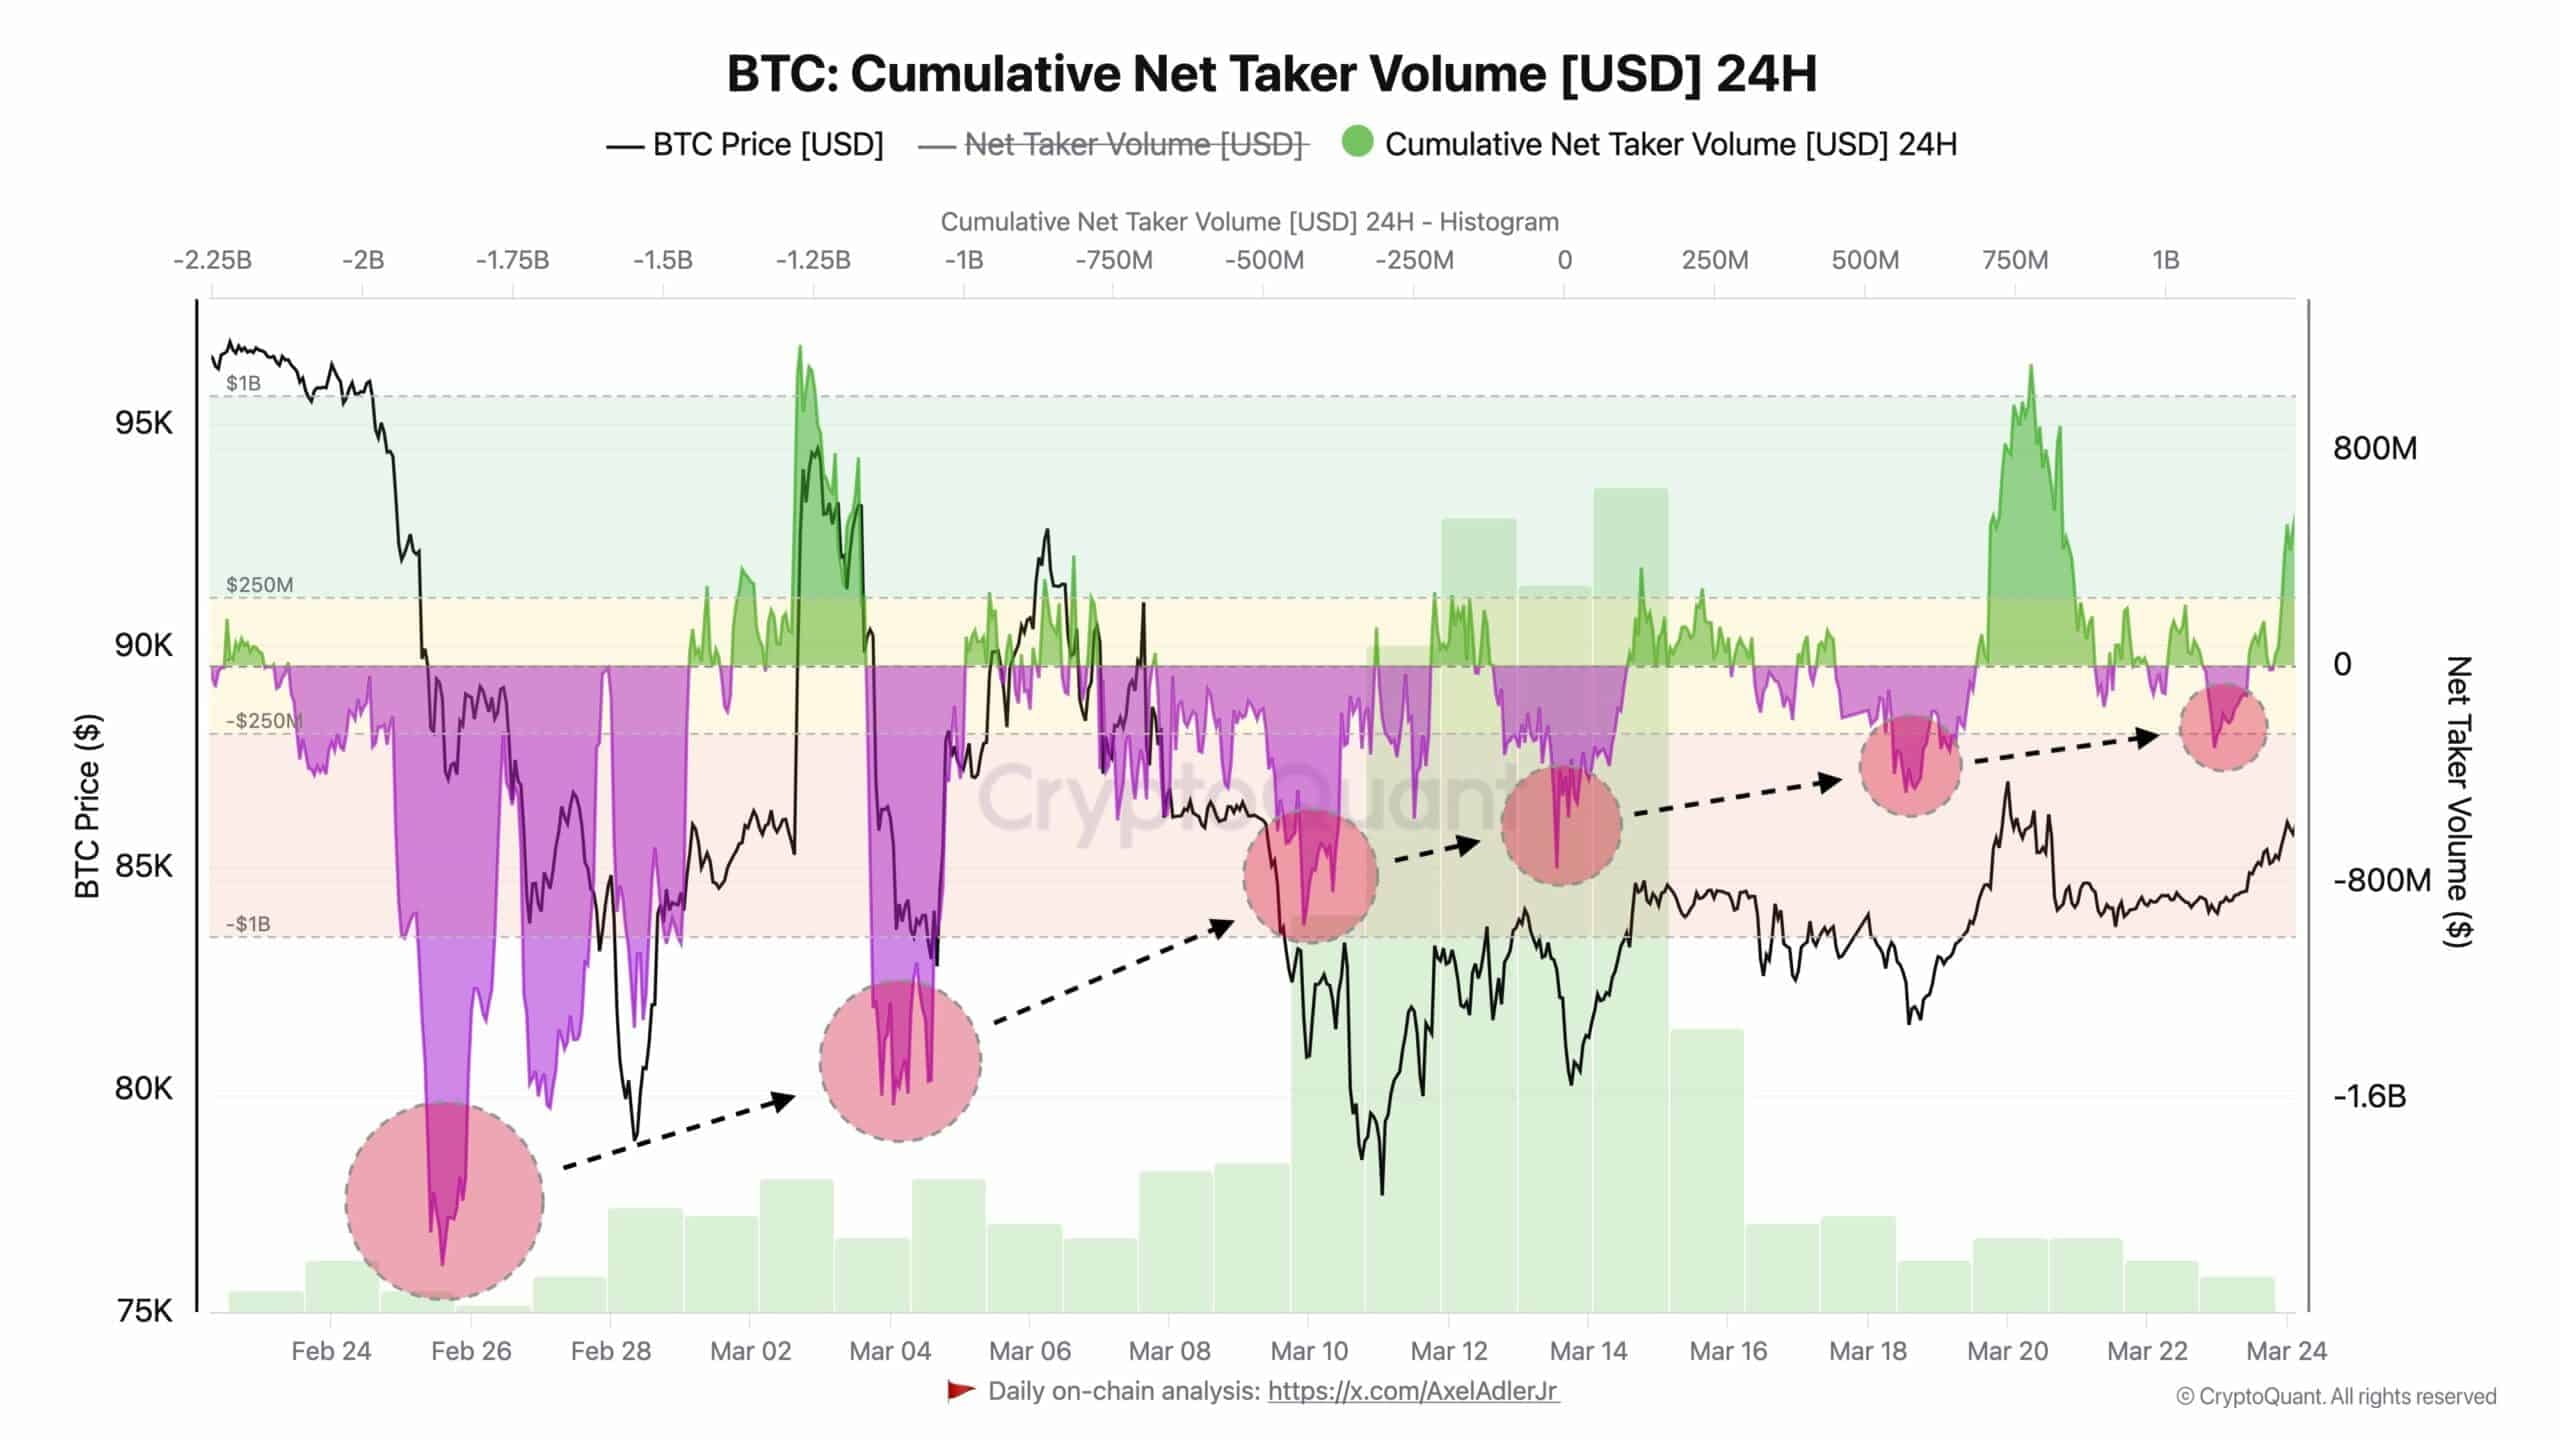
Bitcoin's 24-hour cumulative net active buyer volume has shown a notable shift over the past month.
The index, which measures market participants' scruples, was deep in negative territory throughout February — with net volume falling as low as -$1 billion.
However, in recent days, the cumulative figure has returned to positive territory. This shift shows that active buyers have begun to dominate the market after weeks of strong control by the sellers.
Source: X
Historical patterns show that every time this indicator changes from negative to positive, BTC price tends to increase.
The most recent surge coincided with BTC's recovery from sub-$80K to above $87K.
Bitcoin's Long-Term Net Buying Volume Remains Under Selling Pressure
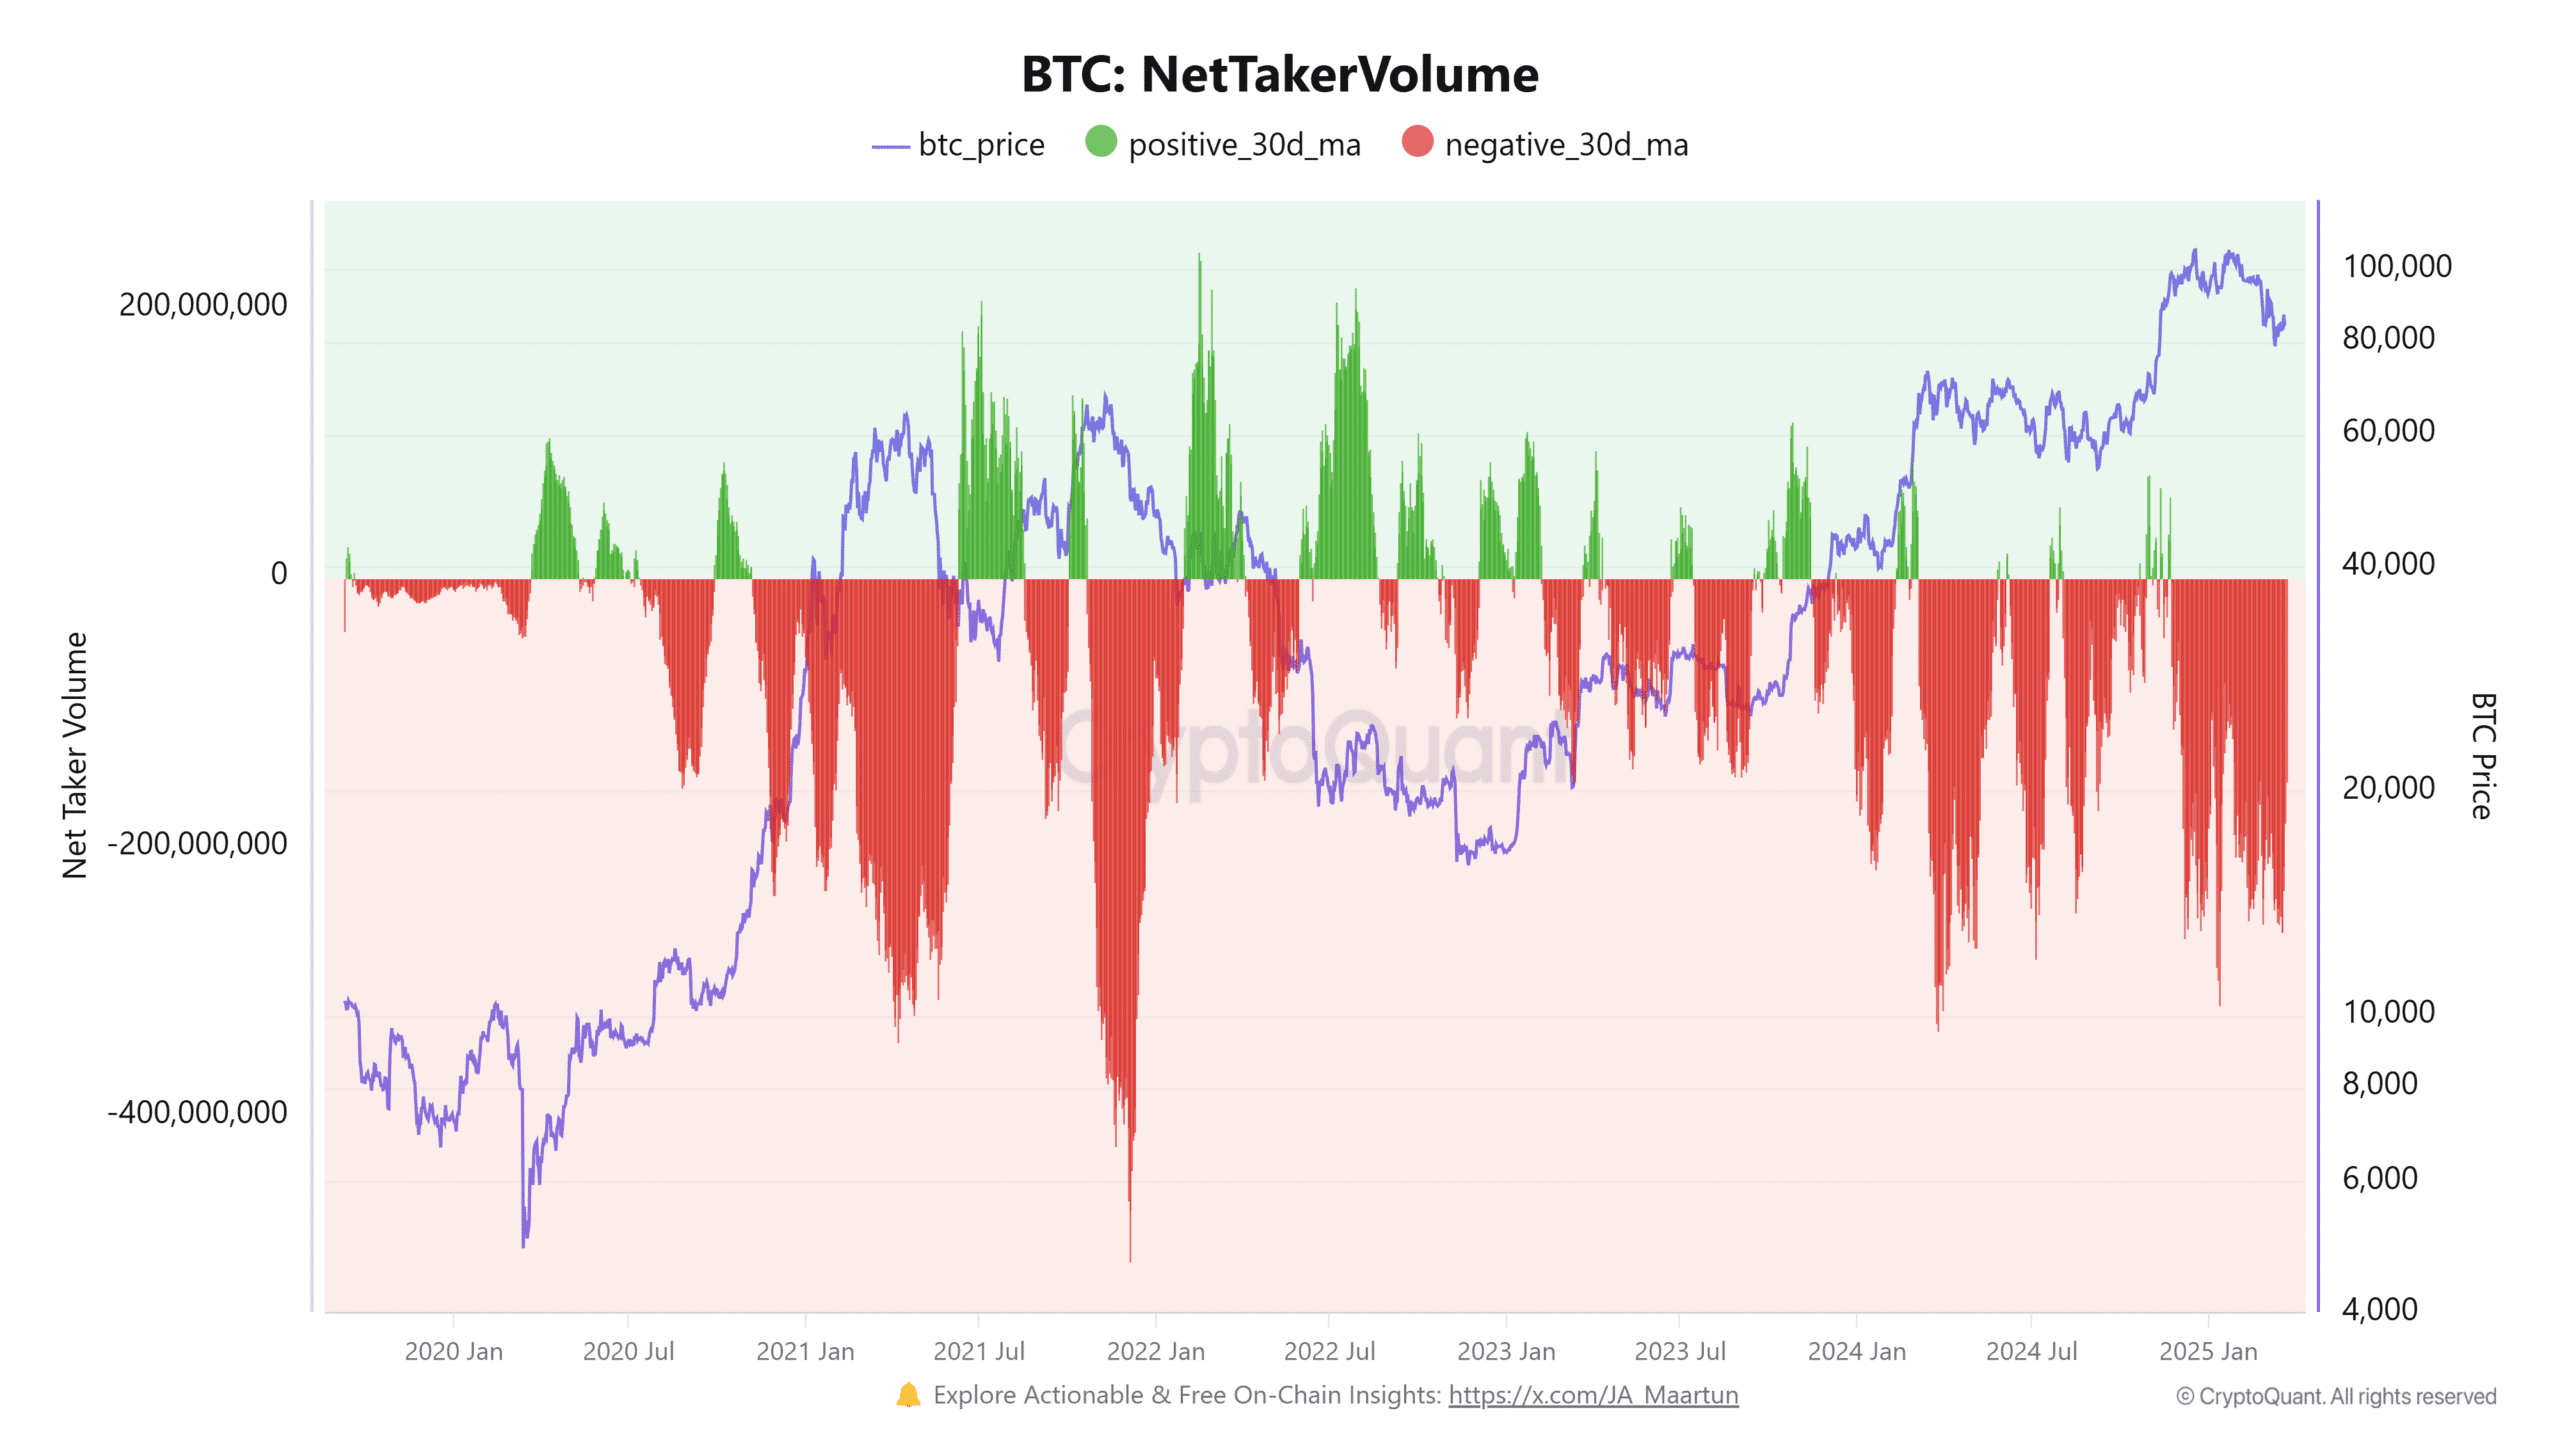
While the 24-hour indicator shows bullish signs, the longer-term net buy volume indicator — the 30-day moving average — provides a more comprehensive picture.
This chart shows that negative net flows still dominate, with continuous red bars representing accumulated pressure from sellers.
Source: CryptoQuant
Although there have been some brief periods of positive net volume in recent months, a continuous green streak has not been established.
This suggests that while sellers may be taking a short-term pause, the market is still weighed down by previous periods of strong selling.
A complete transition to a sustainable green phase on this chart would significantly strengthen the bullish scenario.
BTC Price Closes Above Important Support Level
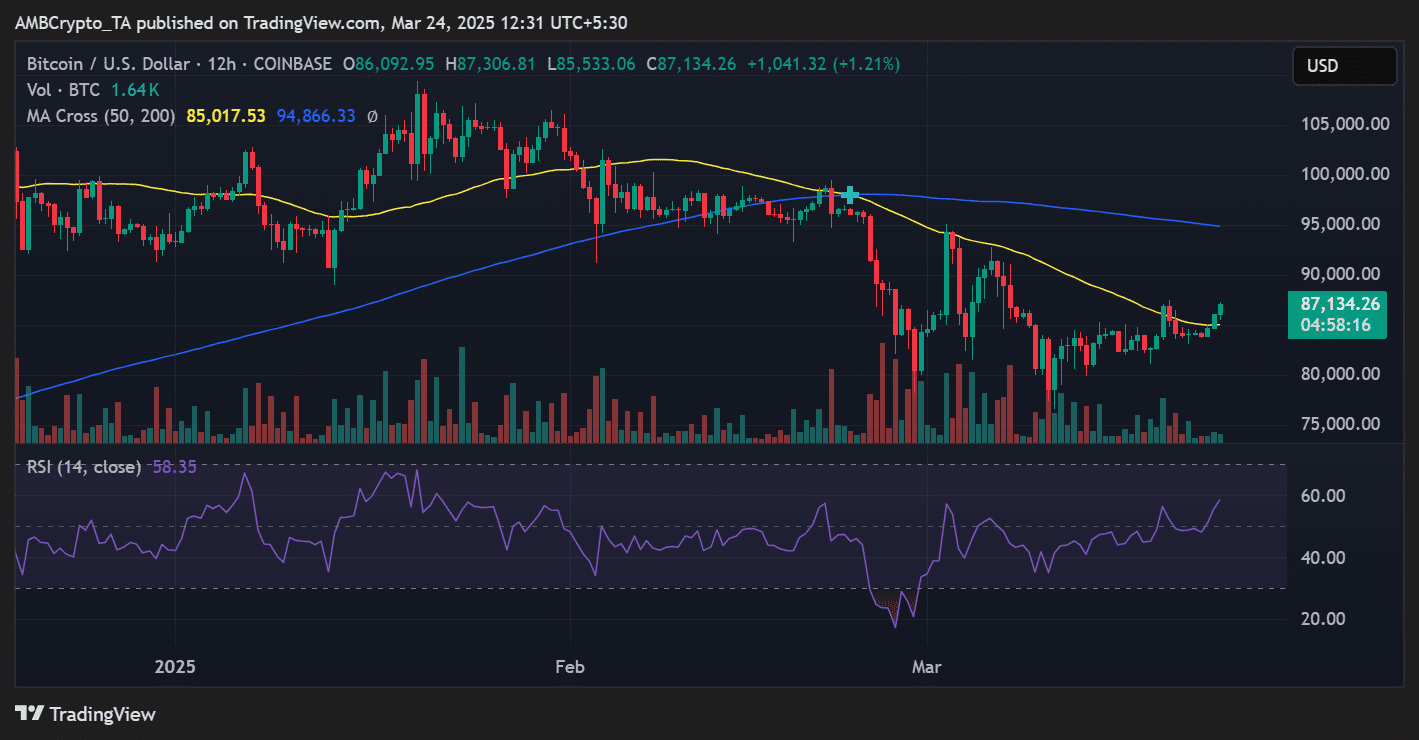
In terms of price, Bitcoin broke above its 50-day moving average at $85,017 and is trading at $87,134.
The 12-hour chart also shows improving momentum, with the Relative Strength Index [RSI] rising to 58.35 — near bullish territory but not yet overbought.
Source: TradingView
Volume remains relatively stable, but if BTC breaks above the 200-day MA resistance at $94,866, it could open the way to retest the $95K–$100K price range. However, a rejection near this range would result in sideways action.
Predictions for this week?
The key factor is whether buyer demand can sustain momentum without external catalysts. So far, the data suggests a pretty good risk-reward setup for a continued rally.
However, caution is still required, especially as BTC approaches a key psychological resistance zone.
Buyers could push for higher targets if net active buyer volume holds above zero and BTC sustains above the 50-day MA.
Conversely, a drop below $85K would signal weakness and could re-emerge short-term selling pressure.
Source: https://tintucbitcoin.com/bitcoin-buying-pressure-increases-to-87k-usd-btc-heading-to-95k-usd/
Thank you for reading this article!
Please Like, Comment and Follow TinTucBitcoin to stay updated with the latest news about the cryptocurrency market and not miss any important information!