Brief Overview of the TON/USDT Situation (1D)
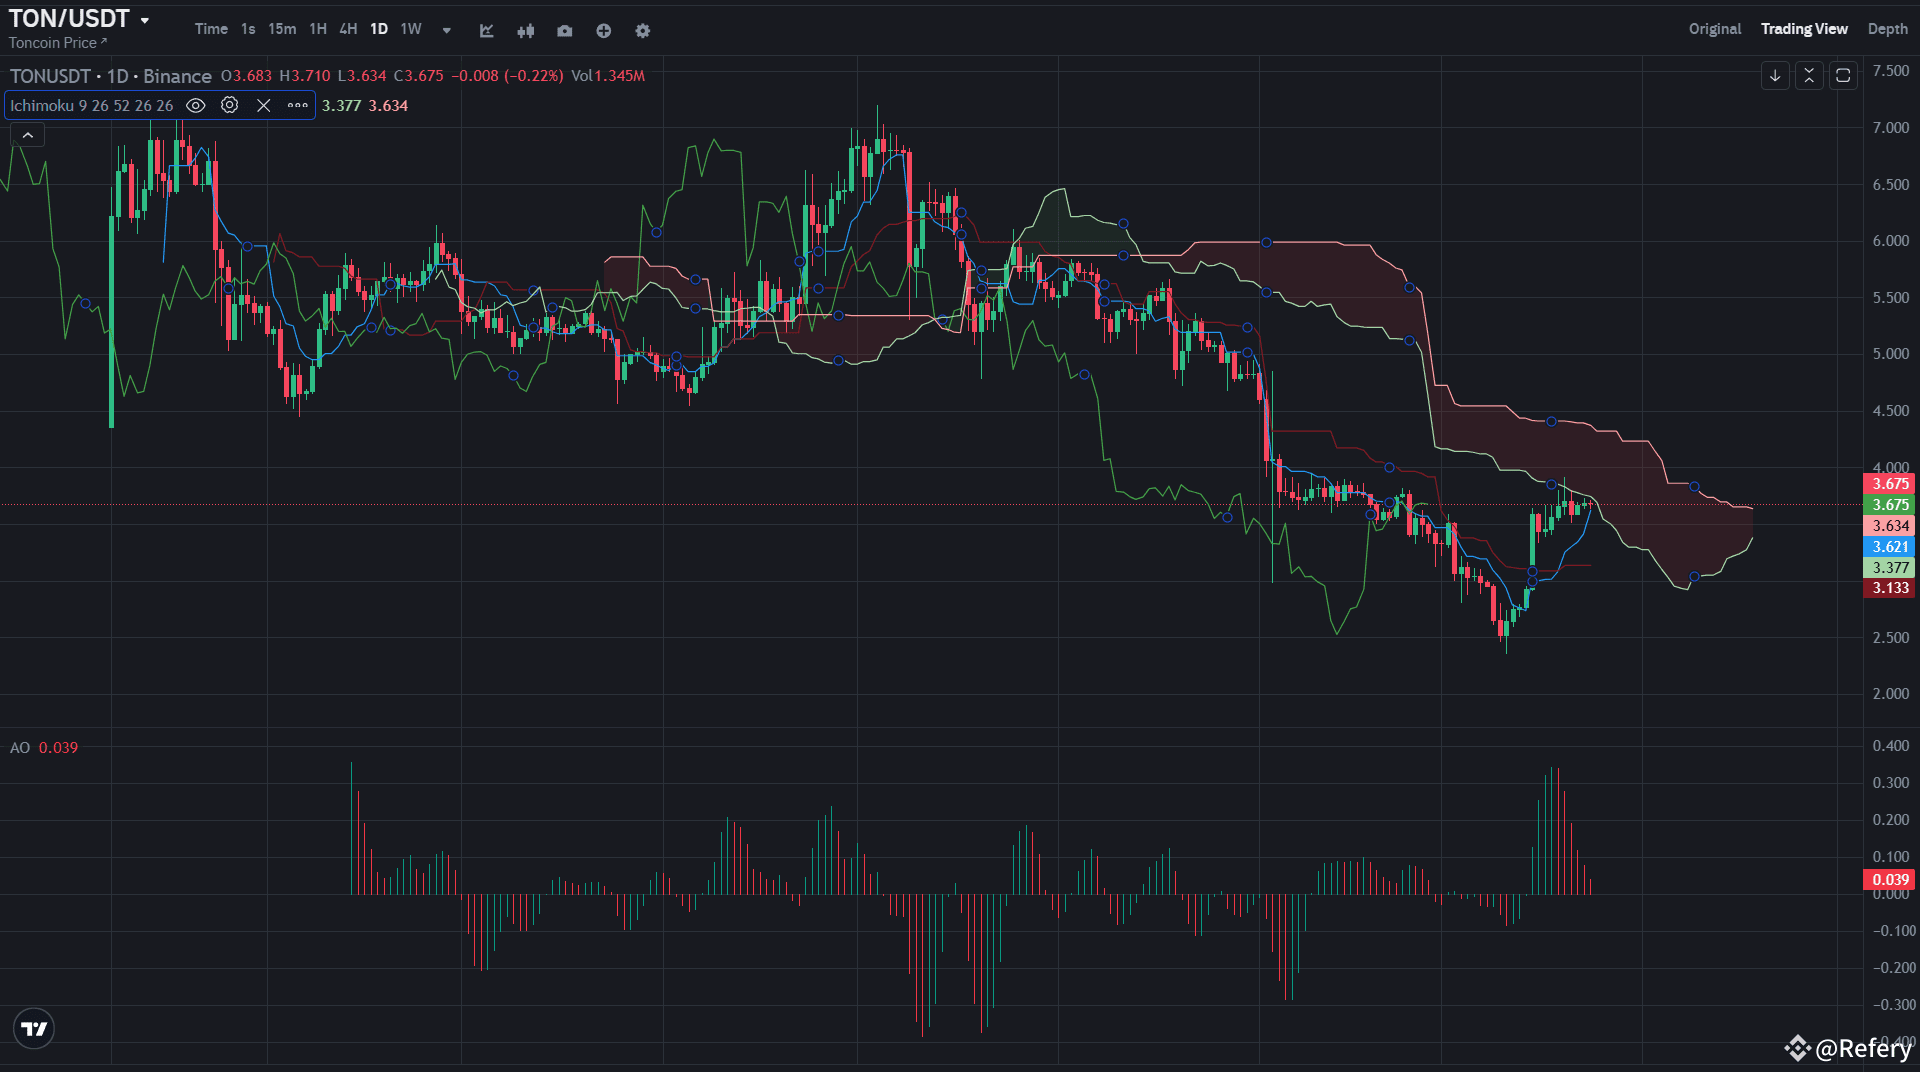
The asset price is testing the lower boundary of the Ichimoku Cloud after a fairly strong rebound from the ~$2.70 level in early March. Currently, there is a battle for consolidation above the $3.60–$3.70 range, which is critically important for the continuation of the uptrend. The Awesome Oscillator indicates a slowdown in bullish momentum.
In-Depth Technical Analysis
Ichimoku Cloud:
The current price position is inside the cloud, closer to its lower boundary (Senkou Span A at $3.677).
Kijun-sen (Base Line): $3.621 — acts as the nearest support level.
Tenkan-sen (Conversion Line): $3.634 — the price is hovering around it, indicating a phase of uncertainty.
Chikou Span (Lagging Span): positioned below the price, suggesting a bearish context on a broader scale.
Future Cloud (Kumo Future): remains bearish (Senkou Span A is below Senkou Span B), although it’s gradually narrowing, which signals a potential trend reversal if a confident breakout occurs.
Awesome Oscillator (AO):
The histogram is slightly above the zero line (+0.039), but momentum is fading, indicating weakening bullish pressure.
After the recent strong upward movement, the AO is slowing down, which may signal the formation of a correction or consolidation phase.
Support and Resistance Levels:
Nearest resistance: $3.70–$3.75 (lower boundary of the cloud + horizontal level).
Key resistance: $4.00 — upper boundary of the cloud (Senkou Span B). A breakout above this level would be a significant signal for a bullish trend reversal.
Support: $3.62 (Kijun-sen) and below at $3.37 (Tenkan-sen).
Candlestick Formations:
The latest candlesticks show slowing growth; the small candle bodies indicate market indecision. An important test of the Ichimoku Cloud is approaching, which will determine the next direction.
Possible Scenarios
Bullish Scenario (primary, if $3.75 is broken):
A breakout above $3.75 with consolidation opens the way to test the $4.00–$4.10 area.
Overcoming the $4.10 level may lead to further growth up to $4.50 and beyond
The asset price is testing the lower boundary of the Ichimoku Cloud after a fairly strong rebound from the ~$2.70 level in early March. Currently, there is a battle for consolidation above the $3.60–$3.70 range, which is critically important for the continuation of the uptrend. The Awesome Oscillator indicates a slowdown in bullish momentum.
In-Depth Technical Analysis
Ichimoku Cloud:
The current price position is inside the cloud, closer to its lower boundary (Senkou Span A at $3.677).
Kijun-sen (Base Line): $3.621 — acts as the nearest support level.
Tenkan-sen (Conversion Line): $3.634 — the price is hovering around it, indicating a phase of uncertainty.
Chikou Span (Lagging Span): positioned below the price, suggesting a bearish context on a broader scale.
Future Cloud (Kumo Future): remains bearish (Senkou Span A is below Senkou Span B), although it’s gradually narrowing, which signals a potential trend reversal if a confident breakout occurs.
Awesome Oscillator (AO):
The histogram is slightly above the zero line (+0.039), but momentum is fading, indicating weakening bullish pressure.
After the recent strong upward movement, the AO is slowing down, which may signal the formation of a correction or consolidation phase.
Support and Resistance Levels:
Nearest resistance: $3.70–$3.75 (lower boundary of the cloud + horizontal level).
Key resistance: $4.00 — upper boundary of the cloud (Senkou Span B). A breakout above this level would be a significant signal for a bullish trend reversal.
Support: $3.62 (Kijun-sen) and below at $3.37 (Tenkan-sen).
Candlestick Formations:
The latest candlesticks show slowing growth; the small candle bodies indicate market indecision. An important test of the Ichimoku Cloud is approaching, which will determine the next direction.
Possible Scenarios
Bullish Scenario (primary, if $3.75 is broken):
A breakout above $3.75 with consolidation opens the way to test the $4.00–$4.10 area.
Overcoming the $4.10 level may lead to further growth up to $4.50 and beyond