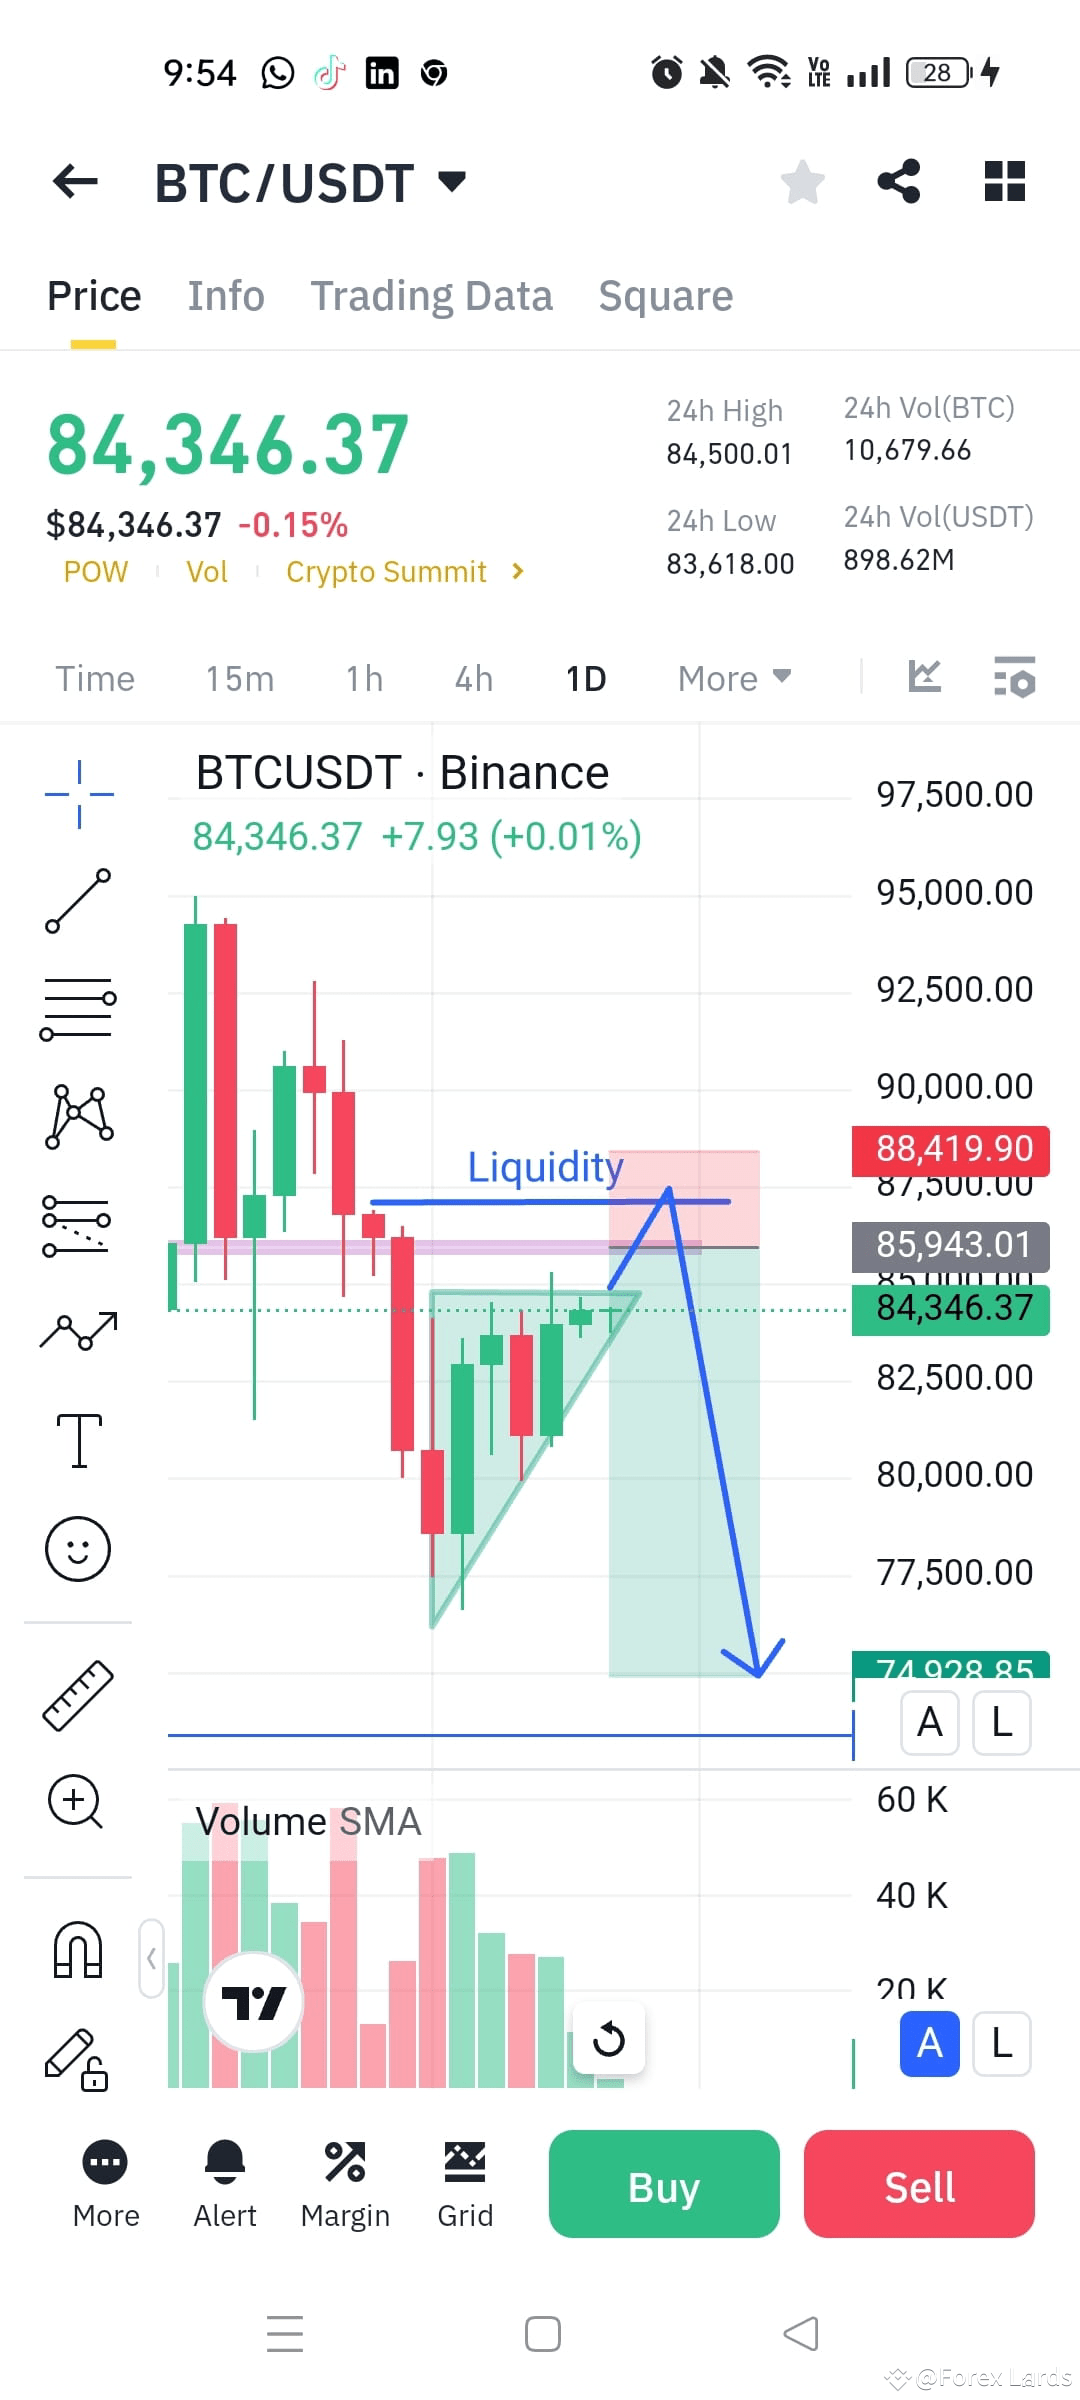
$BTC BTC/USDT Analysis (Based on Chart)
1. Key Observations:
Current Price: $84,346.37
Resistance/Liquidity Zone: Around $88,419.90 (highlighted in red)
Support Zone: Near $74,928.85
Chart Pattern: Ascending Triangle (bullish pattern)
Volume Analysis: Mixed, with green and red bars showing indecision
2. Possible Price Action:
Scenario 1 (Liquidity Grab & Drop):
Price may push toward the liquidity zone (~$88,419.90) to trigger stop-loss orders and attract sellers.
If strong rejection happens in this area, BTC might drop sharply towards $75,000.
The blue arrow in the chart suggests this bearish move.
Scenario 2 (Breakout & Continuation):
If BTC breaks above the liquidity zone and holds above $88,500, a continuation toward $90,000+ is possible.
Volume increase would confirm this breakout.
3. Trading Considerations:
Short Position: If BTC gets rejected at the liquidity zone (~$88,500), a short trade targeting $75,000 could be profitable.
Long Position: If BTC breaks above $88,500 and holds, a long trade targeting $90,000-$92,000 may work.
Risk Management: Always use stop-loss and consider market conditions before entering trades.
$BTC #BTC
1. Key Observations:
Current Price: $84,346.37
Resistance/Liquidity Zone: Around $88,419.90 (highlighted in red)
Support Zone: Near $74,928.85
Chart Pattern: Ascending Triangle (bullish pattern)
Volume Analysis: Mixed, with green and red bars showing indecision
2. Possible Price Action:
Scenario 1 (Liquidity Grab & Drop):
Price may push toward the liquidity zone (~$88,419.90) to trigger stop-loss orders and attract sellers.
If strong rejection happens in this area, BTC might drop sharply towards $75,000.
The blue arrow in the chart suggests this bearish move.
Scenario 2 (Breakout & Continuation):
If BTC breaks above the liquidity zone and holds above $88,500, a continuation toward $90,000+ is possible.
Volume increase would confirm this breakout.
3. Trading Considerations:
Short Position: If BTC gets rejected at the liquidity zone (~$88,500), a short trade targeting $75,000 could be profitable.
Long Position: If BTC breaks above $88,500 and holds, a long trade targeting $90,000-$92,000 may work.
Risk Management: Always use stop-loss and consider market conditions before entering trades.
$BTC #BTC