Speaking seriously now, a tip from someone with over 5,000 hours of screen time, without any manipulation nonsense, news, and the devil in the details.
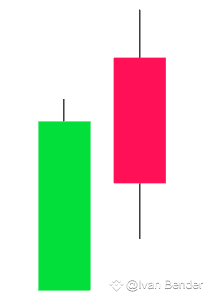
The clearest chart timeframe for short and medium-term operations is the 3-day candle; make it a habit to analyze the closing every 3 days. For my journey, it was the game-changer; maybe it won't be for you, as each person has a different perception. Well, I will list 4 points regarding the 3-day chart timeframe...
1- Noise Reduction: The 3-day chart helps reduce market noise by filtering out short-term price fluctuations that can distract or confuse analysis. This allows for a clearer view of the main trends.
2- Trend Identification: It facilitates the identification of medium-term trends.
3- Support and Resistance: Support and resistance levels can be more clearly identified on a 3-day chart, as it aggregates more data at each point on the chart, highlighting key areas of interest.
4- Less Stress: For traders who do not want to monitor the market daily, the 3-day chart offers a calmer view, allowing for more thoughtful decisions without the pressure of daily fluctuations.
The clearest chart timeframe for short and medium-term operations is the 3-day candle; make it a habit to analyze the closing every 3 days. For my journey, it was the game-changer; maybe it won't be for you, as each person has a different perception. Well, I will list 4 points regarding the 3-day chart timeframe...
1- Noise Reduction: The 3-day chart helps reduce market noise by filtering out short-term price fluctuations that can distract or confuse analysis. This allows for a clearer view of the main trends.
2- Trend Identification: It facilitates the identification of medium-term trends.
3- Support and Resistance: Support and resistance levels can be more clearly identified on a 3-day chart, as it aggregates more data at each point on the chart, highlighting key areas of interest.
4- Less Stress: For traders who do not want to monitor the market daily, the 3-day chart offers a calmer view, allowing for more thoughtful decisions without the pressure of daily fluctuations.