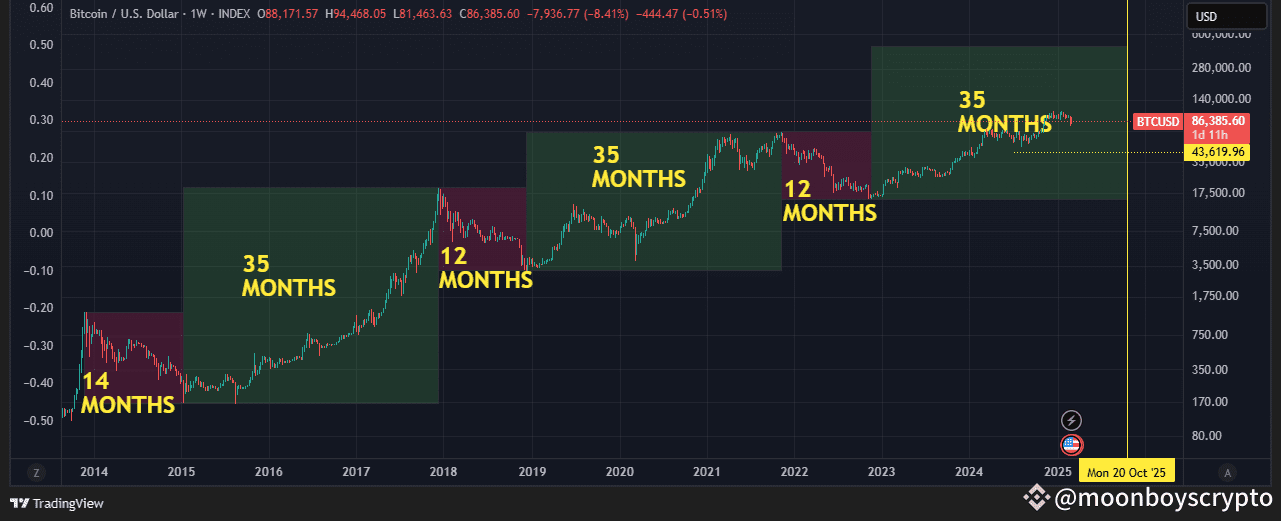
Bitcoin Market Cycles Since 2014
Let’s break down the major cycles since 2014, focusing on duration:
👉Post-2013 Bull run Market
After peaking at around $1,200 in December 2013, Bitcoin entered a bear market, bottoming out at approximately $170-$200 in January 2015. This decline lasted roughly 13-14 months (December 2013 to January/February 2015).
👉 Bull Run (2015-2017): Starting from the low of ~$200 in early 2015, Bitcoin rallied to nearly $20,000 by December 2017. This uptrend spanned about 35 months (February 2015 to December 2017).
👉 Bear Market (2018-2019): Following the $20,000 peak in December 2017, Bitcoin fell to a low of ~$3,200 by December 2018. This bear market lasted approximately 12 months (December 2017 to December 2018).
👉 Bull Run (2019-2021): After consolidating in 2019, Bitcoin began a significant uptrend from ~$4,000 in March 2020 (post-COVID crash) to ~$69,000 in November 2021. This bull run lasted about 35 months (2019 to November 2021).
👉 Bear Market (2022): Bitcoin dropped from $69,000 in November 2021 to ~$15,500 by November 2022, a decline lasting about 12 months (November 2021 to November 2022).
👉 Bull Run (2023-2025): Starting from the $15,500 low in November 2022, Bitcoin began rising, reaching new highs (e.g., above $100,000 speculated by early 2025 based on current trends). As of March 08, 2025, this bull run has been ongoing for about 28 months (November 2022 to March 2025) and counting, potentially approaching or exceeding 35 months if it continues into mid-2025.
Is the bull run over in your opinion?
#Trump’sExecutiveOrder
#WhiteHouseCryptoSummit
#JobsReportShock
#TexasBTCReserveBill
#MarketPullback
$BTC $TRUMP $FDUSD
Let’s break down the major cycles since 2014, focusing on duration:
👉Post-2013 Bull run Market
After peaking at around $1,200 in December 2013, Bitcoin entered a bear market, bottoming out at approximately $170-$200 in January 2015. This decline lasted roughly 13-14 months (December 2013 to January/February 2015).
👉 Bull Run (2015-2017): Starting from the low of ~$200 in early 2015, Bitcoin rallied to nearly $20,000 by December 2017. This uptrend spanned about 35 months (February 2015 to December 2017).
👉 Bear Market (2018-2019): Following the $20,000 peak in December 2017, Bitcoin fell to a low of ~$3,200 by December 2018. This bear market lasted approximately 12 months (December 2017 to December 2018).
👉 Bull Run (2019-2021): After consolidating in 2019, Bitcoin began a significant uptrend from ~$4,000 in March 2020 (post-COVID crash) to ~$69,000 in November 2021. This bull run lasted about 35 months (2019 to November 2021).
👉 Bear Market (2022): Bitcoin dropped from $69,000 in November 2021 to ~$15,500 by November 2022, a decline lasting about 12 months (November 2021 to November 2022).
👉 Bull Run (2023-2025): Starting from the $15,500 low in November 2022, Bitcoin began rising, reaching new highs (e.g., above $100,000 speculated by early 2025 based on current trends). As of March 08, 2025, this bull run has been ongoing for about 28 months (November 2022 to March 2025) and counting, potentially approaching or exceeding 35 months if it continues into mid-2025.
Is the bull run over in your opinion?
#Trump’sExecutiveOrder
#WhiteHouseCryptoSummit
#JobsReportShock
#TexasBTCReserveBill
#MarketPullback
$BTC $TRUMP $FDUSD