
Analysis of the relationship between trading volume and short-term price trends
There is no real concept and indicator of position volume in the stock market. The total volume of the entire stock market remains unchanged within a certain period of time, so the relationship between trading volume and price has become one of the important bases for judging the future trend of stock prices.
The On-Balance Volume (OBV) indicator was proposed by Granville in the 1960s and has been widely used. There are four major elements in stock market technical analysis: price, volume, time, and space. The OBV indicator is a technical indicator that uses the "volume" element as a breakthrough point to discover hot stocks and analyze stock price movement trends.
It digitizes and visualizes the relationship between stock market popularity - trading volume and stock price, and measures the driving force of the stock market by the change of stock market trading volume, so as to judge the trend of stock price. The OBV indicator is composed of OBV value and OBV line. The OBV line method extends the concept of "average of quantity", believing that trading volume is the vitality of the stock market, and stock price is just its superficial characteristics.
Therefore, trading volume usually precedes stock price. This theory of "volume first, price later" has long been proven by the stock market. In the stock market, the OBV indicator includes various situations of the relationship between trading volume and short-term price trends.
However, in the contract market, since two-way transactions can be profitable, the size of the transaction volume can only indicate the size of the market capacity of the product. For example, in the same contract market, under normal circumstances, the daily transaction volume of Bitcoin and Ethereum must be larger than that of Litecoin.
Because in any country or region, there are more investors who know about Bitcoin and Ethereum than Litecoin, so there are more participants and the trading volume is naturally larger. Moreover, the contract market can open and close positions at any time. The size of the trading volume can basically only reflect the size of the market capacity and the activity level of the product. It is difficult to accurately judge the short-term price trend by changes in trading volume alone.
If the contract price rises or falls with an increase in trading volume, it means that the contract price rise or fall is actively pursued by the long side or actively suppressed by the short side, that is, the contract price rise or fall trend is supported by the increase in trading volume;
On the other hand, it also shows that the energy of contract price fluctuation is gradually released due to the increase in trading volume, and the trend of contract price fluctuation may be alleviated or even ended.
Therefore, a partial and one-sided analysis of the comparative relationship between the rise and fall of contract prices and the increase and decrease of trading volumes, without paying attention to whether the contract price is at the beginning or end of the trend, may lead to completely opposite conclusions.
Analysis of the relationship between contract price trend and trading volume amplification
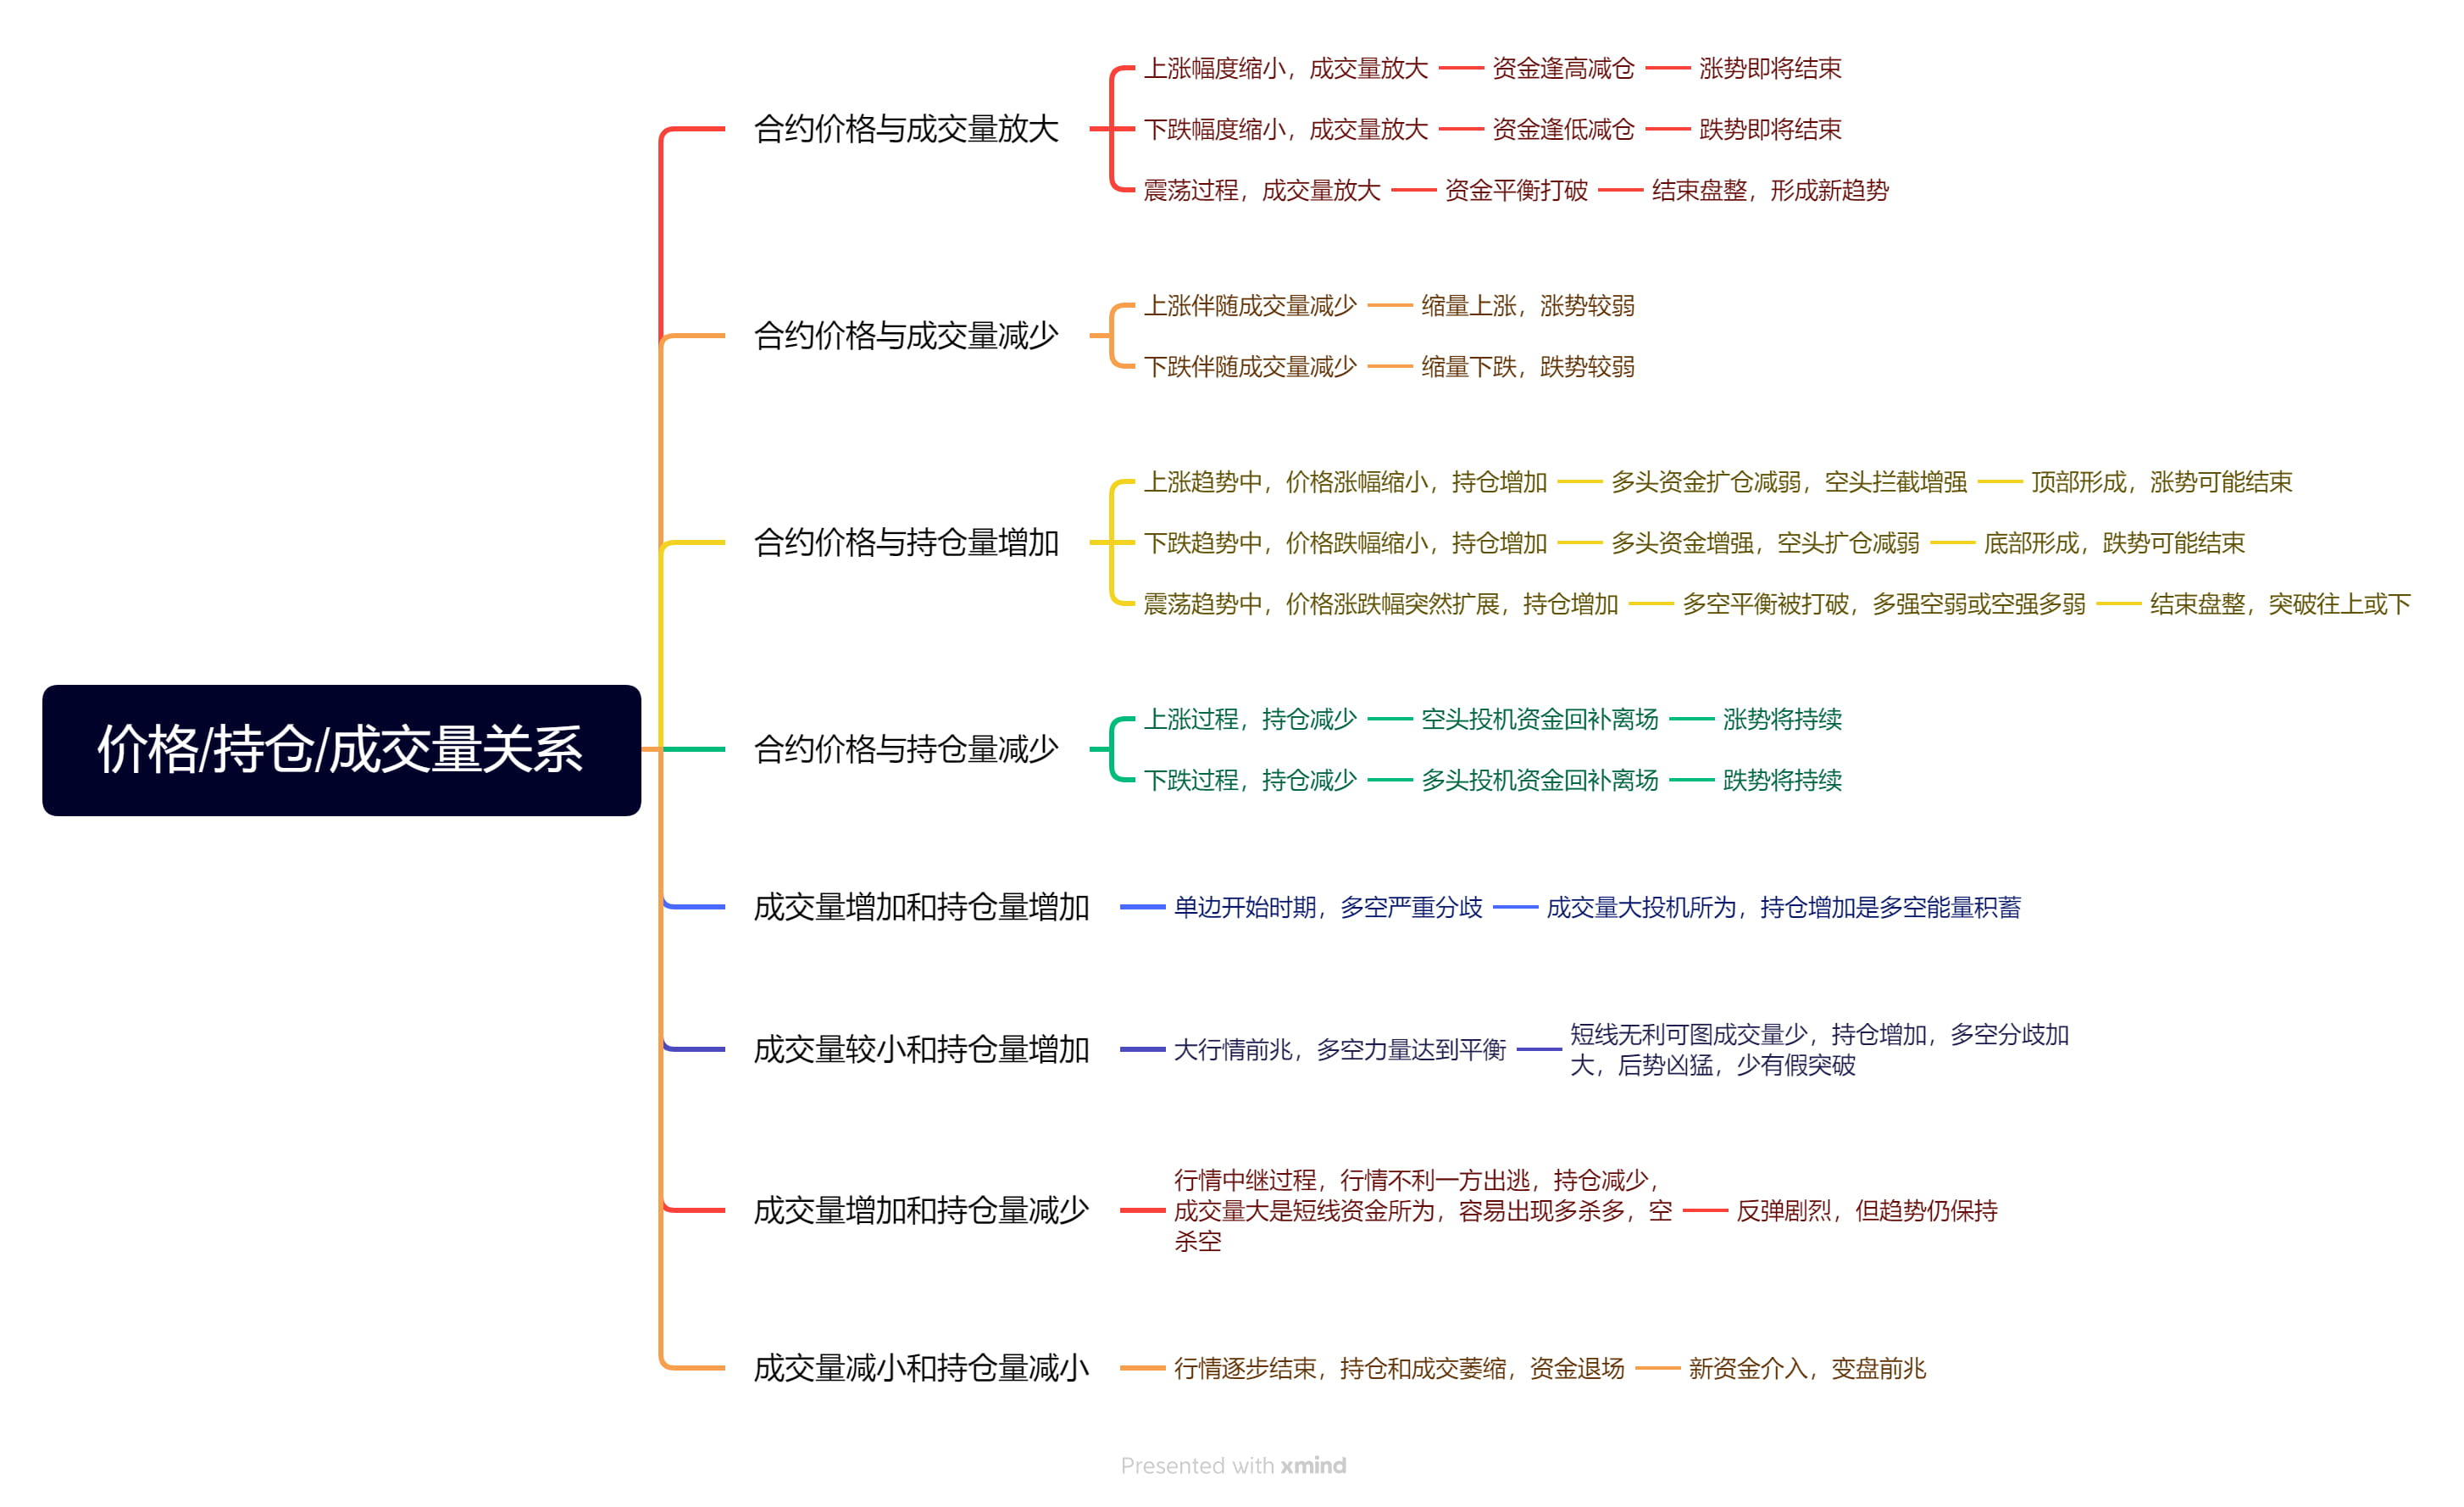
Generally speaking, when the contract price reaches a relatively high price area after a sustained and substantial rise, if the increase in the contract price gradually decreases and the trading volume increases significantly, it means that multiple funds may reduce their positions on the rise, and the top of the contract price is about to be formed. The rally may be over;
When the contract price reaches a relatively low price area after a sustained and sharp decline, if the decline in the contract price gradually narrows and the trading volume increases significantly, it reflects that the funds of the short side may reduce their weight on bargain hunting, and the bottom of the contract price is about to form, and a downward trend may occur. Finish;
When the contract price continues to oscillate in the region and maintains sideways fluctuations, especially when the contract price is at the bottom or top area for a long period of consolidation, if the rise or fall of the contract price suddenly increases and the trading volume also increases significantly, it will display The relative balance of the financial strength between the long and short sides will be broken, and a comparative situation of long strength and short strength or short strength and weakness will be formed. The contract price trend may end the consolidation and break upward or downward, forming a new round of rising or falling respectively. The momentum was matched by trading volume.
Analysis of the relationship between contract price trend and reduced trading volume
If the contract price rises or falls with a decrease in trading volume, generally speaking, there is no large-scale pursuit of long-side funds or large-scale suppression of short-side funds in the contract price rise or fall trend, and the price-volume comparison relationship of shrinking rise or shrinking fall is formed, indicating that the market rise or fall is weak;
Analysis of the relationship between open interest and short-term trend of contract prices
If the contract price rises or falls with an increase in open interest, it means that the rise or fall of the contract price is due to the expansion of long-side incremental funds and the expansion of short-side incremental funds. Especially when the contract price rises or falls by a large margin and the open interest increases by a large margin, the contract price has a strong upward or downward trend.
On the other hand, it also reflects that when the contract price rises, the short side's incremental funds are passively expanded to intercept and not actively covered, while when the contract price falls, the long side's incremental funds are passively expanded to absorb and not actively give up, especially when the contract price rises or falls by a small margin and the position increase is large.
Although the short-term trend of the contract price is still unclear, it still shows that both the long and short sides have invested a lot of incremental funds and started to compete for expanding their positions. The differences between the two sides have intensified, and they are in a heavy position confrontation. The ups and downs of the contract price may still fluctuate repeatedly.
Analysis of the relationship between contract price trends and the increase in open interest
Generally speaking, when the contract price reaches a relatively high price area after a sustained and substantial rise, if the increase in contract price gradually decreases and the position increases significantly, it means that the pursuit of incremental funds from the long side to expand positions gradually weakens, and the incremental funds from the short side gradually weaken. The interception of position expansion continues to strengthen, the contract price top is about to form, and the upward trend may end;
When the contract price reaches a relatively low price area after a sustained and sharp decline, if the decline in contract price gradually narrows and the position increases significantly, it reflects that the pressure on short parties to expand their positions by incremental funds gradually weakens, and the incremental funds from long parties expand and absorb positions. Continuously strengthening, the contract price bottom is about to form, and the decline may end;
When the contract price continues to oscillate in the region and maintains sideways fluctuations, if the contract price rises and falls suddenly expands, and the open interest increases significantly, it shows that the relative balance of the financial strength of the long and short parties is broken, and a long-short-weak or long-short situation is formed. Based on the comparative situation of short strength and multiple weakness, the contract price trend may end the consolidation and break through upward or downward.
However, due to the increase in open interest, it shows that the differences between the two parties have not been alleviated, and are becoming increasingly acute day by day, so the contract price may still fluctuate repeatedly.
Analysis of the relationship between contract price trend and reduction of open interest
If the contract price rises or falls with a decrease in open interest, generally speaking, a decrease in open interest during an uptrend indicates that the upward momentum comes from the active covering of short speculative funds, while a decrease in open interest during a downtrend reflects that the downward momentum comes from the active shaving of long speculative funds.
But at the same time, the upward trend was weakened due to the timely profit-taking of long speculative funds for some reason, and the downward trend was also weakened due to the timely profit-covering of short speculative funds.
Relatively speaking, whether the upward or downward trend can be sustained requires the analysis of the comparative results of the strength of the closing of speculative funds on both sides. In an upward trend, if the willingness of longs to sell out is weaker than the willingness of shorts to cover, the upward trend will continue, otherwise the upward trend will weaken; in a downward trend, if the willingness of longs to sell out is stronger than the willingness of shorts to cover, the downward trend will continue, otherwise the downward trend will weaken.
Analysis of the relationship between trading volume and holdings
In the technical analysis of futures, the coordination of trading volume and open interest is very important. Correctly understanding the relationship between the changes in trading volume and open interest can more accurately grasp the combination of graphic K-line analysis, which is conducive to a deeper understanding of market language. There are four dynamic situations in which trading volume and open interest are coordinated.
The transaction volume increases gradually, and the position volume also increases synchronously. This situation is most common in the contract trend, and it often occurs at the beginning of a unilateral market, when the price trend is in turmoil. The serious differences between the long and short sides on the future market have led to a competition of funds in the market, but the price has not yet formed a unified consolidation range. The price fluctuations are fast and frequent, giving short-term investors enough room for profit.
At this time, the expansion of trading volume is due to the active inflow and outflow of short-term funds, while the expansion of positions shows the accumulation of long and short energy. In this case, the changes in the strength of long and short forces can be felt from the market, and the direction of market changes can be judged by combining the previous market trends. Generally, the trend will continue.
The trading volume gradually decreases, while the position gradually increases. This situation is often a precursor to the arrival of a big market. At this time, the combined effect of the strength of both long and short sides and external market factors makes the market reach a balance in the dynamics.
The decrease in transactions is due to the gradual balance of the price fluctuation range, which makes short-term funds unprofitable, but the increase in positions means that the differences in views between bulls and bears are increasing, and the confrontation between funds is gradually escalating.
Since the outcome of the disagreement is not clear, both bulls and bears are unwilling to make concessions and are increasing their positions. No side breaks the deadlock first and trading volume gradually decreases, waiting for the final breakthrough. In this situation, the subsequent trend is very fierce, and there are rarely false breakthroughs. Once an outbreak occurs, at least a mid-level market should appear.
The trading volume gradually increases, and the position gradually decreases. This situation usually occurs during a period of market relay, and is accompanied by the phenomenon of longs killing longs and shorts killing shorts. Because the market is favorable to one of the longs and shorts, the opposite party flees and the position gradually decreases.
However, the rapid movement of prices provides a good opportunity for short-term speculation, so short-term funds actively intervene, and transactions do not decrease. Sometimes the increase in short-term positions masks the exit of long-term funds, resulting in a less obvious trend of decreasing positions. In this case, there may be a mid-term rebound, which often gives people a sense of turning due to the sharp rebound, but the trend will continue.
The trading volume gradually decreases, and the position gradually decreases. This situation often occurs when a wave of market trends gradually ends. The simultaneous shrinkage of trading volume and position proves that both the long and short parties or one of them has lost confidence in the future market and funds are gradually withdrawing.
If this situation continues to develop, it will provide favorable conditions for new funds to intervene and become a precursor to a change in the market. Since the trading volume and position are relatively small, the market is easily affected by external factors, and the price fluctuations are very arbitrary, which will cause unnecessary losses to investors.
From the above situation, we can see that: trading volume is the basic driving force for the development of the market. When trading volume increases, price changes tend to be active, and when trading volume decreases, price changes tend to be moderate; position size is the internal driving force for the development of the market. Increasing positions is the beginning of a market, and reducing positions is the end of a market.
In order to better apply this analysis method, the following points should be noted:
This analysis is applicable to the analysis of a single product. In a single product, the combined change pattern of trading volume and open interest can be clearly seen, but it is not applicable to the spread chart made using multiple contract products.
Contracts entering delivery. When entering the delivery period, due to the closer connection between the trading varieties and the spot prices, coupled with the constraints of relevant systems, the delivery contract varieties will undergo some extreme changes that cannot be explained by the relationship between trading volume and open interest.
Although the above situations will limit the analysis methods of trading volume and position volume to a certain extent, after accurately understanding the basic analysis principles, investors can create new analysis methods based on actual conditions to interpret market language.
Conclusion
The analysis of trading volume and holding volume is only one of the main aspects of technical analysis. The pattern analysis and wave theory in technical analysis are also very important. Technical analysis generally only has practical significance for analyzing the short-term trend of prices. To analyze the long-term trend of prices, fundamental analysis should be the main factor and technical analysis should be the auxiliary factor. In addition, in an immature market, the main force often uses the trend against technology to induce investors to make wrong judgments and actions. Super market conditions are basically against the trend of technology. Investors should also pay enough attention to this.