
Just short positions dear


Post

ProfessorAJ_
·
--
Bullish$OM
🔥 OM/USDT – Honest Opinion 🔥
This chart is parabolic 📈, but let’s break it down objectively:
---
📊 Key Observations:
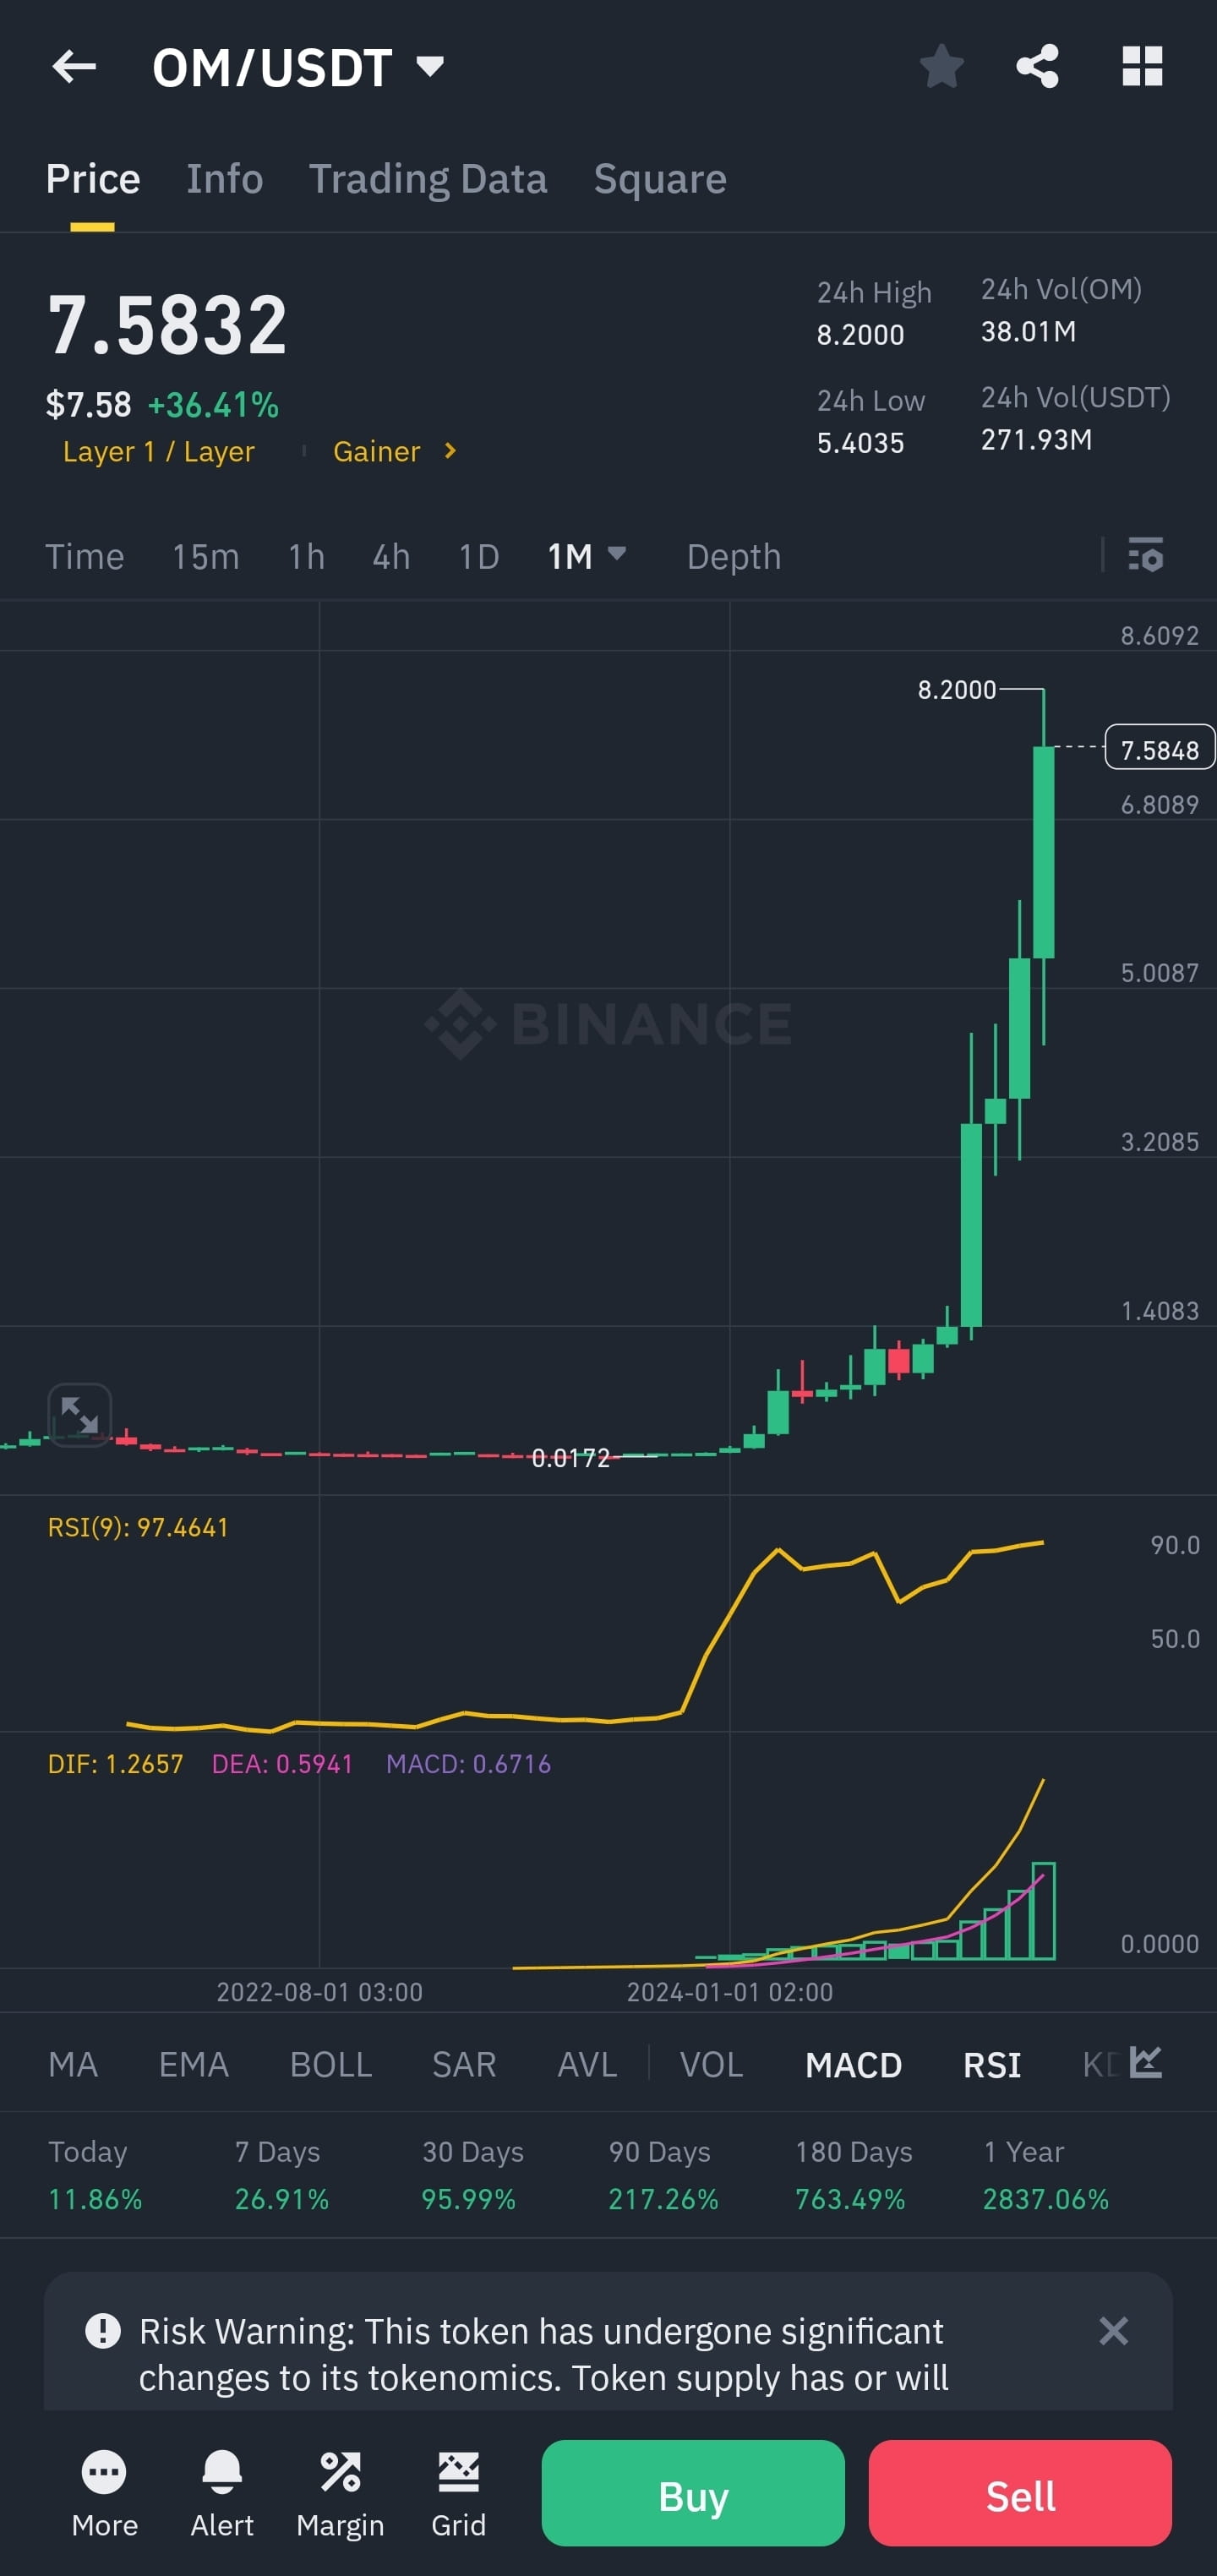
✔ Massive Monthly Pump: Price has surged from $0.0172 to $8.20, a mind-blowing 47,500% increase in less than a year! 🚀
✔ RSI at 97.46: This is extreme overbought territory, meaning a retracement is highly likely. 📉
✔ MACD Still Bullish: Momentum is strong, but too steep. This could indicate bubble-like behavior.
---
⚠️ Potential Dangers:
🔹 Parabolic moves rarely last forever – what goes up, comes down. Expect a correction soon.
🔹 Tokenomics Warning: Binance has highlighted significant changes in supply. This could mean inflation risk, which might dump the price hard later.
🔹 No Healthy Pullbacks: A healthy bull run has corrections along the way. This one skyrocketed non-stop, making it fragile.
---
📌 Honest Take:
🔸 If you’re already in, consider taking profits at key levels.
🔸 If you’re thinking of buying, wait for a healthy retracement instead of FOMO-ing in.
🔸 If you're shorting, be careful – strong momentum can still push it higher before the crash.
🚨 Conclusion: This is looking like a classic blow-off top. The risk is very high. Either lock in profits or wait for a proper correction before re-entering.
What’s your plan? Buying, selling, or waiting? 👇
🔥 OM/USDT – Honest Opinion 🔥
This chart is parabolic 📈, but let’s break it down objectively:
---
📊 Key Observations:
✔ Massive Monthly Pump: Price has surged from $0.0172 to $8.20, a mind-blowing 47,500% increase in less than a year! 🚀
✔ RSI at 97.46: This is extreme overbought territory, meaning a retracement is highly likely. 📉
✔ MACD Still Bullish: Momentum is strong, but too steep. This could indicate bubble-like behavior.
---
⚠️ Potential Dangers:
🔹 Parabolic moves rarely last forever – what goes up, comes down. Expect a correction soon.
🔹 Tokenomics Warning: Binance has highlighted significant changes in supply. This could mean inflation risk, which might dump the price hard later.
🔹 No Healthy Pullbacks: A healthy bull run has corrections along the way. This one skyrocketed non-stop, making it fragile.
---
📌 Honest Take:
🔸 If you’re already in, consider taking profits at key levels.
🔸 If you’re thinking of buying, wait for a healthy retracement instead of FOMO-ing in.
🔸 If you're shorting, be careful – strong momentum can still push it higher before the crash.
🚨 Conclusion: This is looking like a classic blow-off top. The risk is very high. Either lock in profits or wait for a proper correction before re-entering.
What’s your plan? Buying, selling, or waiting? 👇
Disclaimer: Includes third-party opinions. No advice. Binance AI may be used without guarantee. See T&Cs.