

COIN NAME : #SOL/USDT📉
SIGNAL TYPE : SHORT
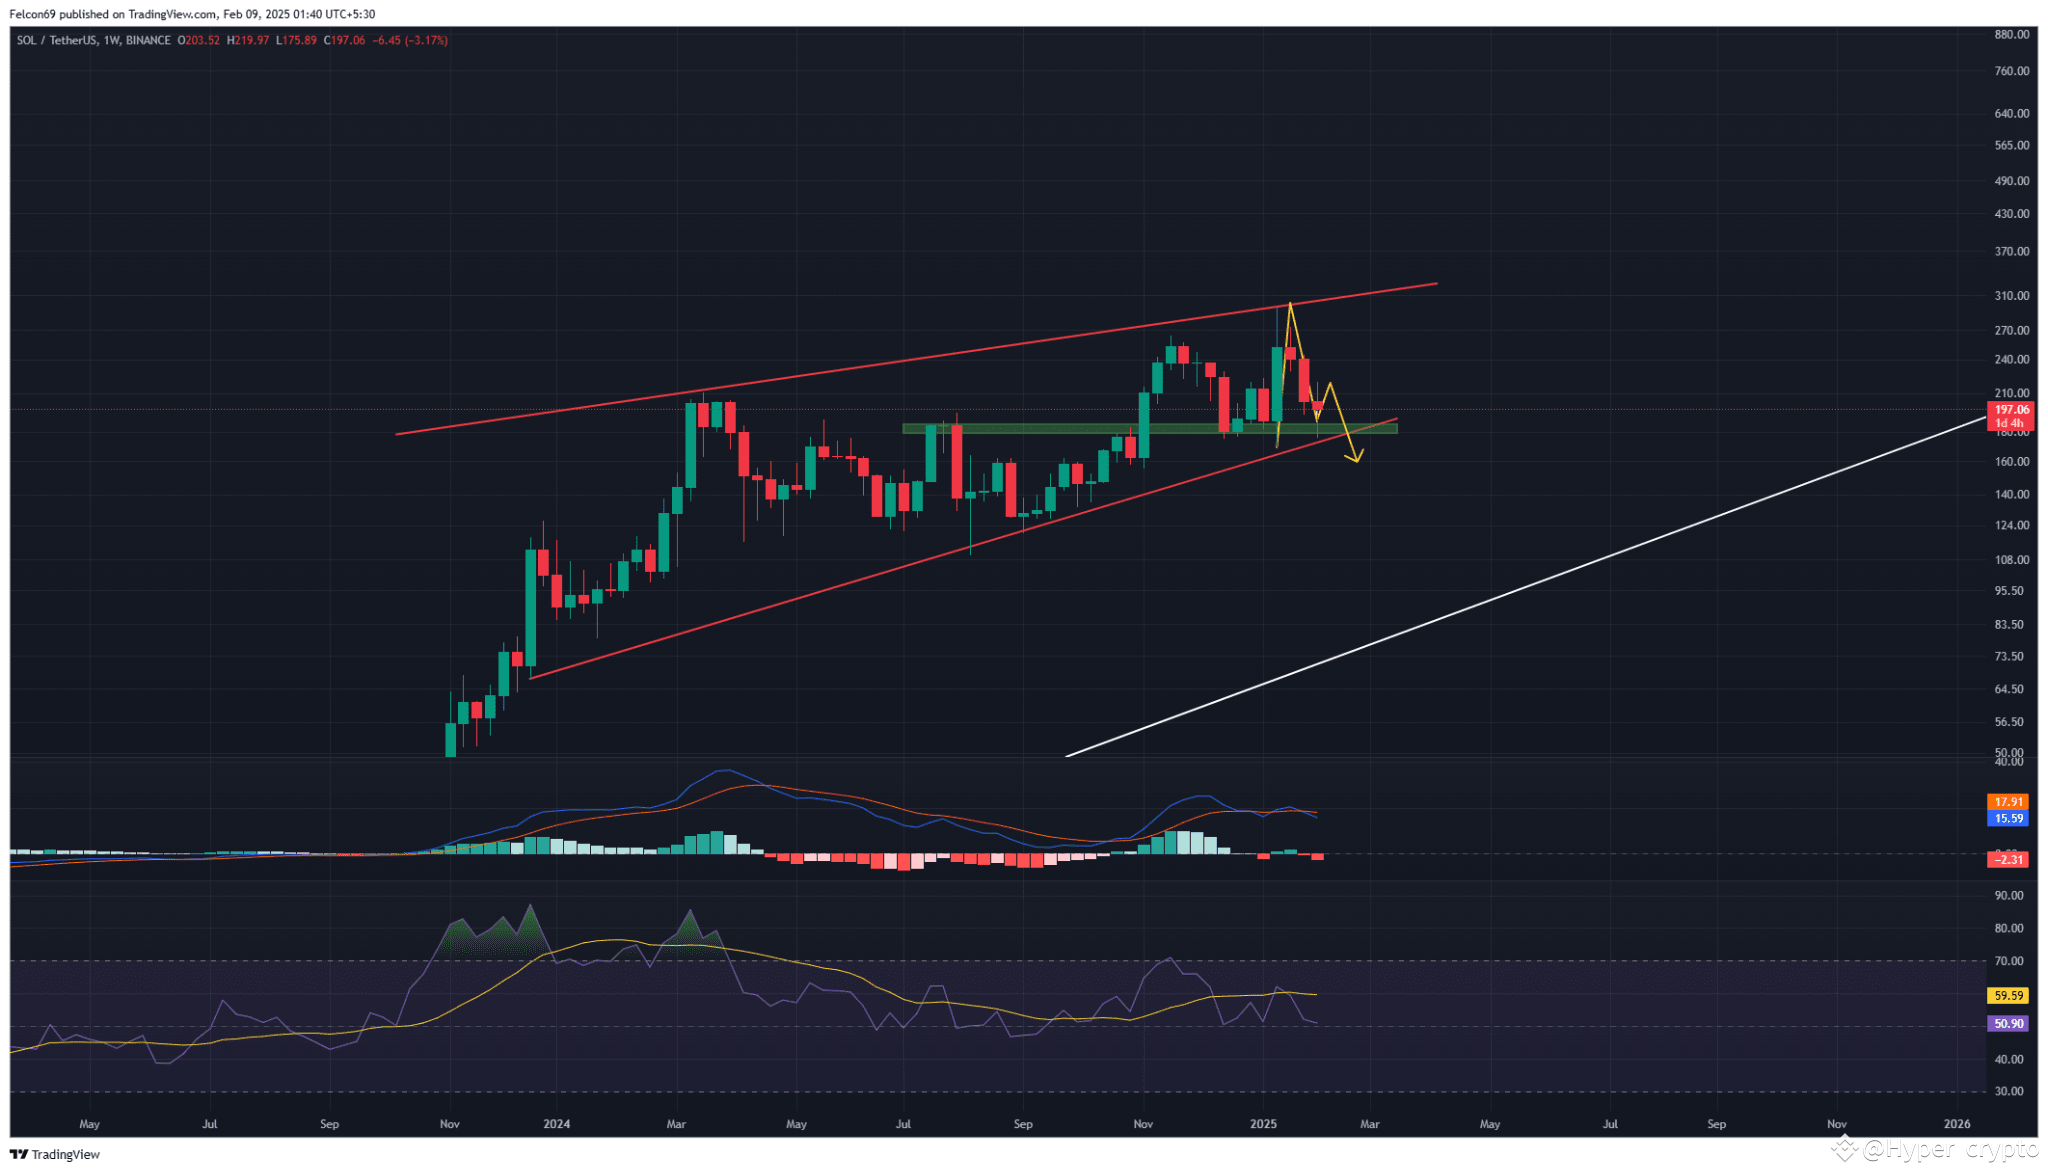
I can see weekly chart shows SOL in a rising wedge pattern, which is typically bearish. The price recently rejected the upper trendline and is now testing a key support zone 🟩. Rising Wedge Breakdown 🔻: Price is testing support, a breakdown could lead to further downside. MACD & RSI: Bearish momentum with RSI declining, confirming weakness. Support Zone: Around $190-$200, failure to hold this could lead to more declines
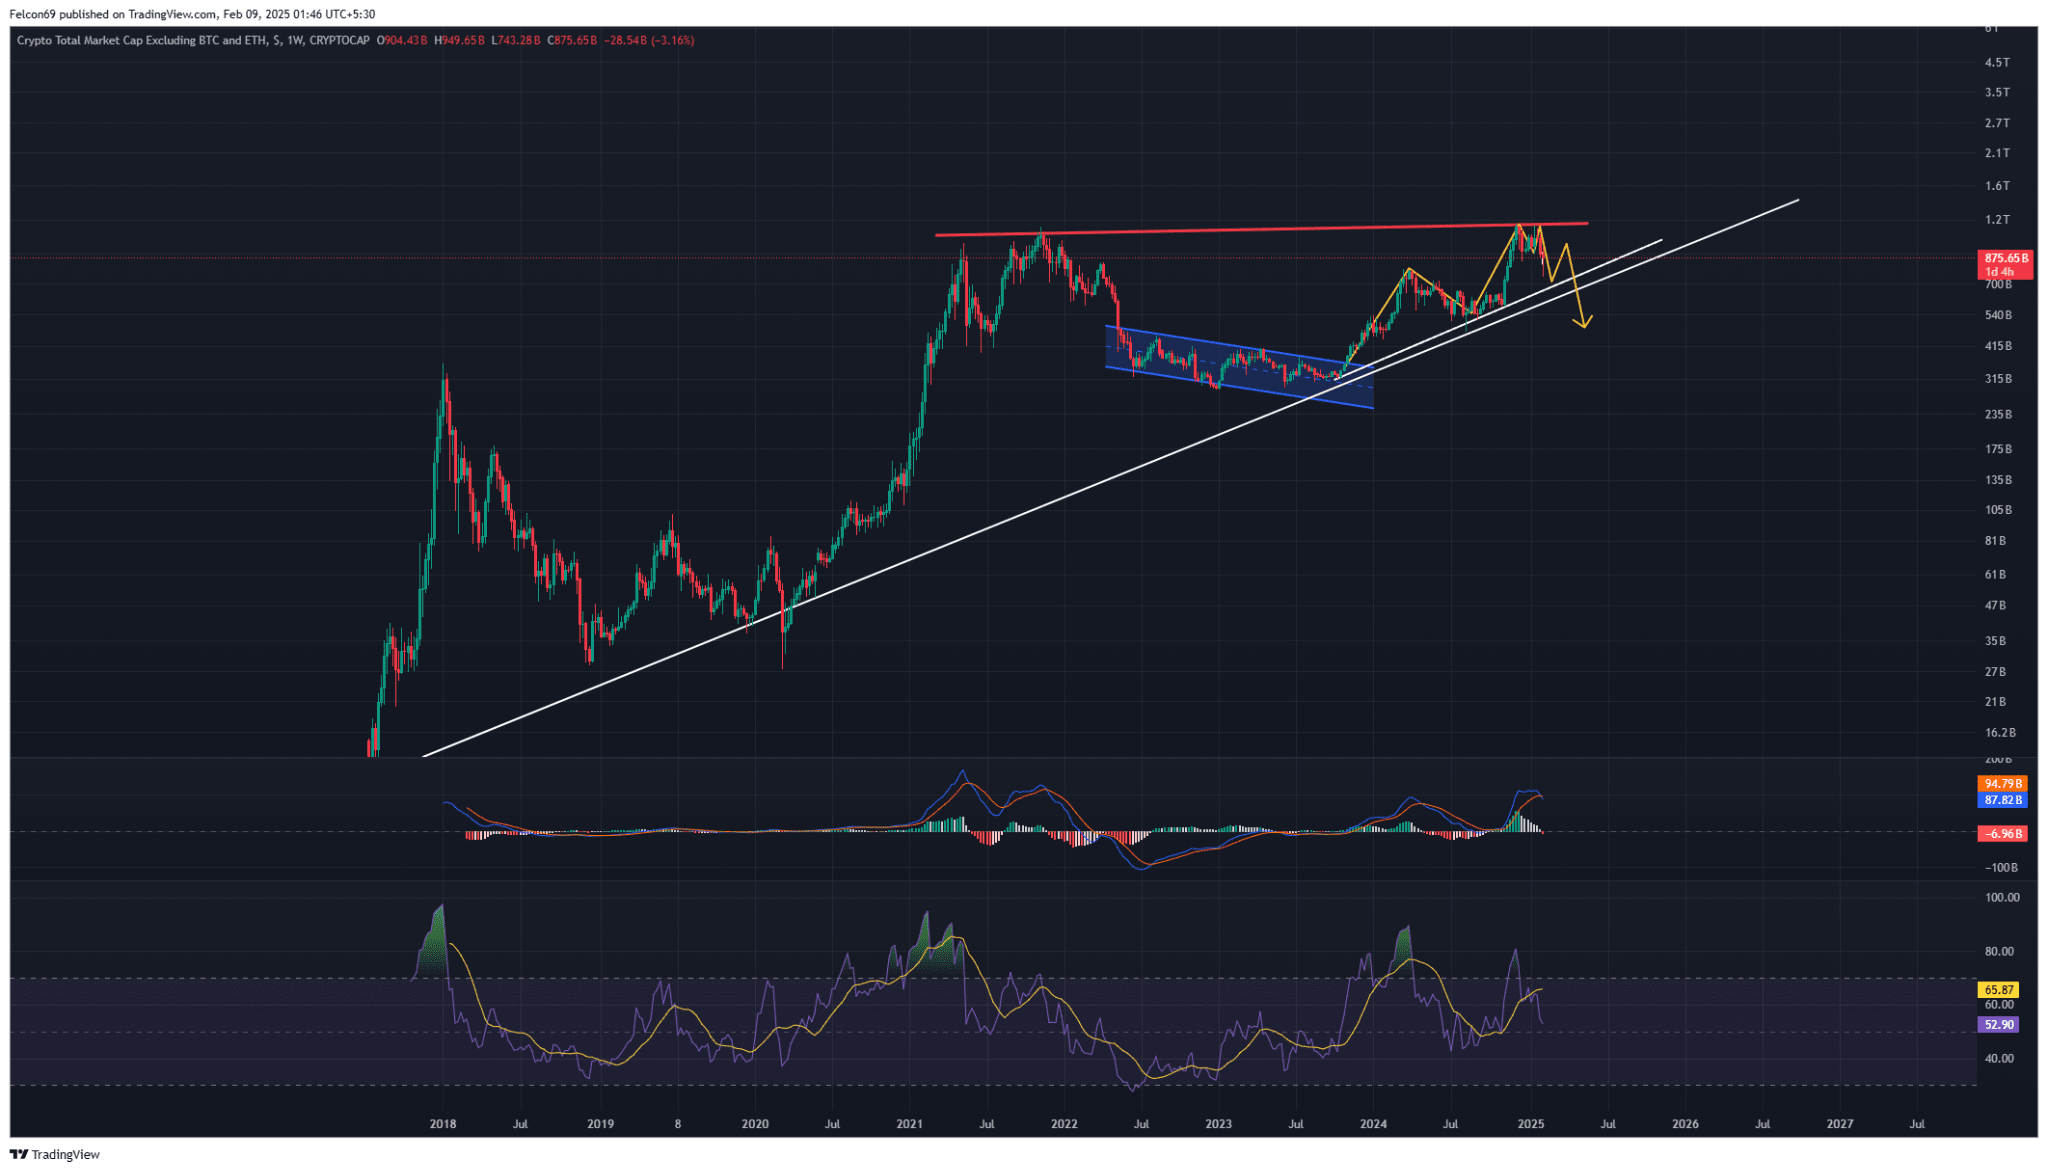
I can see on this cart ToTAL3 indicates a potential double-top rejection at major resistance 🔴, hinting at a possible downturn. The market previously broke out from a bullish flag pattern (🔵), leading to a strong rally, but now faces a critical trendline test ⚠️. Rejection at Resistance 🔻: Price failed to break above the previous all-time high, signaling weakness.Rising Trendline Support 📈: If broken, further downside could follow. MACD & RSI: Bearish divergence seen, indicating potential sell-off pressure.
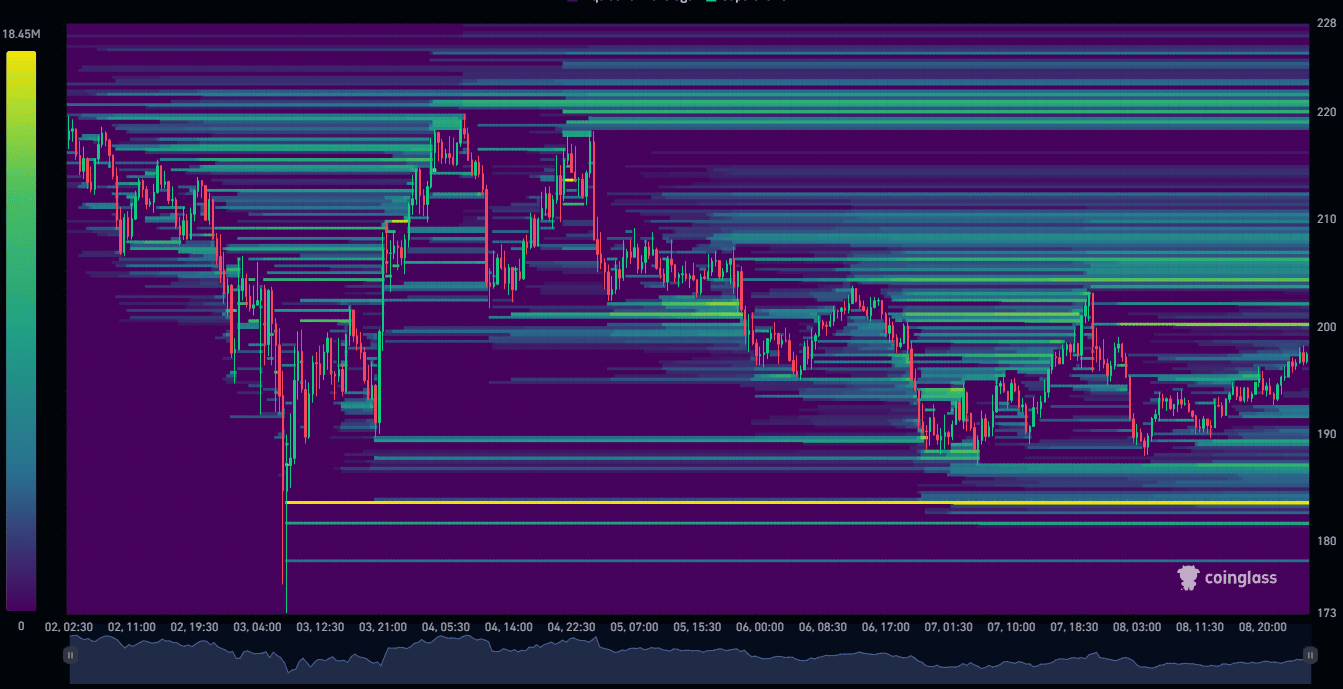
liquidation heatmap shows areas where large leveraged positions are getting liquidated, impacting price movement. Heavy liquidations (yellow zones) near $180-$185, indicating strong support 🚀. Major liquidity pools around $200-$210, which could act as a resistance zone. Price has been bouncing between these levels, indicating a range-bound market 🔄. The market may push towards liquidity pockets, triggering further liquidations.
Entry Price: 200 or Market Price
1st TP 🎯 at $ 196.46
2nd TP 🚀 at $ 193.82
3rd TP 🌟 at $ 185

Important 👇
Click on my profile picture to join my live stream , for 2-3 free signal.
join my binance live.
Just click on my profile to join my live.