

#BERAonBinance #USJoblessClaimsRise
Is XRP Under $3 an Opportunity or the End of the Rally? Analysts Comment
Some analysts are expecting a possible drop to $1.60, but Korean traders' accumulations and bullish wave expectations point to a long-term target of $18.
It took XRP six years to recover $3, the psychological level it last reached during the crypto bull run in 2017. However, macroeconomic shocks led by US President Donald Trump’s trade war sent XRP back below that level earlier this week.
Ripple currency
$2.33
As of February 6, XRP was trading at around $2.40, down about 30% from its record high of $3.40 hit three weeks ago.
However, the Ripple-related token is still up about 400% from its local low of around $0.50 in November 2024.
XRP/USD price chart over the past 2 weeks. Source: TradingView
In other words, XRP is consolidating after a sharp rally as traders wait for more evidence to confirm their next bias in the market.
This has sparked further discussions across the crypto community about whether XRP’s sideways moves represent the end of its current run or a golden buying opportunity.
Will XRP price drop another 30-45%?
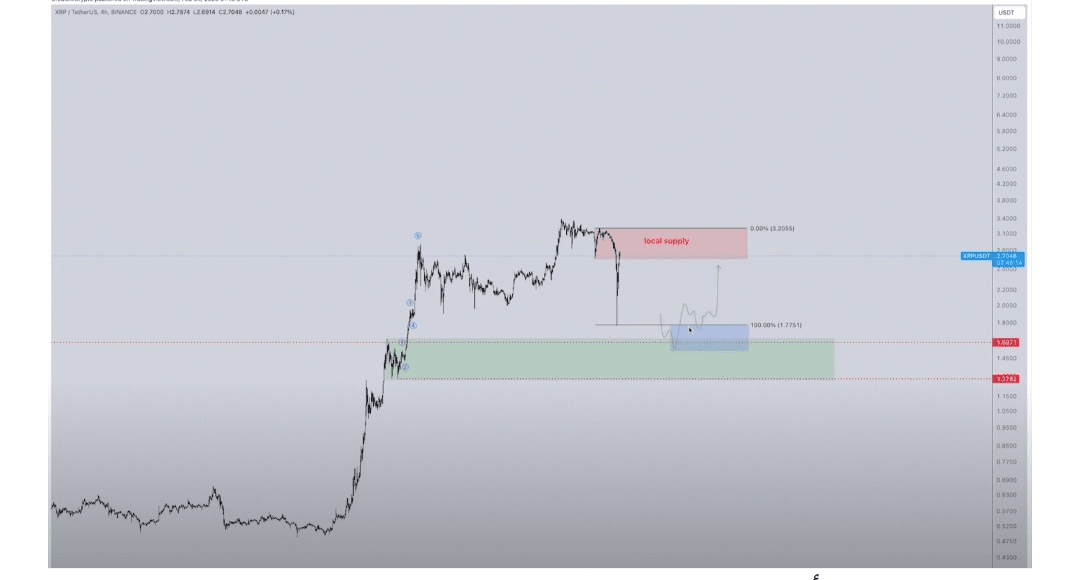
XRP price could drop another 30-45% in the coming weeks, according to popular market analyst Credibull Crypto.
In his latest analysis, he said that the price of XRP could fall towards its “local lows” defined by the $1.60-1.30 area, highlighted in green in the chart below.
XRP/USD 4-hour price chart. Source: TradingView
Analyst Nishant Bhardwaj agrees with the $1.60 bearish target, noting that XRP must hold above the $2.50 support level to ensure that its upward momentum is maintained.
Bhardwaj wrote in a post X:
“A strong bounce from sub-$2 levels suggests demand, but downside pressures persist. Watch the $2.50 level. A breakdown could test the $2.00 and $1.61 support levels.”
Related: XRP Bearish Divergence Increases Chance of $2 Retest — Here’s What Bulls Should Do
Interestingly, an analysis of the additional trading volume profile of the $1.60-1.30 area shows its importance as a high volume area with significant trading activity in recent months.
In particular, the $1.60 level is just 20 cents below the 200-day EMA (200-day EMA; blue wave) support.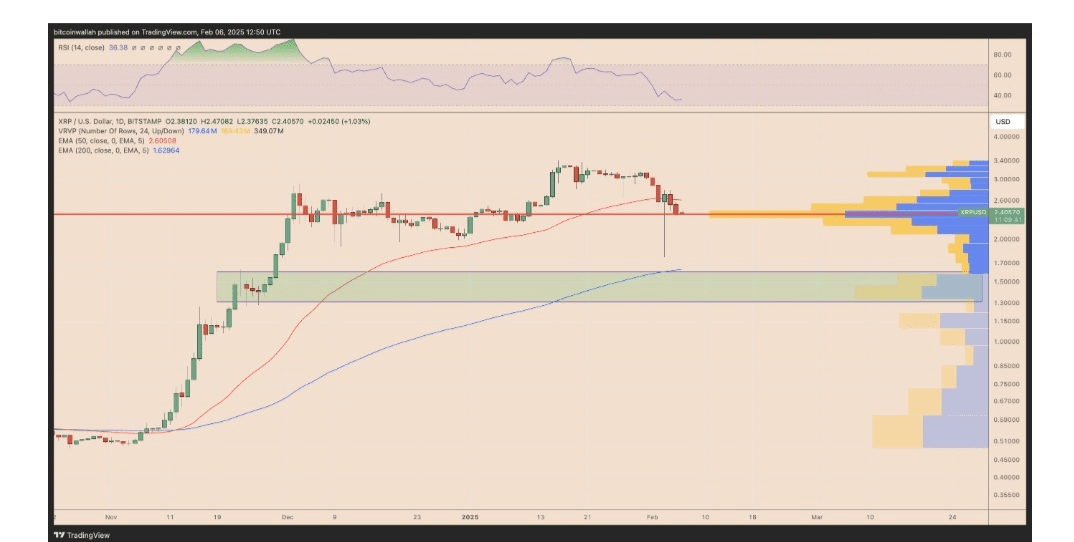
Daily XRP/USD price chart. Source: TradingView
Overall, the $1.60-1.30 area is likely to act as a strong demand zone, with buyers likely to step in.
XRP Whales, South Korean Traders Buy XRP Dip
Recent market activity highlights the importance of monitoring South Korean traders, who traditionally serve as a strong indicator of retail sentiment and speculative trading trends in the cryptocurrency market.
As shown in the Cumulative Volume Delta (CVD) charts prepared by analyst LTRD, Upbit traders have been buying Bitcoin and XRP aggressively while simultaneously selling Ether during the recent market correction. The Cumulative Volume Delta (CVD) represents the net sum of long positions.
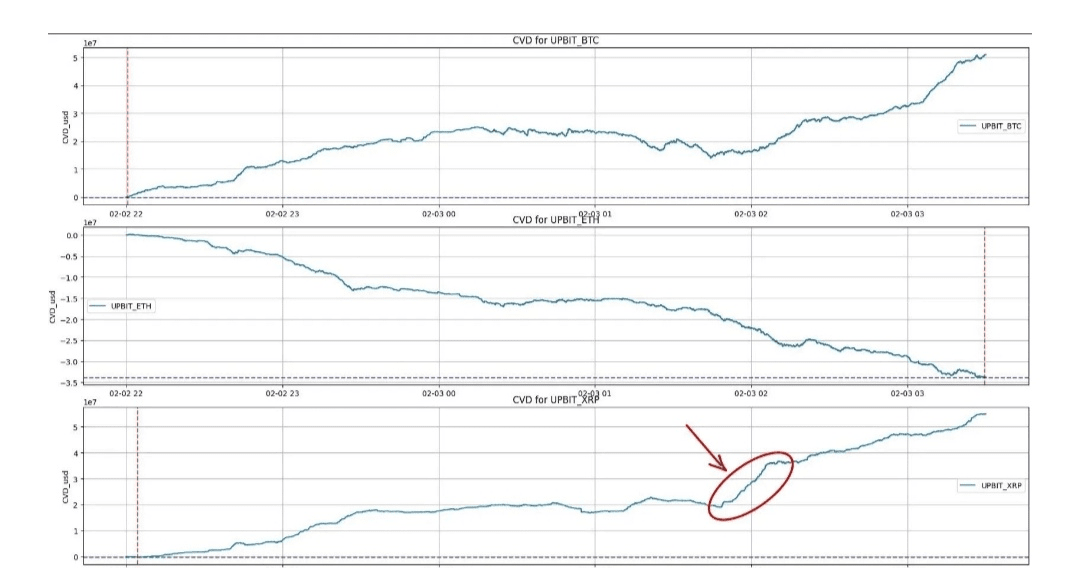
CVD chart of XRP on Upbit. Source: LTRD
The behavior points to a strategic capital rotation as South Korean investors sought safety in BTC and XRP.
What stands out in particular is the continued accumulation of Ripple, especially in contrast to the ongoing selling pressure on Ethereum. More importantly, Bybit traders have reversed this trend, with Ripple buying increasing throughout the decline.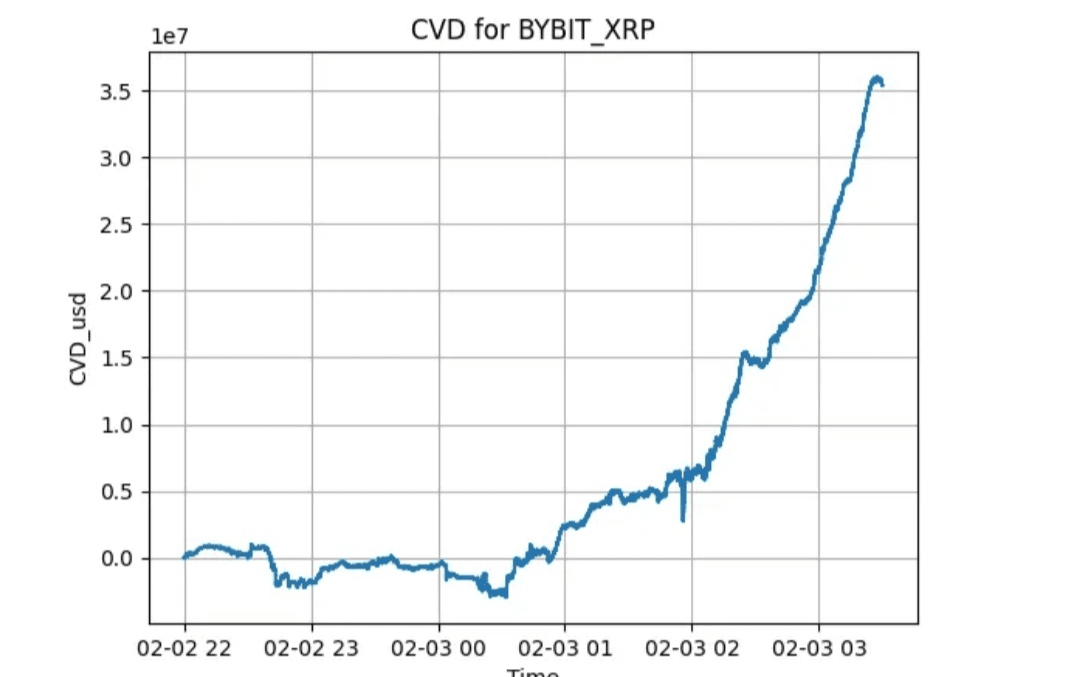
CVD chart of XRP on Bybit. Source: LTRD
Meanwhile, XRP whales, especially those holding more than 1 million tokens, have also accumulated during the current price drop, according to data from Messari.
XRP, Markets, Donald Trump, Price Analysis, Technology Analysis, Market Analysis, Altcoin Watch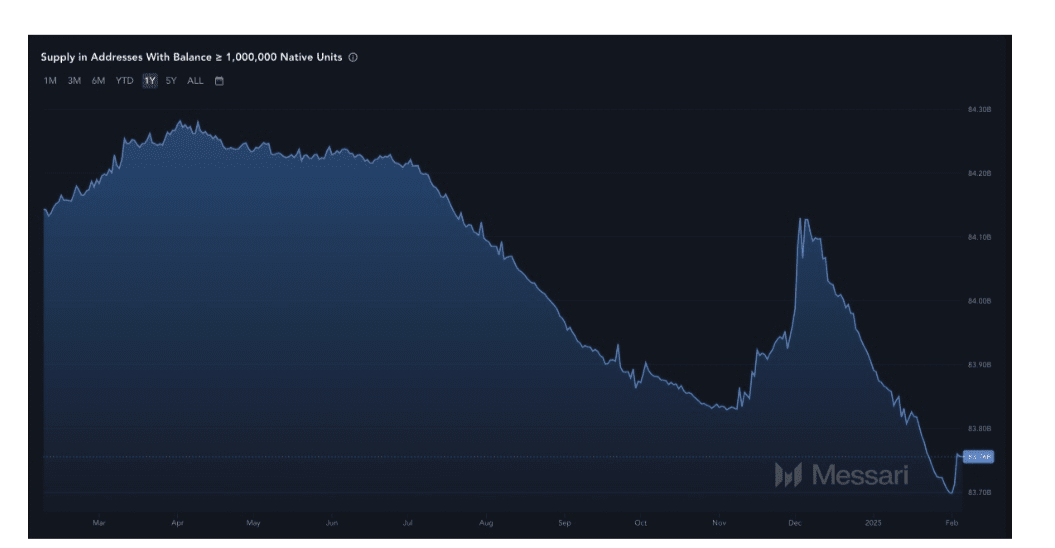
XRP supply to addresses with at least 1 million tokens. Source: TradingView
This buildup across exchanges suggests that some market participants treated the sell-off as a major buying opportunity, reinforcing the thesis that XRP remains a high-conviction asset among select investor segments.
Meanwhile, crypto analyst Dark Defender expects XRP to reach $5.85 in the near term and $18.22 in the long term based on Elliott Wave theory. XForceGlobal also sees XRP in its fourth wave on the daily chart, and expects a final push towards $5-10.