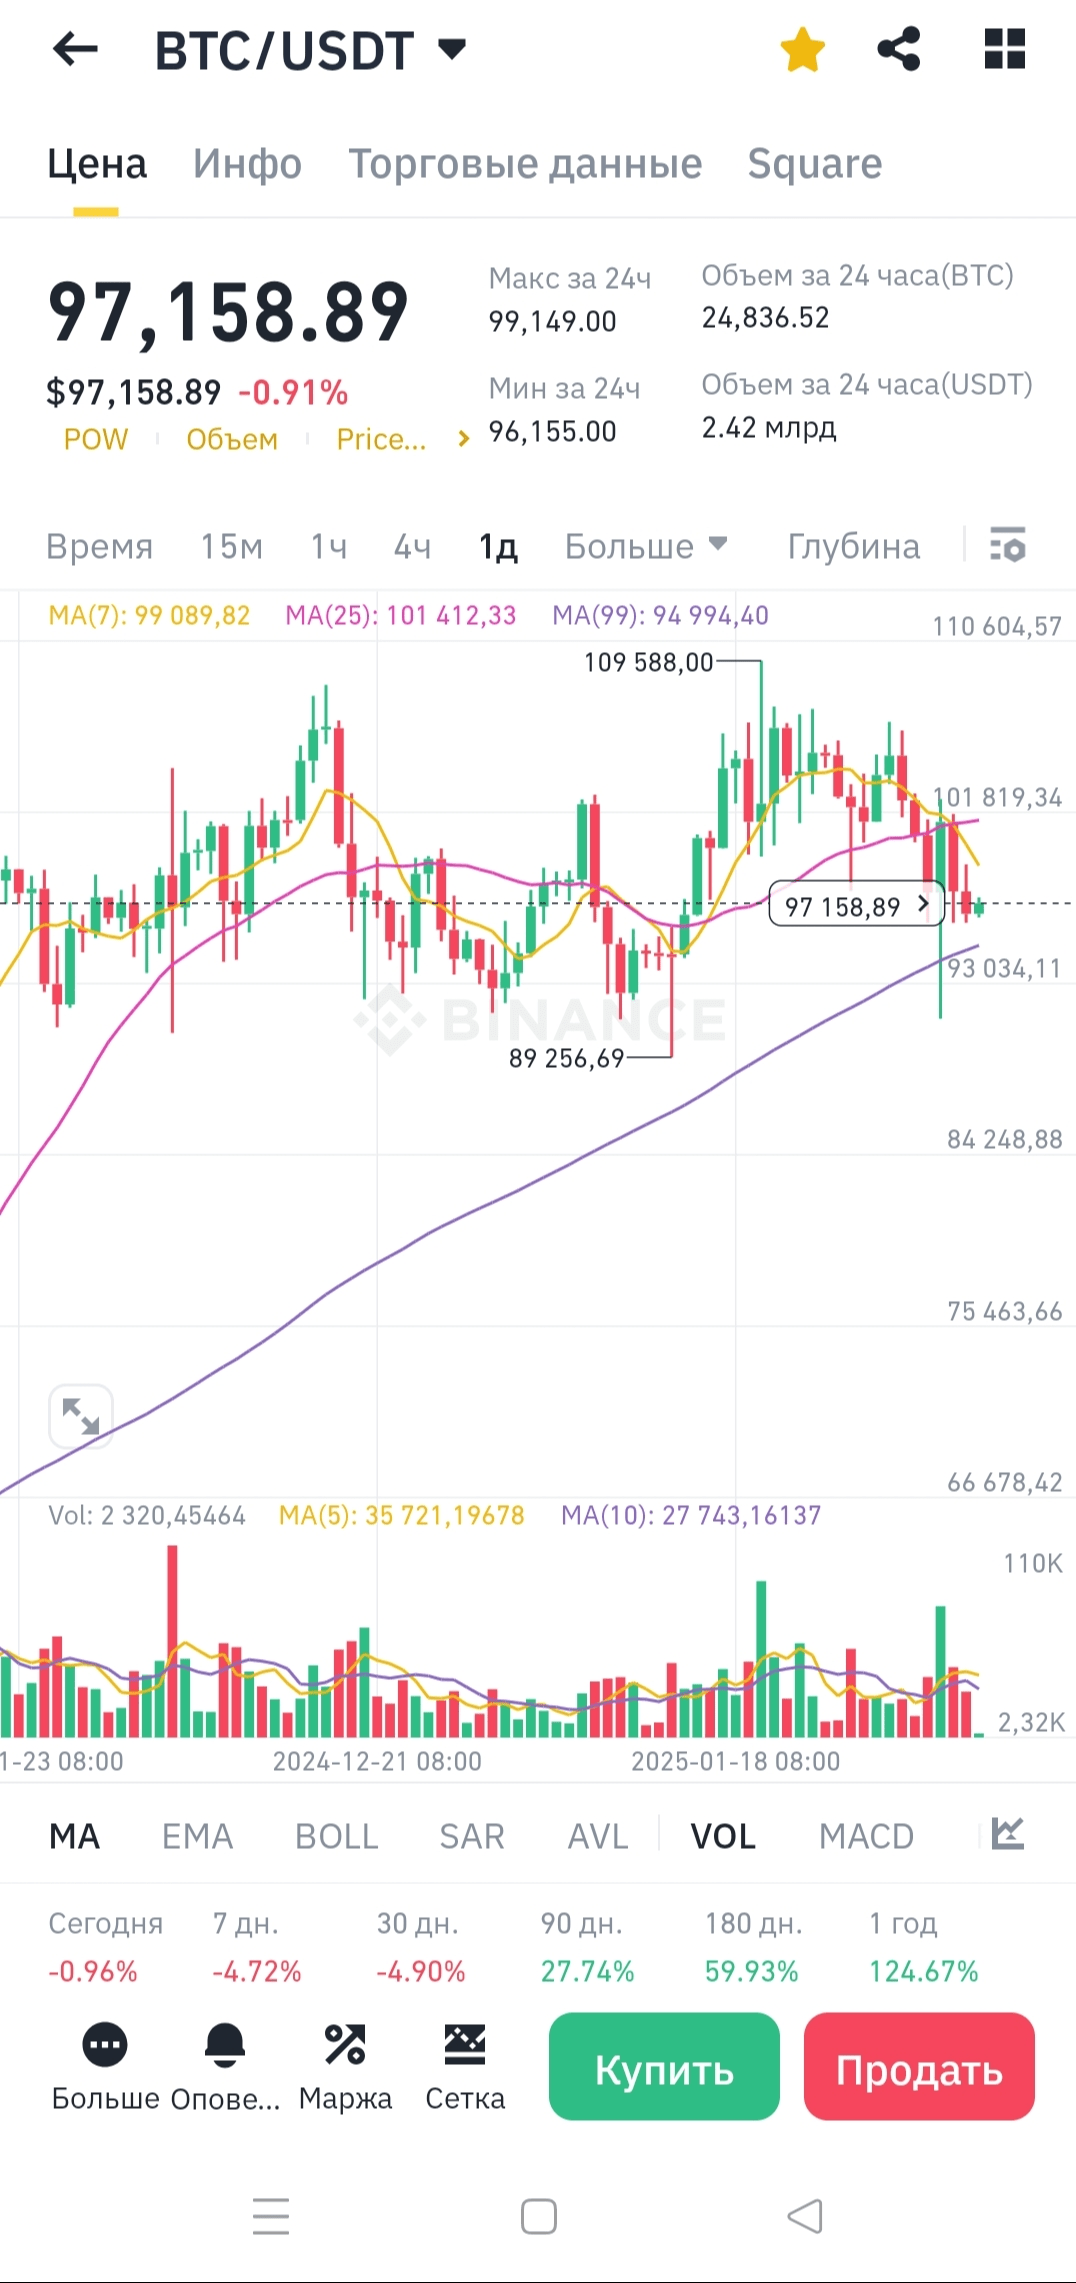
This chart shows the price dynamics of Bitcoin (BTC) to USDT on the Binance exchange with moving average (MA) indicators and trading volumes.
Main analysis:
Current price: $97,158.89
A decline of -0.91% for the day.
Maximum in 24 hours: $99,149.00
Minimum in 24 hours: $96,155.00
Moving Averages (MA):
MA(7): $99,089.82 (Short-term)
MA(25): $101,412.33 (Medium-term)
MA(99): $94,994.40 (Long-term)
The price is below MA(7) and MA(25), but above MA(99) — a sign of a local bearish trend.
Trading volumes
Daily volume: 24,836 BTC (~2.42 billion USDT)
Volumes remain significant but not at maximum levels.
Trend
The price tested the level of $101,819.34 but pulled back.
Support: $93,034.11 and $89,256.69
Resistance: $101,819.34
Forecast:
Short-term (1-7 days): A slight pullback to the range of $95,000 - $96,500 is possible, but if volumes increase, a breakout above $99,000 may occur.
Medium-term (30-90 days): If the price holds above $94,994 (MA 99), growth to $105,000 is possible.
Long-term (180 days - 1 year): The global bullish trend remains (+124.67% for the year), but corrections are inevitable.
If you are a trader – watch the reaction to the level of $96,155. If the price breaks down, expect $93,000 - $89,000.
If you are an investor – long-term BTC remains in an uptrend, current corrections may be an opportunity to buy.
What do you think, will the market go up or down?