


We continue to analyze graphic analysis. In the previous article, I showed the reversal figure head and shoulders.
And here they are almost in perfect execution. Just admire...
1. #FLUX - Perfect shape, just like in a textbook, worked out at 90%, but Bitcoin reversed, so there is a chance to go even lower.
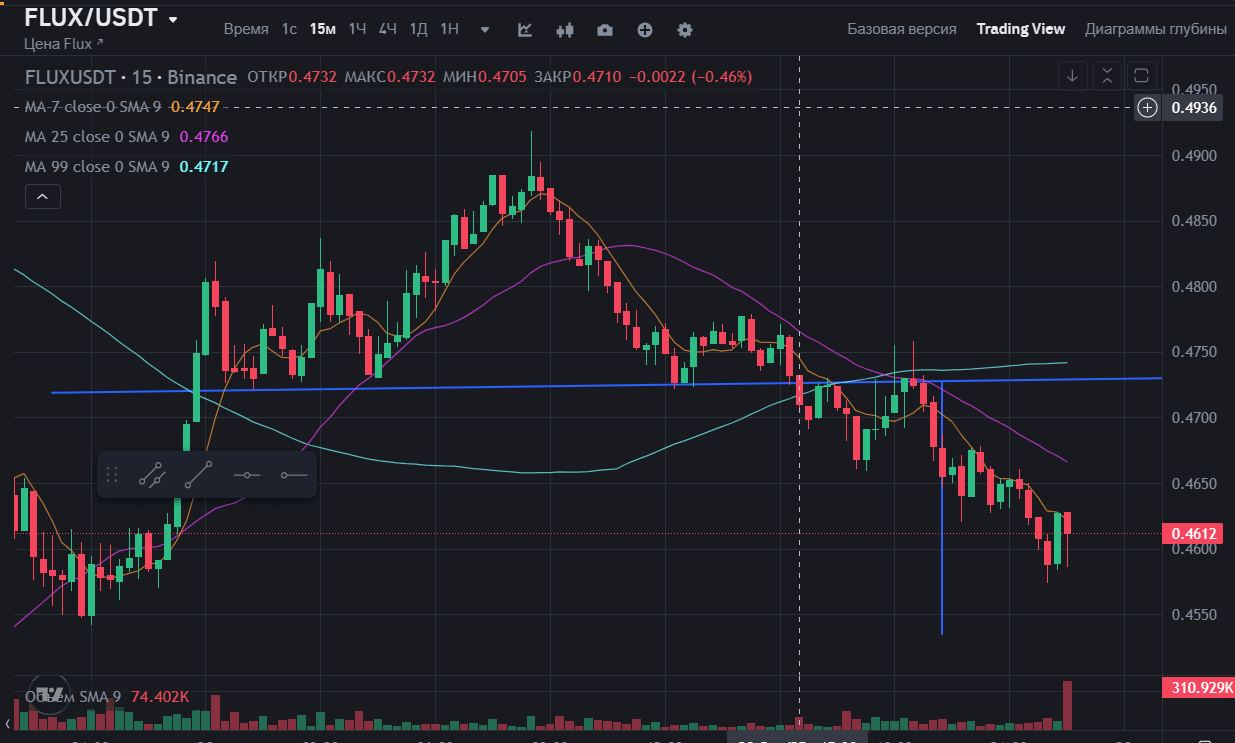
After the figure has formed, there will be a buy signal, we wait, looking for an entry point...
2. #SOL - Not ideal, but it also worked out at 110%, although who would have thought when SOL was at 240, and Bitcoin was breaking old levels and making new highs))

But as we can see, the head and shoulders first on FLUX, then on SOL, gave a good signal about the reversal of Bitcoin. Most likely regarding #BTC - these are simple manipulations, but not a reversal. Nevertheless, the figures worked out as per the book...