


COIN NAME : #ETH/USDT.
I can see on this chart shows Ethereum (ETH/USD) on the daily timeframe. The price is currently consolidating within a descending channel 🔺 after a strong prior rally, indicating a potential reversal. Key Fibonacci retracement levels provide support and resistance zones, suggesting possible reaction points.The RSI is neutral 📊, indicating consolidation. Monitor volume for confirmation of a breakout before entering the trade 🚀. A strong bounce from Fibonacci levels could trigger a bullish move. Manage risk carefully! ✅
chart represents the Crypto Total Market Cap (excluding BTC) on the 4-hour timeframe, showcasing a symmetrical triangle pattern 🔺, a neutral setup often leading to a breakout. The support zone at $1.36T-$1.38T provides a key area of demand, holding the market steady.
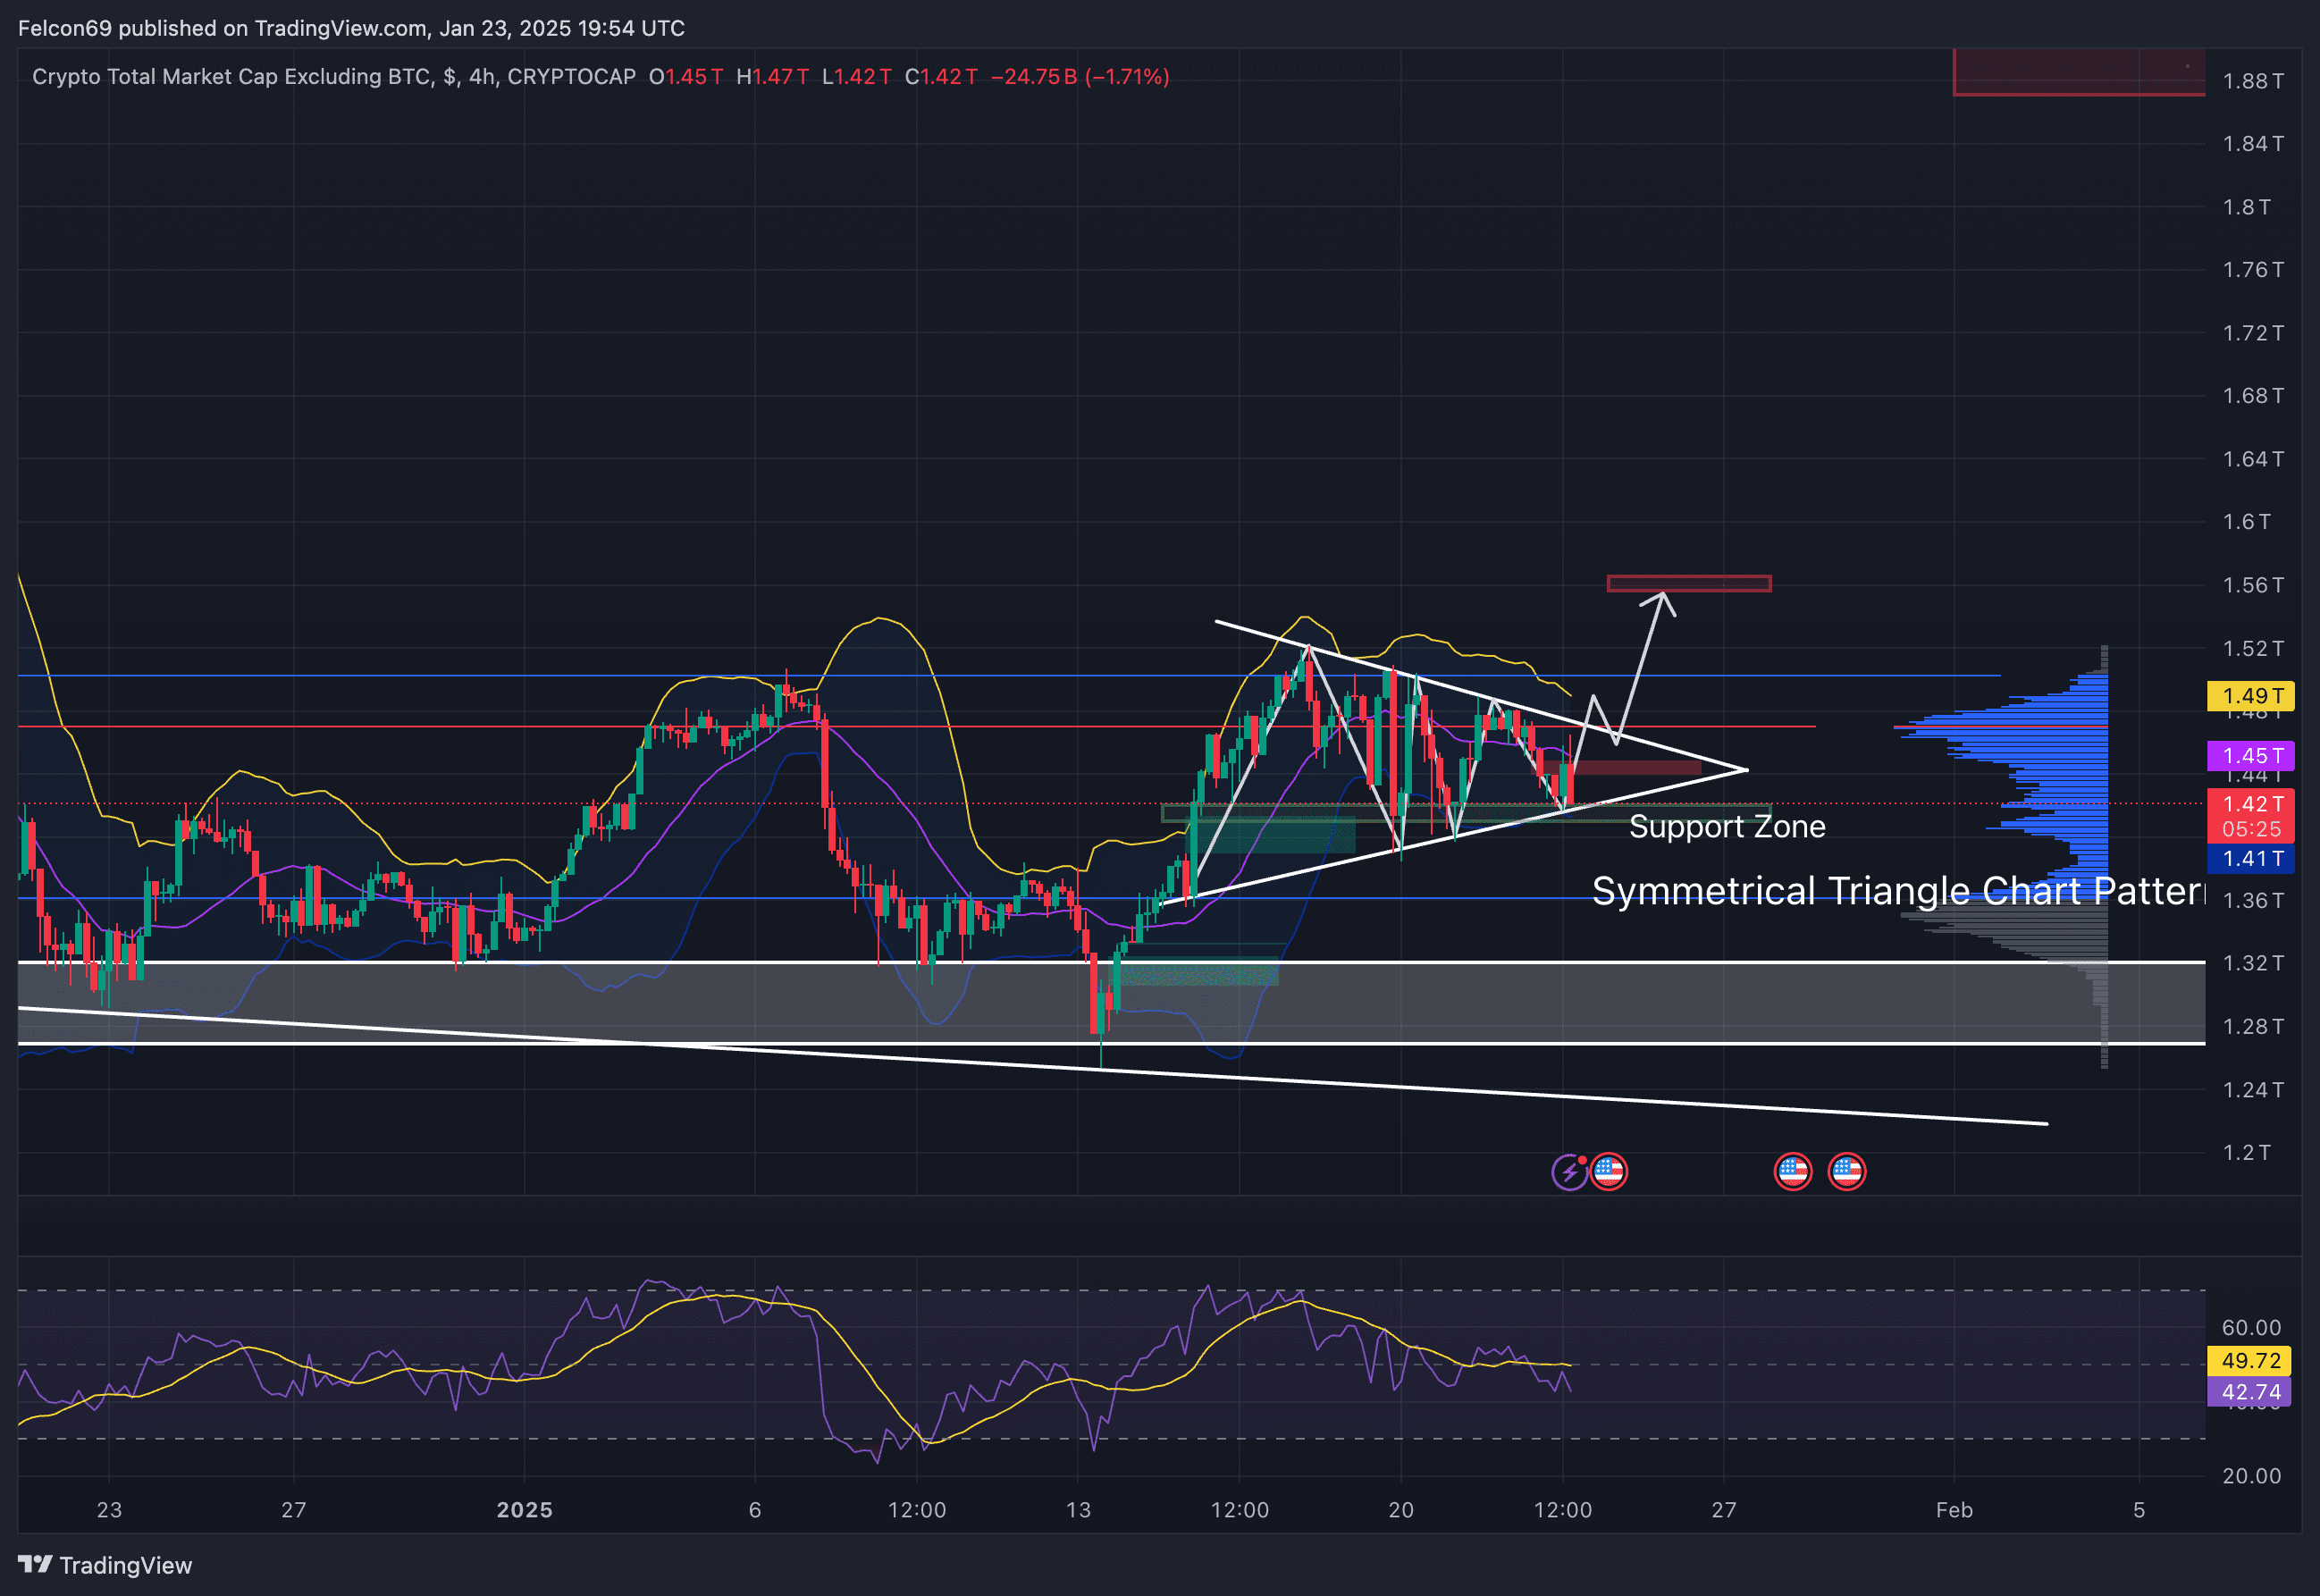
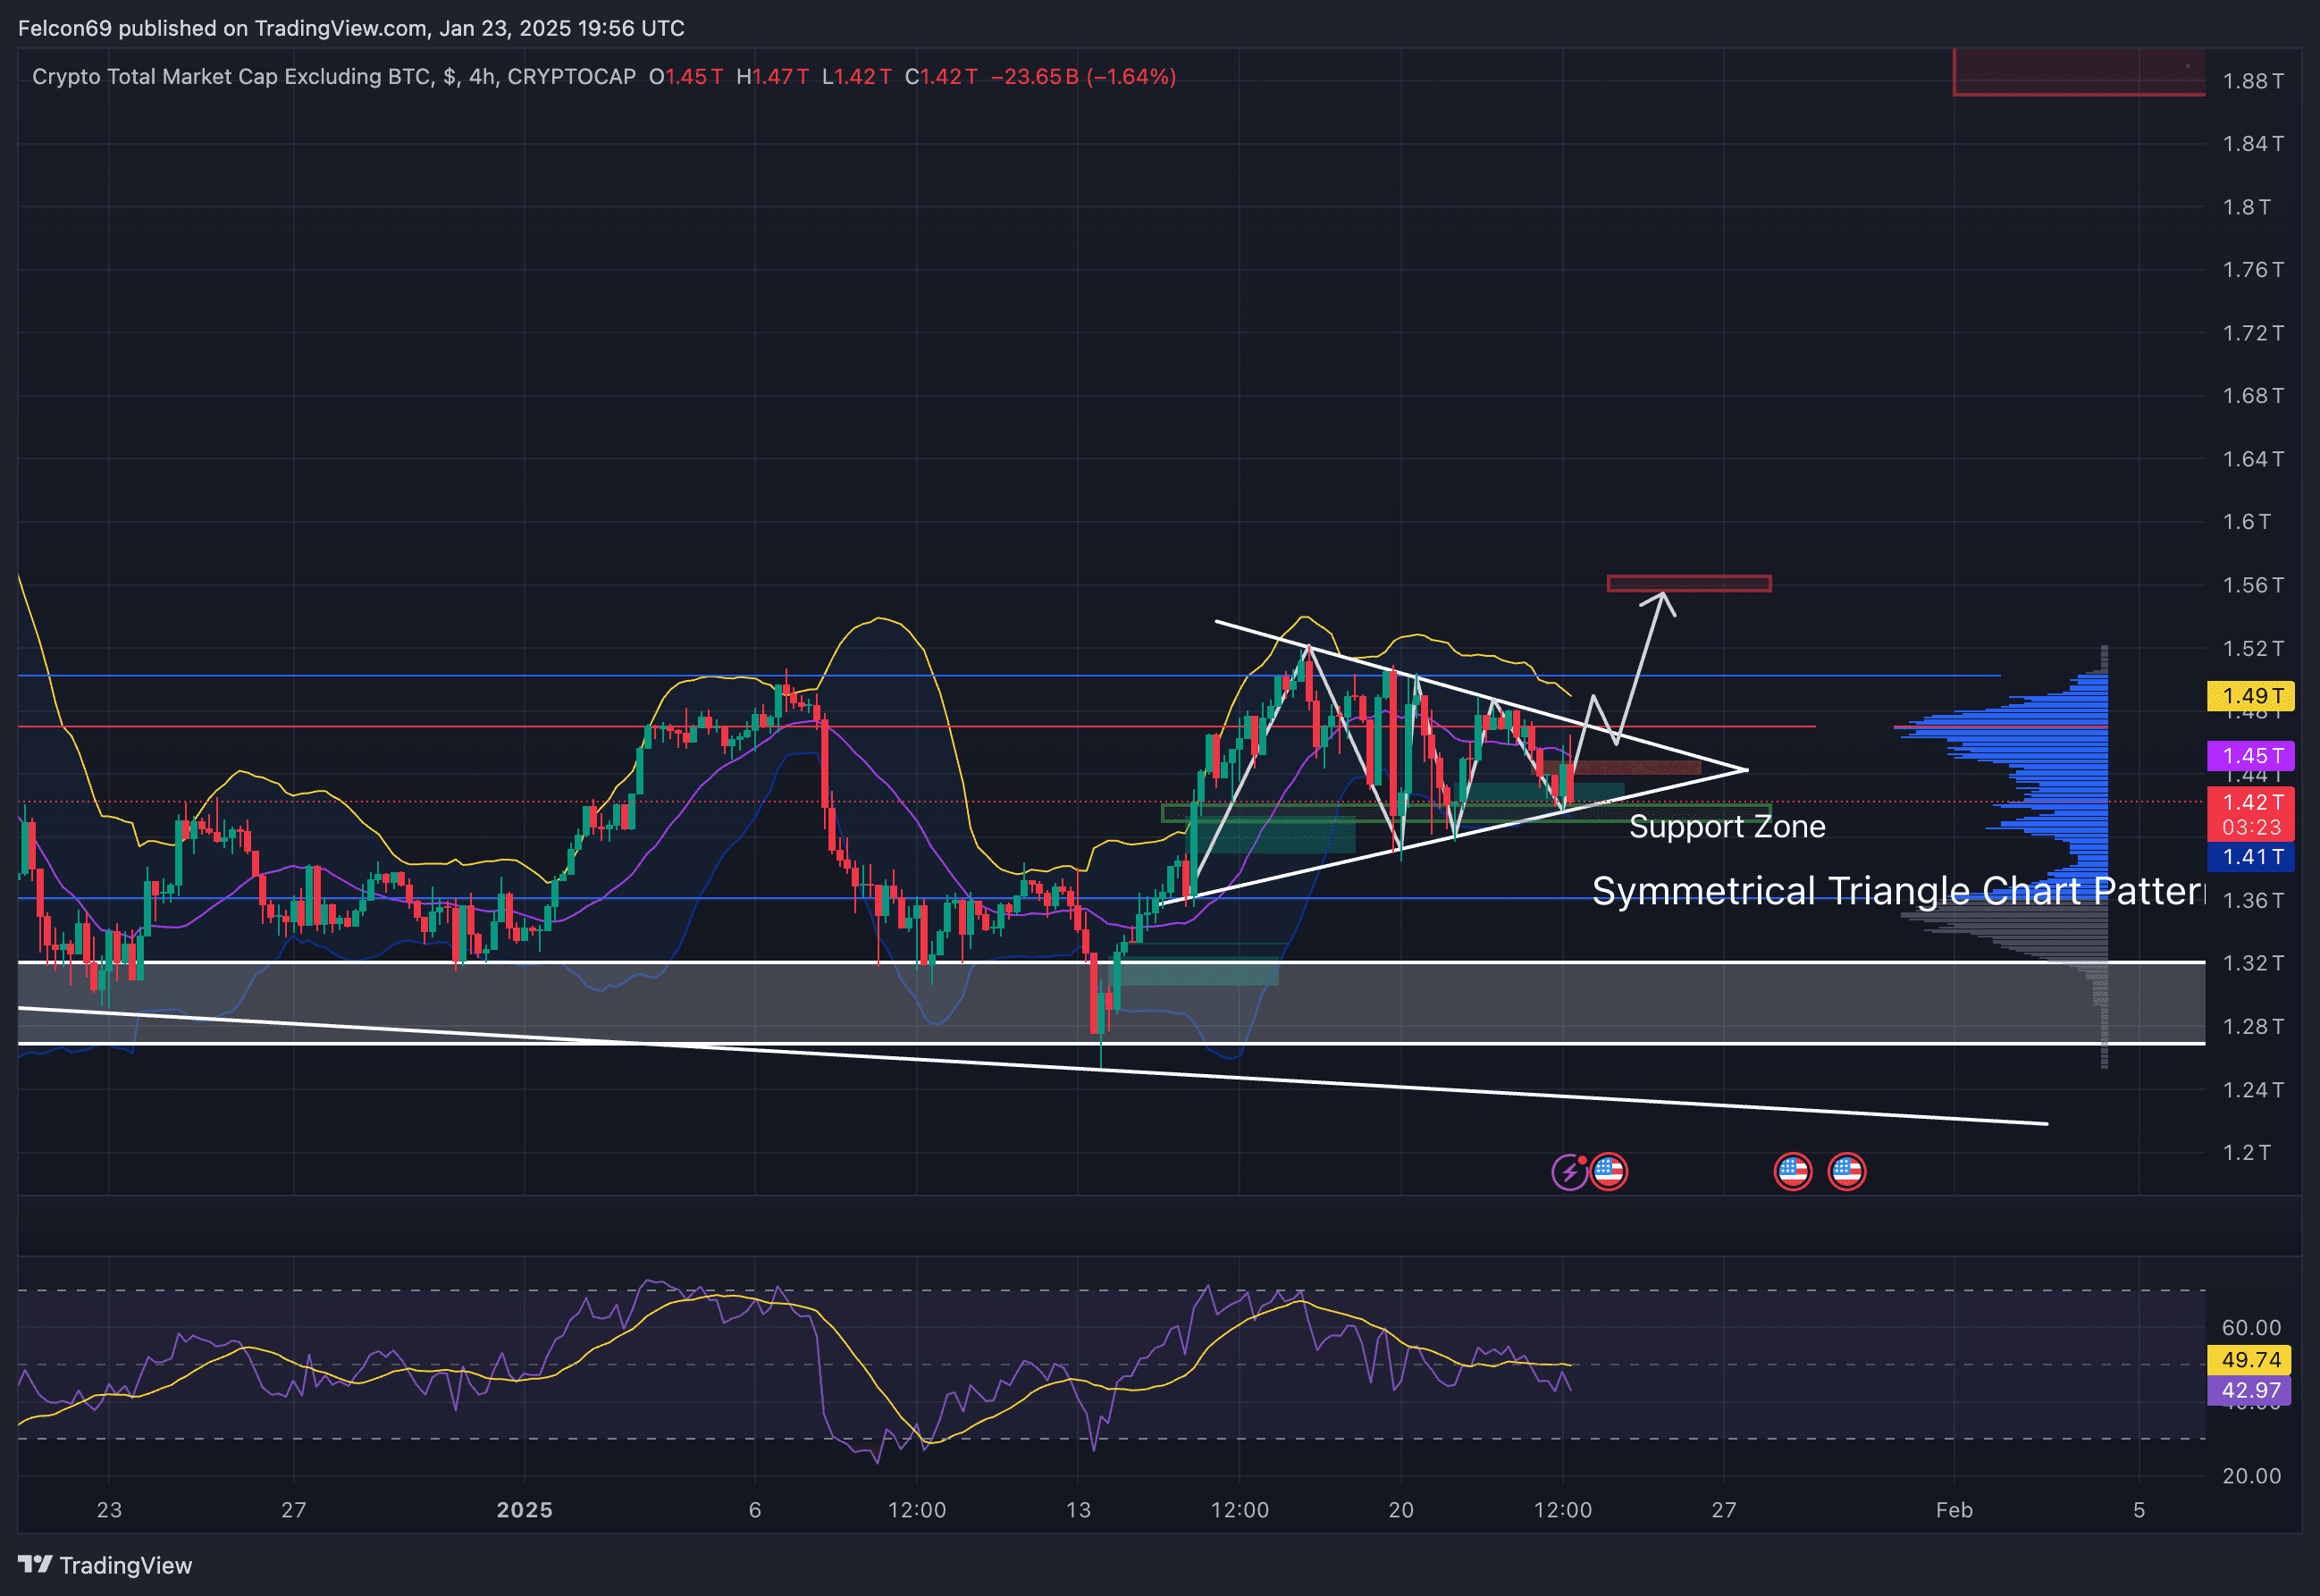
I can see on this chart represents the Total2 on the 4-hour timeframe, showcasing a symmetrical triangle pattern 🔺, a neutral setup often leading to a breakout. The support zone at $1.36T-$1.38T provides a key area of demand, holding the market steady.A breakout above the triangle's resistance indicates bullish potential 📈.Volume profile highlights strong activity near $1.45T, making it a key breakout level.RSI is neutral 📊, suggesting room for upward movement if momentum builds.
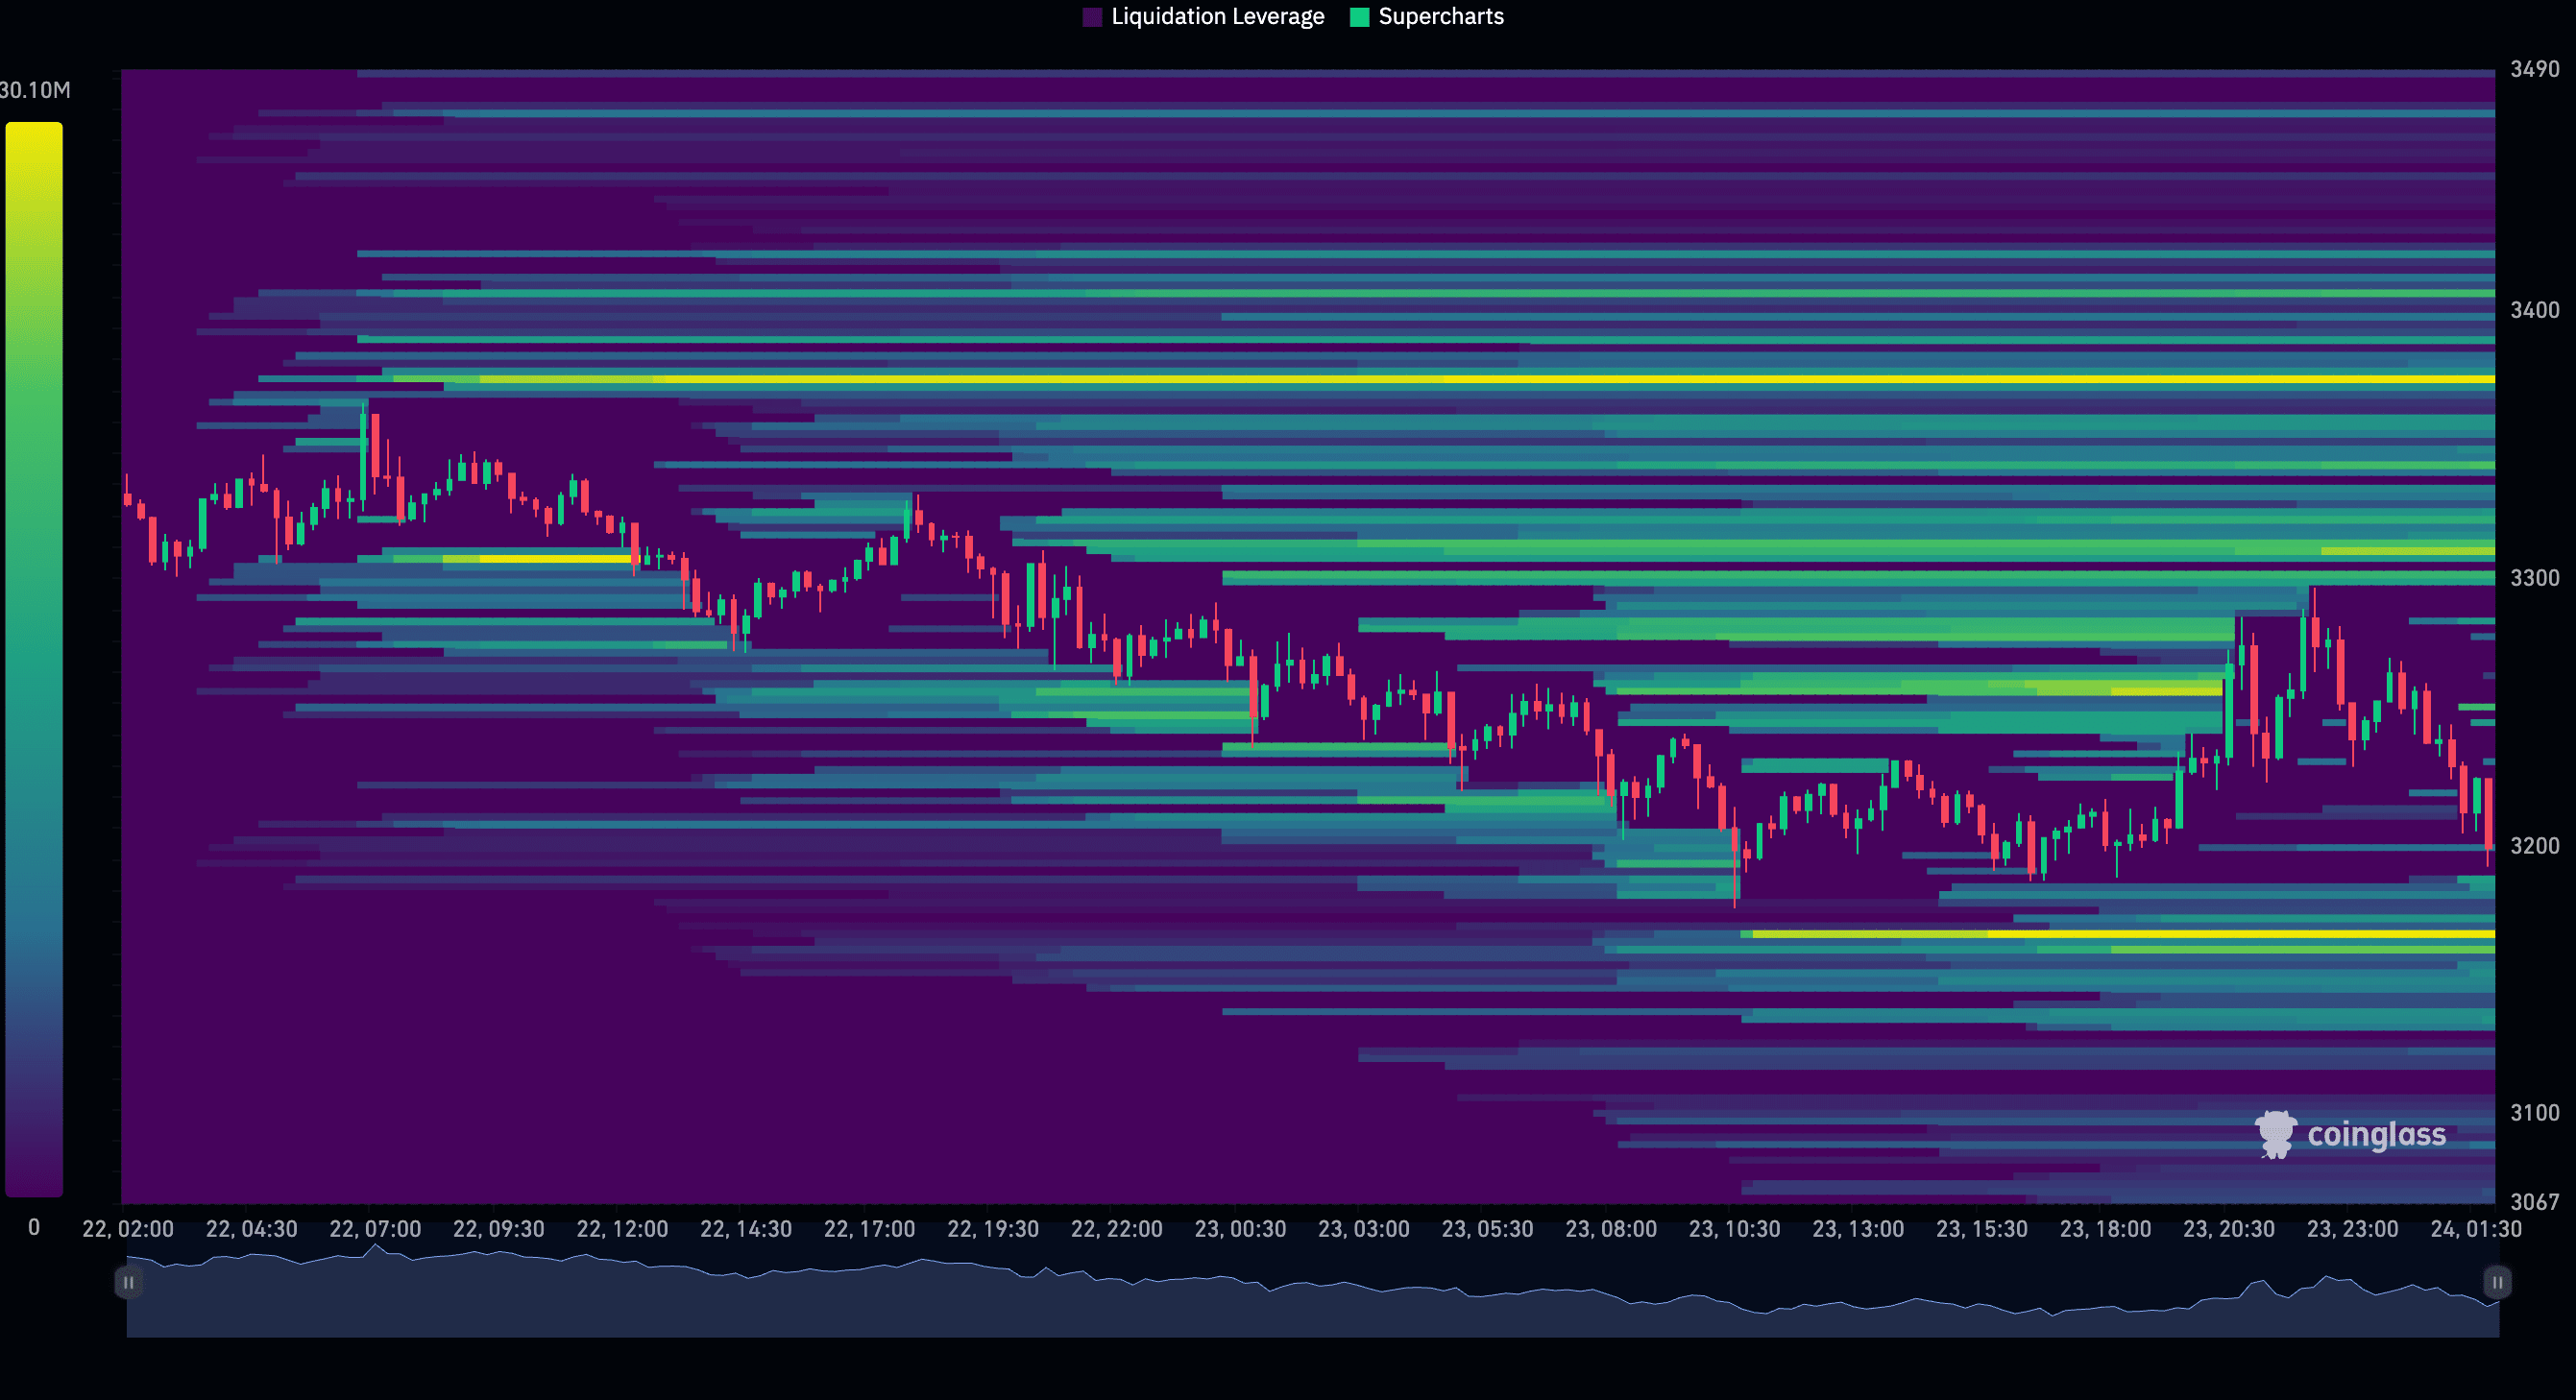
I can see Eth 48 hour mins 2dys huge liquidity on uphold. Thats why i'm bullish on this coin
Entry Price: 3,194 or Market Price
1st TP 🎯 at $ 3,300
2nd TP 🚀 at $ 3,500
3rd TP 🌟 at $ 4,000

Important 👇
Click on my profile picture to join my live stream , for 2-3 free signal.
If you want premium signal you have to follow my live stream instruction.
This signal is only for spot if you want future signals join my binance live.
Just click on my profile to join my live.