$TRUMP
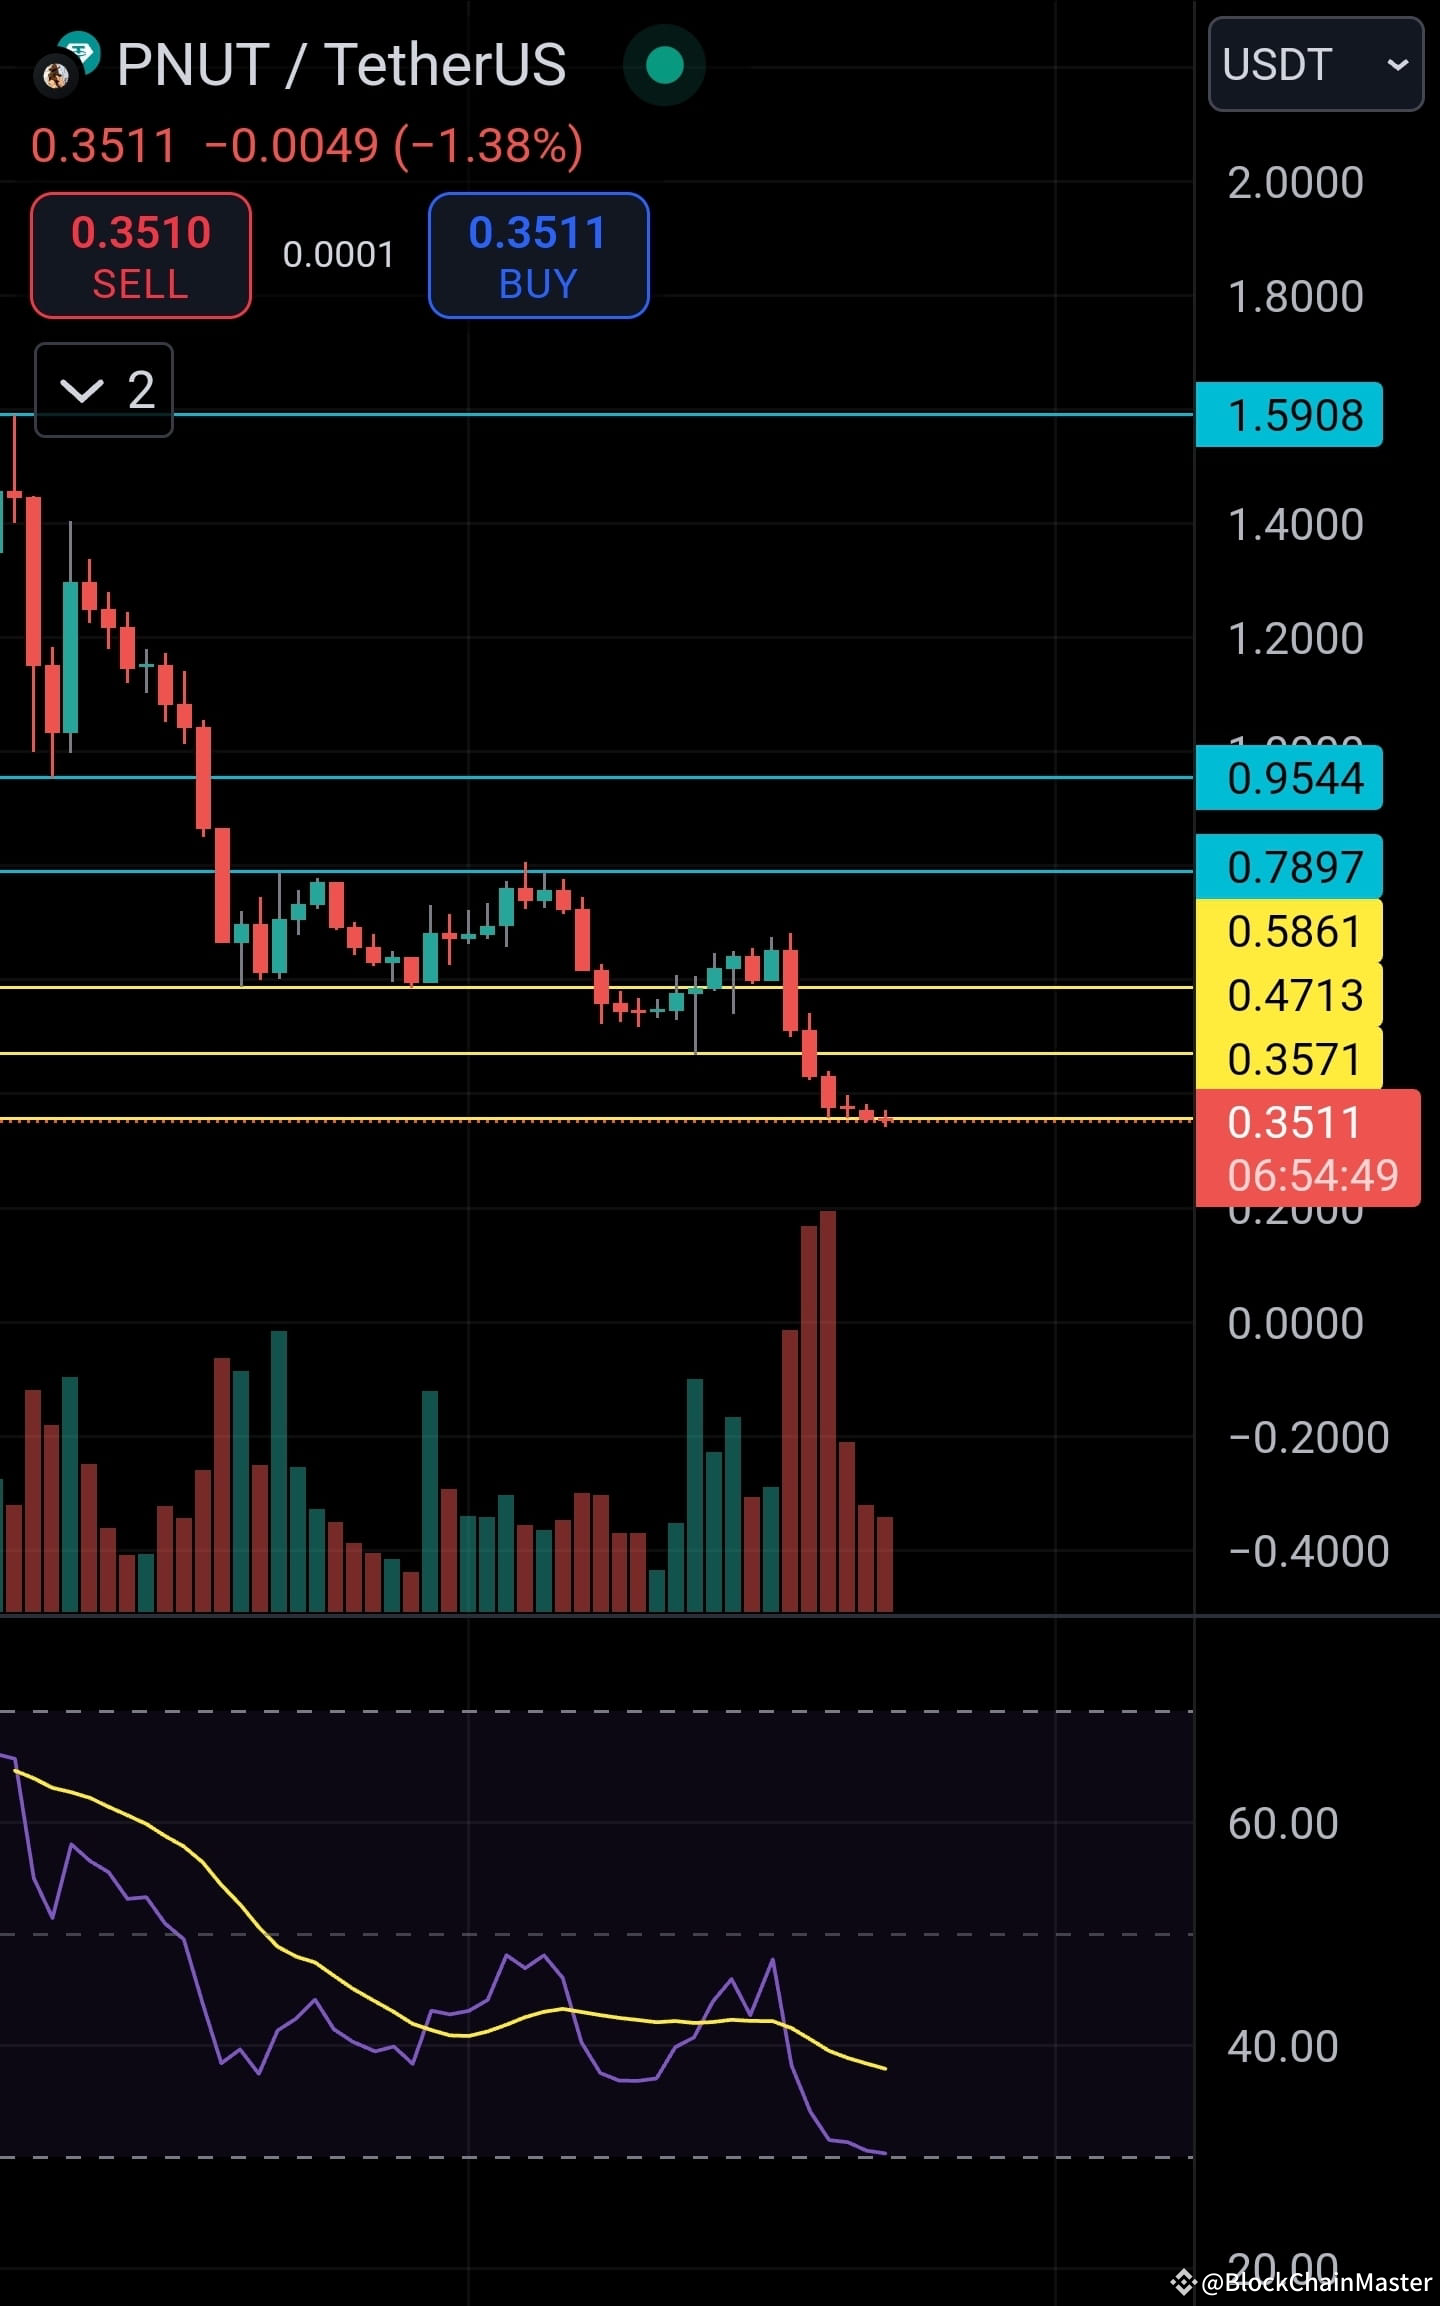
On the 1-hour time frame, the TRUMP/USDT pair is exhibiting a descending channel pattern, characterized by lower highs and lower lows, indicating short-term bearish sentiment.
Technical indicators on this time frame suggest a cautious outlook:
Relative Strength Index (RSI): The RSI is at 45, indicating a neutral stance.
Moving Averages: Short-term moving averages (MA5, MA10) are signaling a 'Sell,' while longer-term averages (MA20, MA50) remain neutral.
MACD: The MACD line is below the signal line, suggesting bearish momentum.
On the 1-hour time frame, the TRUMP/USDT pair is exhibiting a descending channel pattern, characterized by lower highs and lower lows, indicating short-term bearish sentiment.
Technical indicators on this time frame suggest a cautious outlook:
Relative Strength Index (RSI): The RSI is at 45, indicating a neutral stance.
Moving Averages: Short-term moving averages (MA5, MA10) are signaling a 'Sell,' while longer-term averages (MA20, MA50) remain neutral.
MACD: The MACD line is below the signal line, suggesting bearish momentum.