


Many didn't see what happened in 2017/2018, I caught it, and then 2020 2021 was even more prepared, and now 2025 2026 will be incredible, many more people, many more cryptos, many more means of negotiation, are you prepared for what's coming?
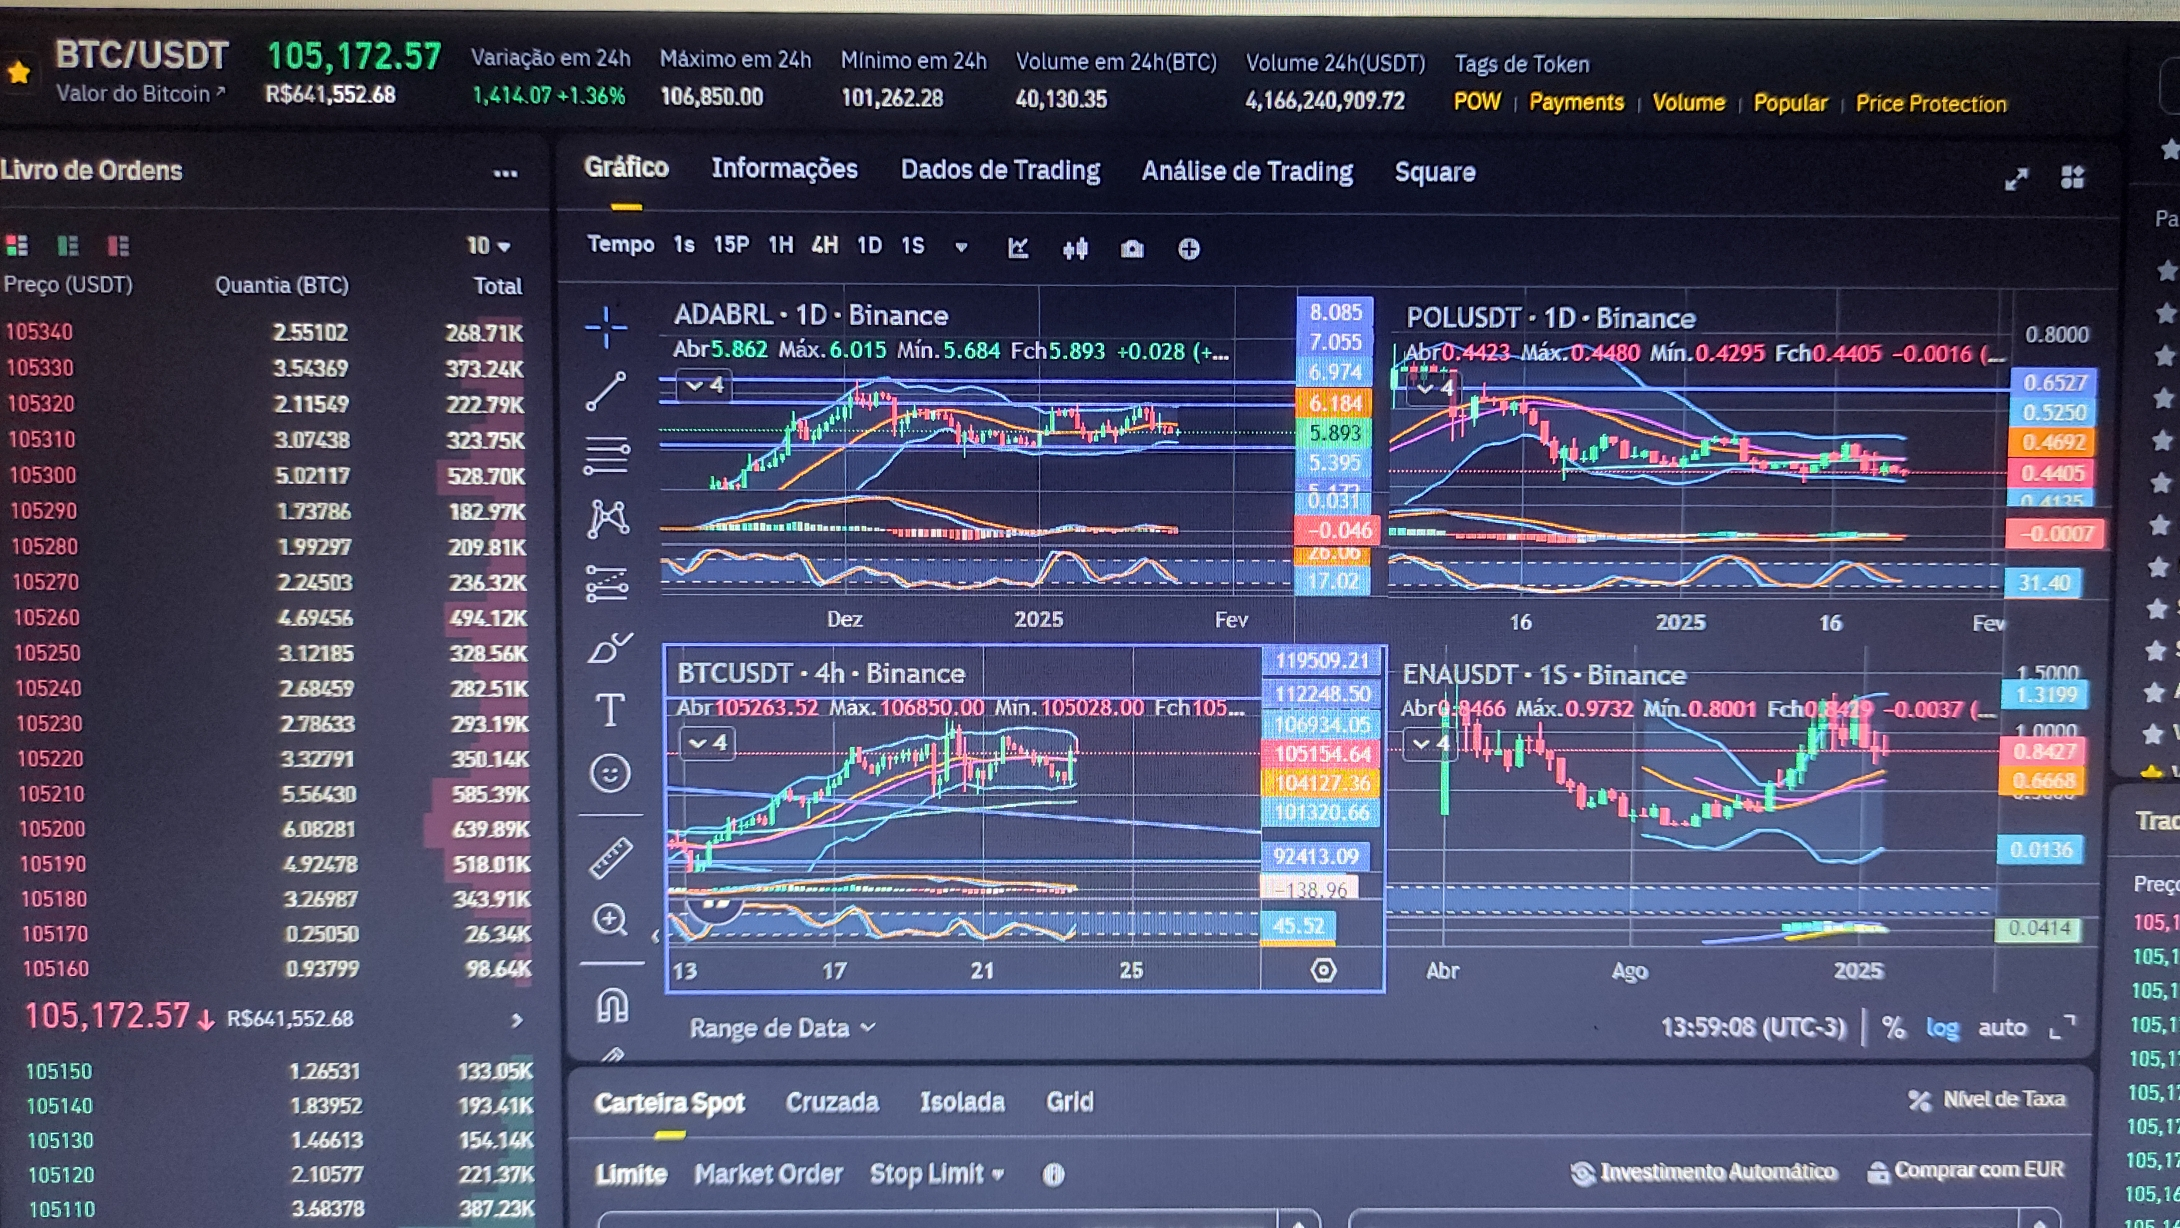
The cryptocurrency market, especially Bitcoin, has recurring patterns that can be observed after important events such as the halving. This phenomenon, which occurs approximately every four years, reduces the reward per block mined by half, reducing the issuance of new Bitcoins. This creates an environment of scarcity, which, combined with increasing demand, has historically driven up prices.
Current Post-Halving Scenario
After about 8 months of the halving, as analyzed, the market often enters a phase of strong appreciation, with Bitcoin leading the way. Shortages on exchanges indicate significant accumulation by large investors (whales), while liquidity and trading volume increase. This is a harbinger of high volatility, often accompanied by large price spikes.
The current market reading confirms that Bitcoin is following its historical behavior. Key resistances are being tested repeatedly, while well-established supports are propping up the price. The expectation of a parabolic run is in line with previous moves and should be followed by a temporary Bitcoin dominance before massive capital inflows migrate to Altcoins.
Impact on Altcoins
As Bitcoin hits its targets and begins to slow, investors tend to seek higher returns in altcoins, which historically see explosive moves at this stage of the cycle. This phenomenon, known as “altseason,” can generate high percentage gains in a short period of time, especially for projects with solid fundamentals or compelling narratives.
Technical Analysis with Fibonacci
Support and resistance analysis with Fibonacci retracements provides accurate insights to determine areas of interest on the chart. Considering the current momentum:
1. Critical Support Levels (Fibonacci):
0.382: First retracement level after impulsive moves, usually tested as support.
0.5 and 0.618: Areas with the highest probability of price accumulation and recovery. If the market seeks liquidity at these levels, these are good zones for re-entry.
2. Target Resistances:
Extension levels 1.618 and 2.618 are common in parabolic bullish moves. These points are often reached during and after the euphoric phase.
3. Altcoin Strategy:
Observe tokens that are still in support zones (close to 0.618 Fibonacci) and show increasing volumes. This way, it is possible to identify projects with greater potential for explosion.
The market appears poised for the start of a parabolic run in Bitcoin, followed by a burst in Altcoins. Working with Fibonacci-based support and resistance will be key to identifying strategic entry and exit points, maximizing gains and minimizing risks. Reading cycles and preparing for high volatility events are essential to seize opportunities in this dynamic market.
Whoever saw my previous analyzes targets are there 110k 119k 132k 143k in the last stage it should correct a little stronger and do a double type if it will go up more we will have to wait how the market will behave at these price levels, more $BTC expected and 225k will be?