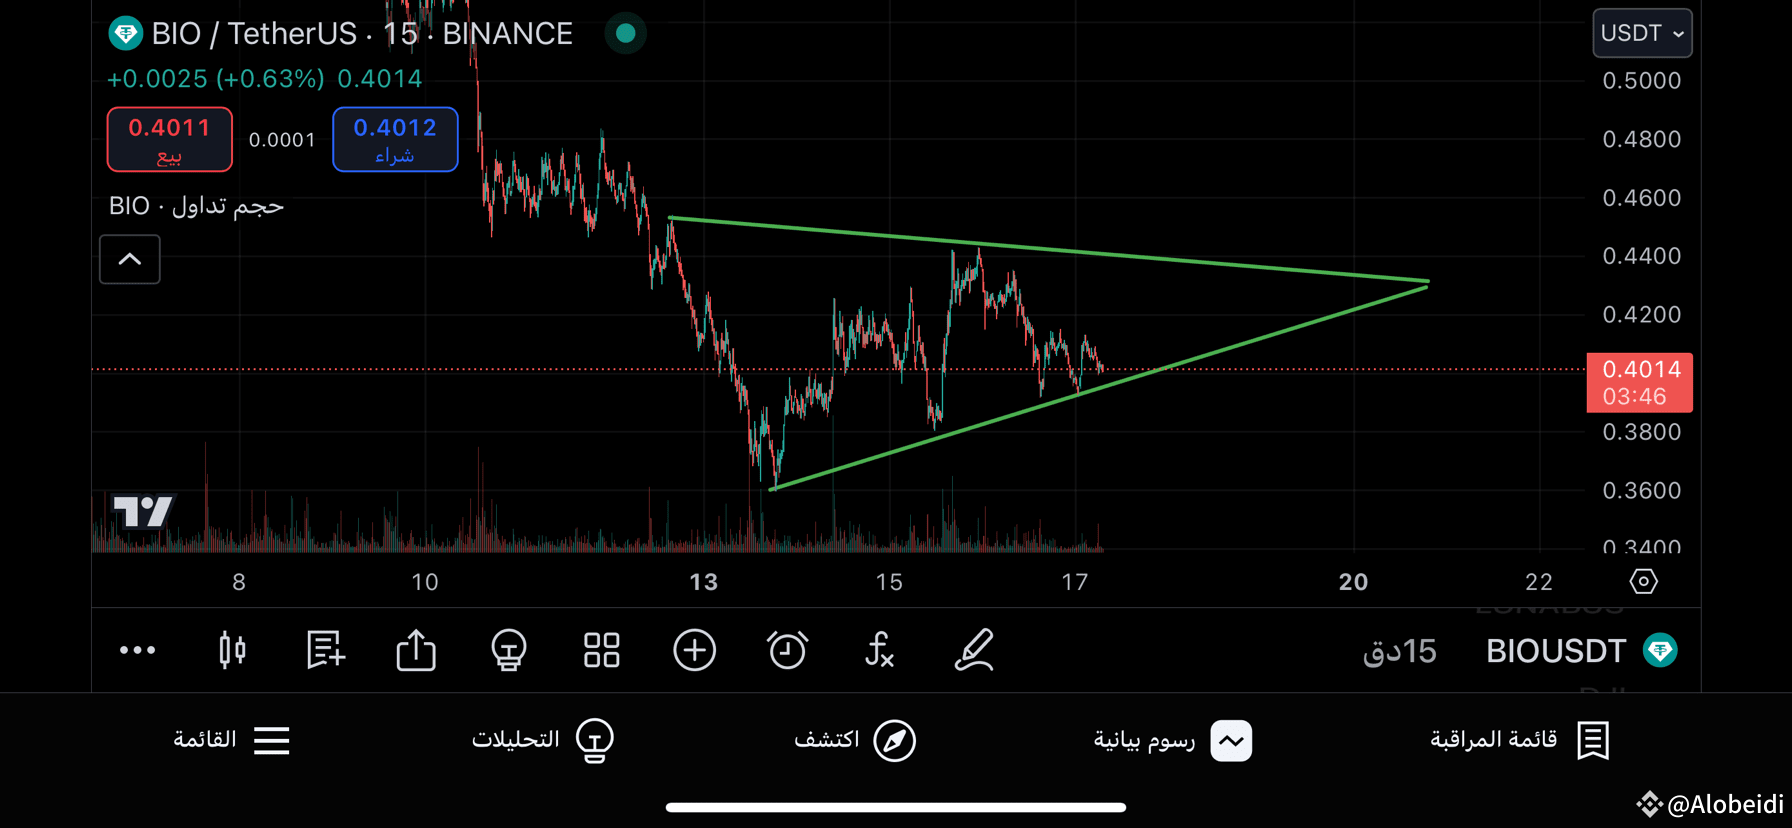
Possibilities:
• Bullish breakout: If the price breaks above the upper trend line, it may continue its previous upward trend.
• Bearish breakout: If the price breaks below the lower trend line, the price may decline to lower levels.
Support and resistance levels:
• Key resistance level: Located at the upper boundary of the triangle around 0.42. Breaking this level upwards could lead to a continuation of the upward trend.
• Key support level: Located at the lower boundary of the triangle around 0.38. Breaking this level downwards could lead to a decline in the price to lower levels
$BIO #bio
• Bullish breakout: If the price breaks above the upper trend line, it may continue its previous upward trend.
• Bearish breakout: If the price breaks below the lower trend line, the price may decline to lower levels.
Support and resistance levels:
• Key resistance level: Located at the upper boundary of the triangle around 0.42. Breaking this level upwards could lead to a continuation of the upward trend.
• Key support level: Located at the lower boundary of the triangle around 0.38. Breaking this level downwards could lead to a decline in the price to lower levels
$BIO #bio