Do you have a tg channel?

Post

--

BRITON 888
·
--
ICP Small Analysis.
Internet Super Computer with ticker ICP on your screens! While everything is growing, this beauty decides to fall.
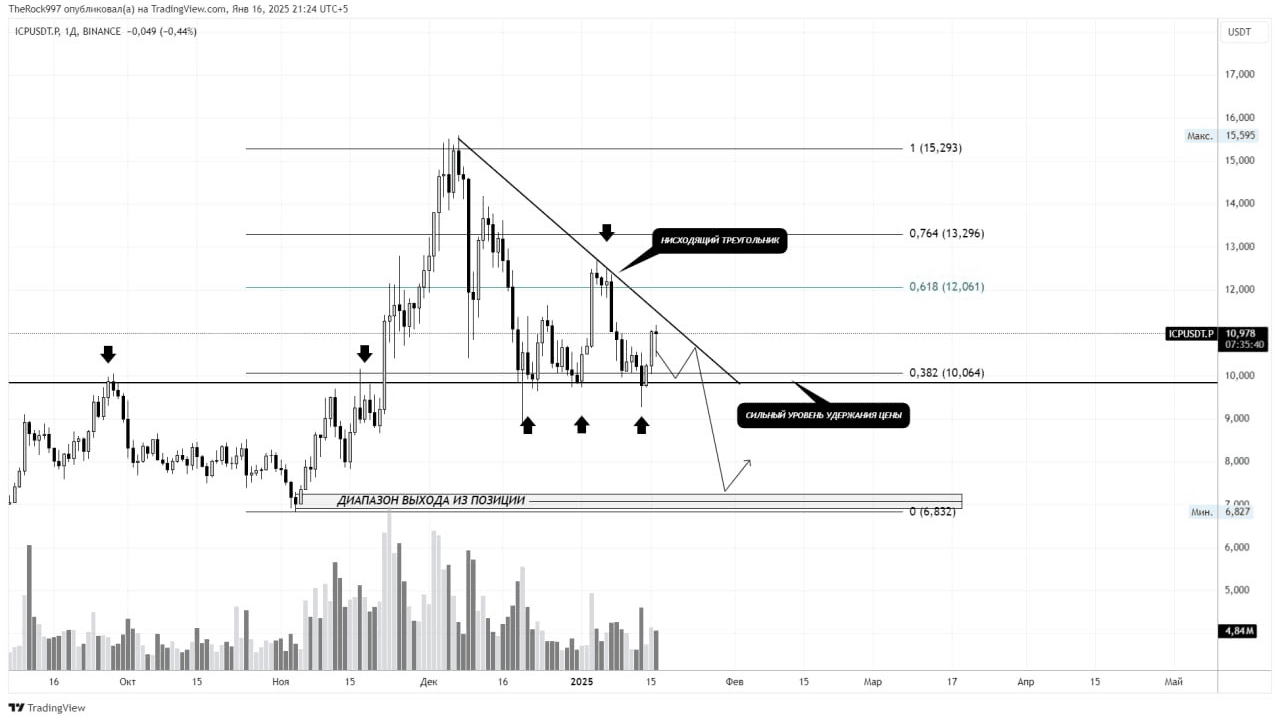
The daily chart shows a descending triangle pattern marked by a falling trendline above and a horizontal support level around $9.7/$10 below. This figure is usually interpreted as bearish, as a breakout below the lower boundary greatly increases the chance of continued decline.
The daily chart shows a descending triangle pattern marked by a falling trendline above and a horizontal support level around $9.7/$10 below. This figure is usually interpreted as bearish, as a breakout below the lower boundary greatly increases the chance of continued decline.
Disclaimer: Includes third-party opinions. No advice. Binance AI may be used without guarantee. See T&Cs.