
Thanks for the summary, I started following now.

Post

Bruno Roos
·
--
📊 Learn How to Read Indicators!
-
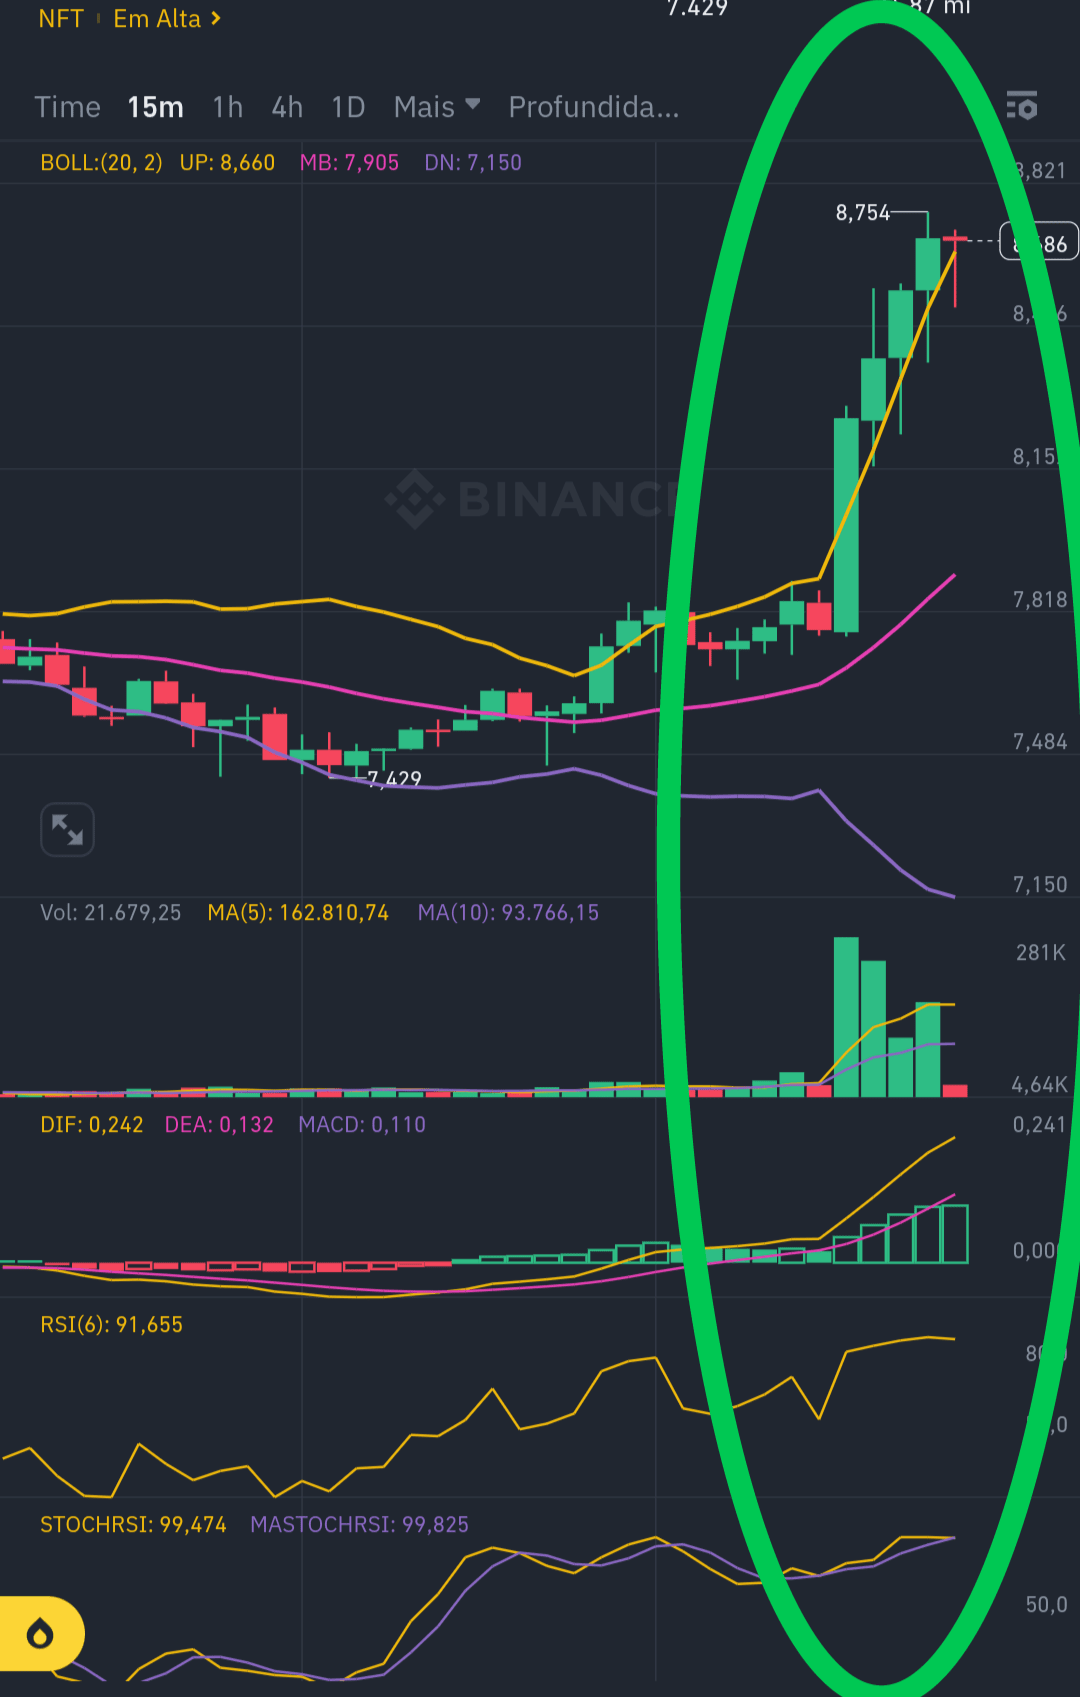
Let's use this image as a practical example to understand the main indicators that help predict market movements. Check out what each one is showing:
📈 1. Bollinger Bands (Yellow, Pink and Purple Lines):
The candles are breaking the upper line (UP), indicating that the price is overbought.
⚠️ When this happens, the price tends to retreat or stabilize. Stay tuned!
📊 2. Volume (Green and Red Bar Chart):
Notice the increase in green bars! This shows strong buying pressure.
🔎 If the volume starts to fall while the price rises, it is a sign of weakness.
📈 3. RSI (Relative Strength Indicator):
The RSI is at 91.65, well above 70, indicating extreme overbought.
⚠️ This is a warning that the asset may be close to correcting.
📉 4. MACD (DIF and DEA Lines):
The MACD is still positive, showing an upward trend.
But be careful: if the lines start to cross downwards, it may be a sign of reversal.
💡 Practical Summary:
Strong volume? 🚀 The rise may still continue.
RSI above 90? ⚠️ Beware of corrections.
Candles above Bollinger? 🔄 Be aware of a possible drop or lateralization.
Reading the indicators helps predict what comes next. Study, observe and make strategic decisions! 💹
$BTC $PROM $DOGE
-
Let's use this image as a practical example to understand the main indicators that help predict market movements. Check out what each one is showing:
📈 1. Bollinger Bands (Yellow, Pink and Purple Lines):
The candles are breaking the upper line (UP), indicating that the price is overbought.
⚠️ When this happens, the price tends to retreat or stabilize. Stay tuned!
📊 2. Volume (Green and Red Bar Chart):
Notice the increase in green bars! This shows strong buying pressure.
🔎 If the volume starts to fall while the price rises, it is a sign of weakness.
📈 3. RSI (Relative Strength Indicator):
The RSI is at 91.65, well above 70, indicating extreme overbought.
⚠️ This is a warning that the asset may be close to correcting.
📉 4. MACD (DIF and DEA Lines):
The MACD is still positive, showing an upward trend.
But be careful: if the lines start to cross downwards, it may be a sign of reversal.
💡 Practical Summary:
Strong volume? 🚀 The rise may still continue.
RSI above 90? ⚠️ Beware of corrections.
Candles above Bollinger? 🔄 Be aware of a possible drop or lateralization.
Reading the indicators helps predict what comes next. Study, observe and make strategic decisions! 💹
$BTC $PROM $DOGE
Disclaimer: Includes third-party opinions. No advice. Binance AI may be used without guarantee. See T&Cs.