

I
$PEPE Currency Recommendations

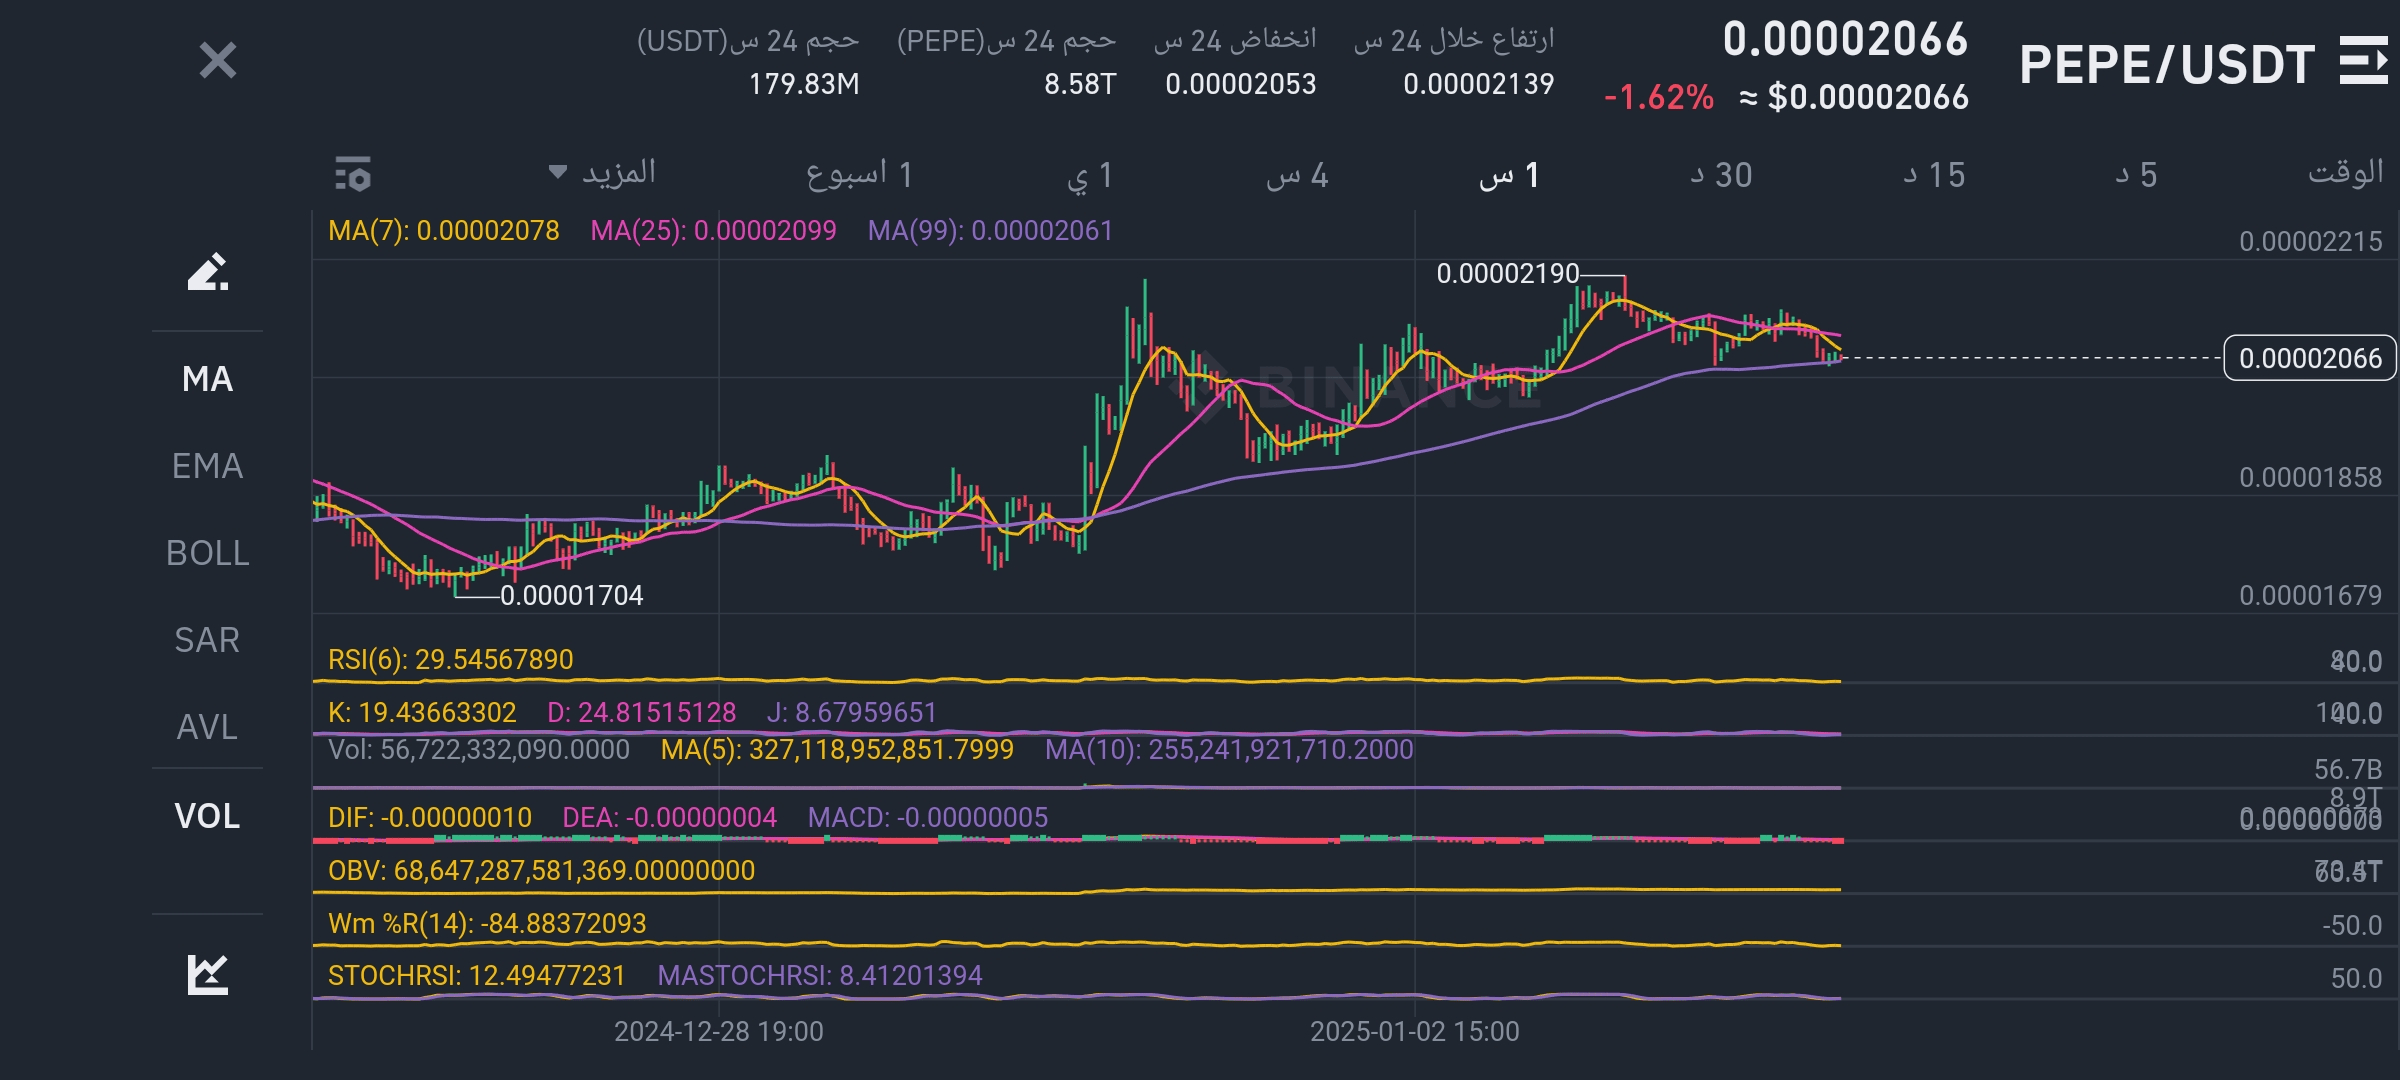
Current price:
Price: 0.00002066 USDT
Change in 24 hours: -1.62%
Highest price in 24 hours: 0.00002139 USDT
Lowest price in 24 hours: 0.00002053 USDT
24-hour trading volume: 8.58 trillion (8.58T)
Market Cap: 179.83 Million
---
Technical indicators 📈
Moving Averages (MA):
AND (7): 0.00002078
AND (25): 0.00002099
AND (99): 0.00002061
Interpretation:
The current price of 0.00002066 is below the 7 and 25-day moving averages, but close to the 99 MA.
This indicates relative weakness in the short and medium term, with potential support at the 99 MA level.
---
Momentum indicators:
RSI(6): 29.54 (oversold)
Stochastic (K): 19.43
Stochastic (D): 24.81
Wm %R (14): -84.88 (sale area)
STOCH RSI: 12.49 (oversold)
Interpretation:
RSI is below 30, which means the currency is in the oversold zone, and there is a possibility of an upward rebound soon.
Wm %R at -84.88 confirms that the currency is in a strong sell zone.
Stochastic RSI is showing a reading of 12.49, indicating a possible reversal soon if the selling pressure continues to ease.
---
Size and cash flow $PEPE :
Current trading volume: 56,722,332,090
MA (5): 327,118,952,851.8
MA (10): 255,241,921,710.2
Interpretation:
The current trading volume is low compared to the averages (MA 5 and 10), reflecting declining market activity and low liquidity.
---
Trend indicators:
MACD: -0.00000005 (negative signal)
DIF: -0.00000010
DEA: -0.00000004
Interpretation:
MACD is in the negative territory with a bearish crossover, indicating a continuation of the short-term downtrend.
---
Support and resistance points 📌
First support: 0.00002053 (24h low)
2nd Support: 0.00001858 (Major Support)
First resistance: 0.00002099 (MA 25)
2nd Resistance: 0.00002139 (24h High)
---
Trend Analysis 🧐
Short-term trend: Down with a possible bounce from the support area of 0.00002053.
Long-term trend: Sideways, as long as the price is stable above 0.00001858.
---
Proposed strategy 🎯 $PEPE
Entry: When support 0.00002053 is tested with reversal signals (RSI, MACD).
Take Profit: at 0.00002139 or near MA 25.
Stop Loss: When 0.00002050 is broken downwards.
---
Additional tips 💡
The market is in a state of relative weakness, so it is advisable to wait for strong bounce signals to appear.
Oversold levels can be exploited to enter short-term trades while monitoring resistance points.