The Ascending Triangle pattern is one of the most common graphical indicators used by traders. Contrary to opinions, its appearance does not necessarily mean that the price level will rise. Market analysts use a huge number of technical indicators to predict trends, and the one we'll look at is just one of them.
What is the ascending triangle pattern
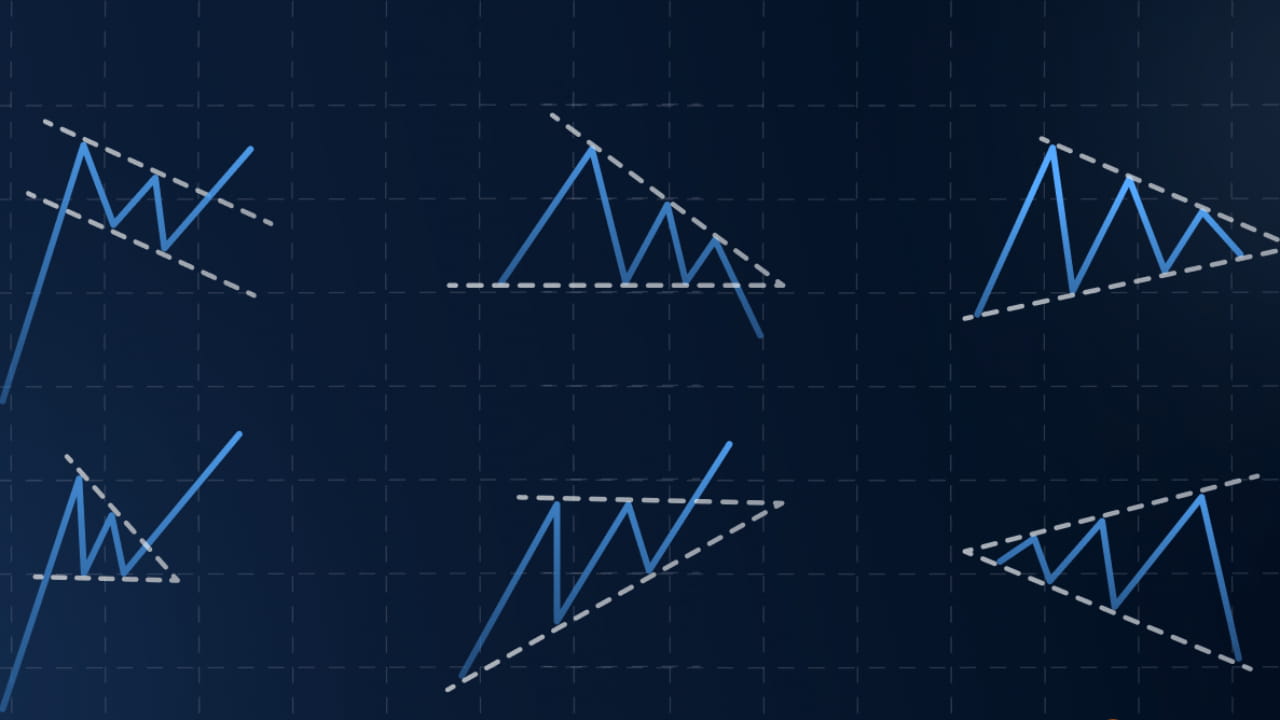
As the name suggests, an ascending triangle is formed on the chart when the rate consolidates in the interval between the support of the ascending trend line and its horizontal resistance.
The pattern usually occurs during constant downward or upward trends. Many technical market analysts refer to it as a “continuation pattern,” which implies that the overall market trend is likely to resume.
Bitcoin versus dollar chart with a breakdown of the ascending triangle (from April to July 2020):

The price of Bitcoin leaves the ascending triangle at the end of July. Later in September, it returns to once again test the pattern's resistance line as support for the ongoing bullish rally, resuming the positive trend.
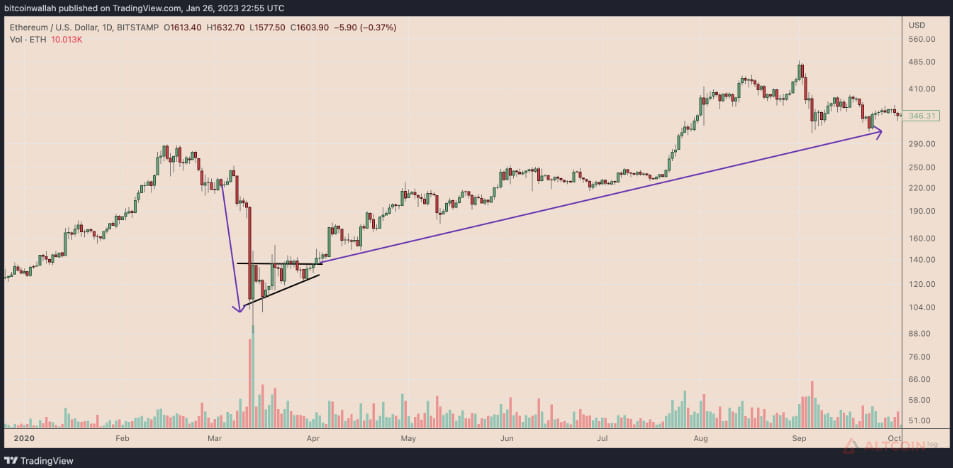
However, an ascending triangle does not always necessarily herald a continuation of a bullish rally, especially in bear markets. For example, its occurrence in the 2018 bear market foreshadowed a larger decline in ETH, as can be seen in the following chart.
Formation of the Ethereum triangle between March and April 2020:

Another example is when an ascending triangle signals the end of a bear market. One of them is the formation of the Ethereum triangle in the period from March to April 2020, as a result of which the trend turned upward, as can be seen in the chart:
Now let's look at how traders apply this graphic pattern, taking into account the fact that its results can be completely different.
How to trade with the Ascending Triangle pattern
The Ascending Triangle has a common measurement technique that can help a trader formulate profit targets after a breakout or breakout.
In a bullish trend, the target is found by determining the largest distance between the upper and lower trend lines of the triangle, then adding the distance to the upper trend line. The same can be said about the ascending triangle reversal settings.
An illustrative example: an ascending triangle – a breakout target:
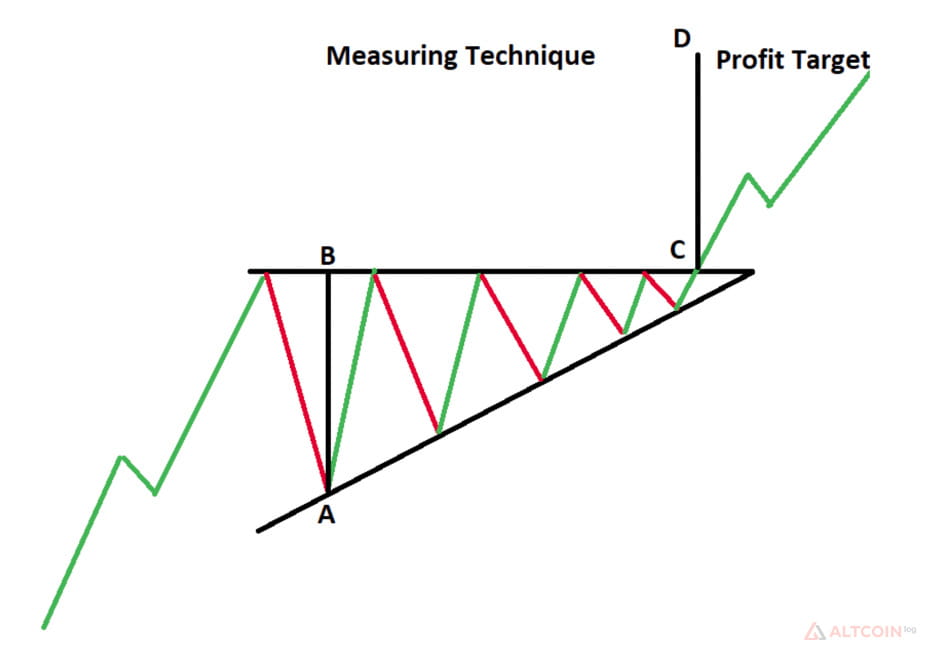
The opposite is also true. The profit target in case of a bearish trend is formed by measuring the distance between the upper and lower trend lines of the triangle. The result is then added to the breakout point on the lower trend line.
The purpose of breaking out the ascending triangle pattern is:

Council
You can use the hint by paying attention to the accompanying trading volume. A rise in this indicator is usually perceived as a sign of strong momentum. Conversely, a trend with low volumes signals that the breakout or breakdown may lack momentum.
Another useful tool used by traders to reduce risk in the event of a possible breakout or breakout of an ascending triangle is the use of stop losses at the opposite end of the trend. In other words, the trader can exit the position with a smaller loss if the trend reverses before the technical profit target is reached.