
Rey佬
182 Posts

Rey佬
Report
Block User
重头来过
1 Following
1.6K+ Followers
2.3K+ Liked
Posts
All
Quotes
·
--
Bearish
That’s disastrous! Another technical mistake.
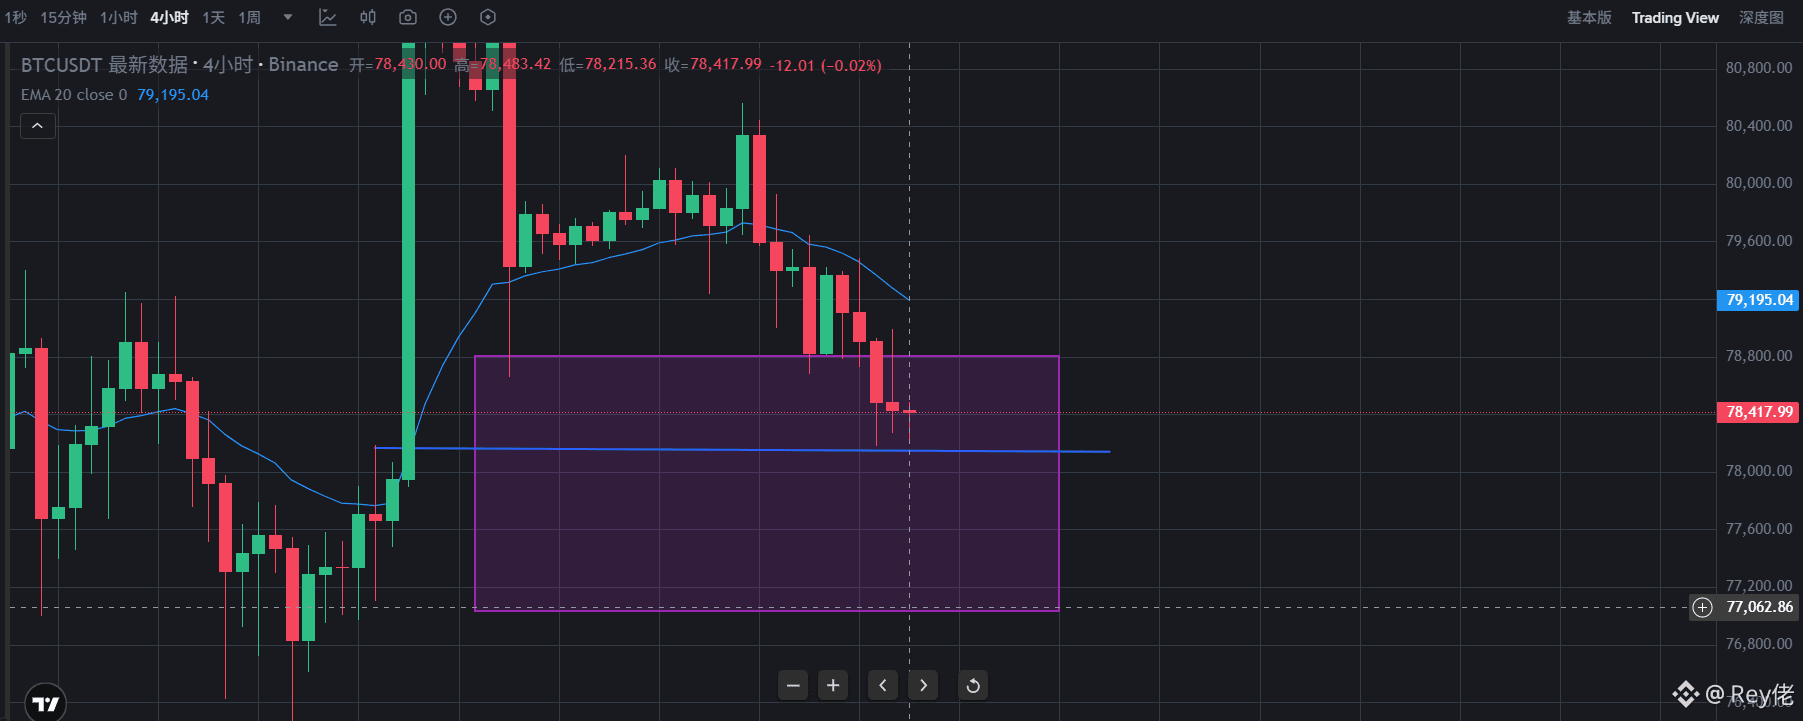
I only see it reversing when it reaches at least 79,800, so I placed my take-profit at 79,600 and set a sell order at 79,800—this is to safeguard my profits. It’s a take-profit, but my short position didn’t get filled. I’m fed up.
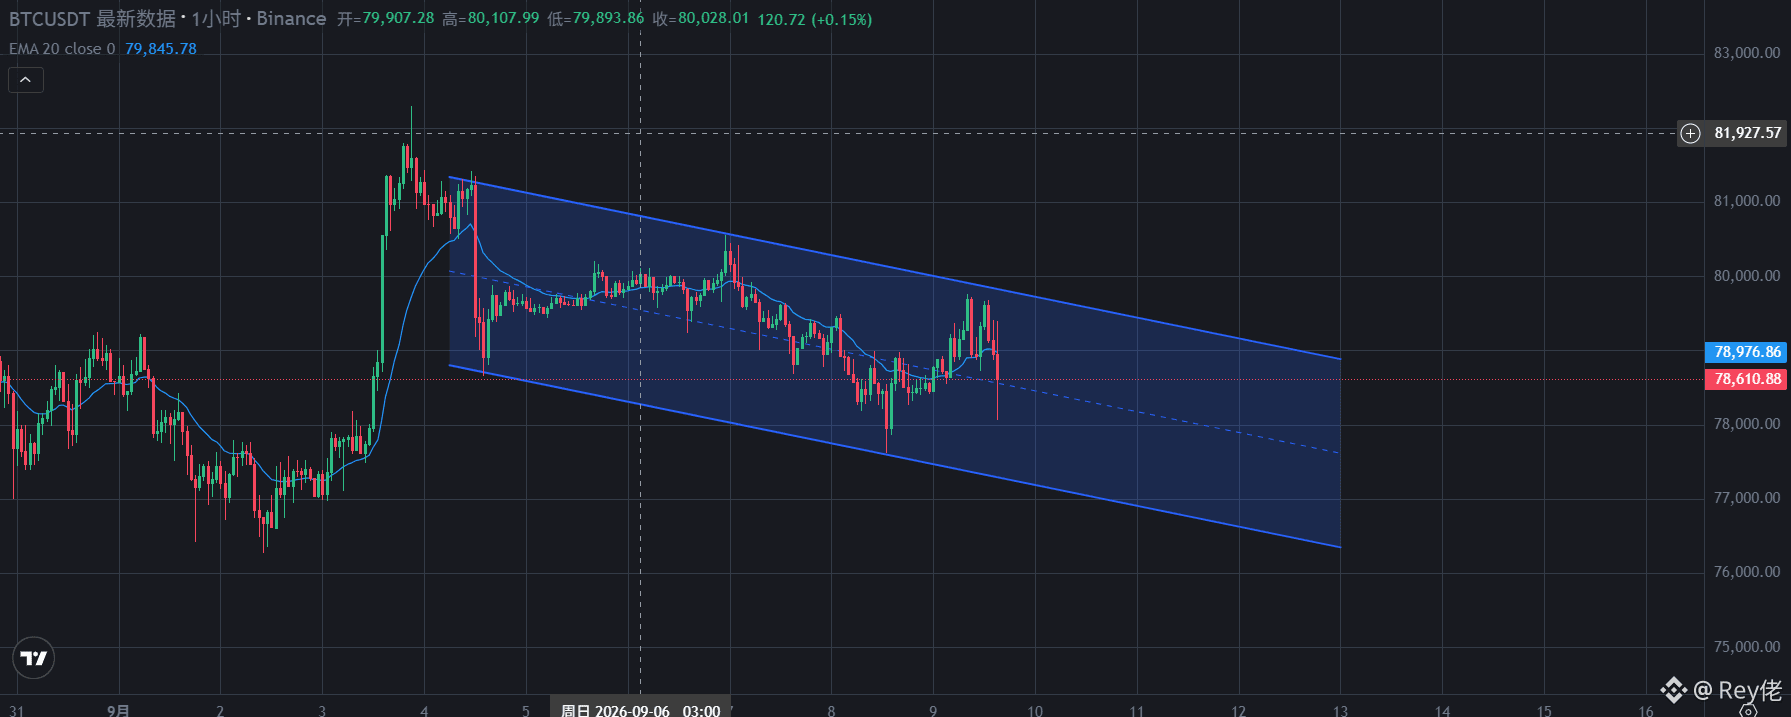
Right now Bitcoin is around 78,680. I already said earlier it would rebound after reaching the top of the channel and then wouldn’t break through downward—but now it looks like I need to overturn my previous judgment. This channel still has new lows (the last new low). I thought the bulls would strongly push up to test it, but they couldn’t even touch 80,000...
Currently, the channel is at stage 3, which is also the final leg, so the price swings will be bigger. My current target is for 77,000 to act as the bottom. After that, as I said, there will be a big breakout that would at least return to the area near the previous high—around 81,000 or more.
Short-term market analysis: There may be signs of a brief rebound, but ultimately the primary target is 77,000. The important stop-loss point is at 80,000!!
As for the mid-term market analysis, the most likely goal is to avoid breaking the previous high. As long as it doesn’t break through, there will be a major drawdown (for example, below 70,000).
$BTC #BTC #BTC走势分析
I placed a short at 79,000—does anyone know whether it can still get filled?
That’s disastrous! Another technical mistake.
I only see it reversing when it reaches at least 79,800, so I placed my take-profit at 79,600 and set a sell order at 79,800—this is to safeguard my profits. It’s a take-profit, but my short position didn’t get filled. I’m fed up.
Right now Bitcoin is around 78,680. I already said earlier it would rebound after reaching the top of the channel and then wouldn’t break through downward—but now it looks like I need to overturn my previous judgment. This channel still has new lows (the last new low). I thought the bulls would strongly push up to test it, but they couldn’t even touch 80,000...
Currently, the channel is at stage 3, which is also the final leg, so the price swings will be bigger. My current target is for 77,000 to act as the bottom. After that, as I said, there will be a big breakout that would at least return to the area near the previous high—around 81,000 or more.
Short-term market analysis: There may be signs of a brief rebound, but ultimately the primary target is 77,000. The important stop-loss point is at 80,000!!
As for the mid-term market analysis, the most likely goal is to avoid breaking the previous high. As long as it doesn’t break through, there will be a major drawdown (for example, below 70,000).
$BTC #BTC #BTC走势分析
I placed a short at 79,000—does anyone know whether it can still get filled?
I only see it reversing when it reaches at least 79,800, so I placed my take-profit at 79,600 and set a sell order at 79,800—this is to safeguard my profits. It’s a take-profit, but my short position didn’t get filled. I’m fed up.
Right now Bitcoin is around 78,680. I already said earlier it would rebound after reaching the top of the channel and then wouldn’t break through downward—but now it looks like I need to overturn my previous judgment. This channel still has new lows (the last new low). I thought the bulls would strongly push up to test it, but they couldn’t even touch 80,000...
Currently, the channel is at stage 3, which is also the final leg, so the price swings will be bigger. My current target is for 77,000 to act as the bottom. After that, as I said, there will be a big breakout that would at least return to the area near the previous high—around 81,000 or more.
Short-term market analysis: There may be signs of a brief rebound, but ultimately the primary target is 77,000. The important stop-loss point is at 80,000!!
As for the mid-term market analysis, the most likely goal is to avoid breaking the previous high. As long as it doesn’t break through, there will be a major drawdown (for example, below 70,000).
$BTC #BTC #BTC走势分析
I placed a short at 79,000—does anyone know whether it can still get filled?
1
391
·
--
Bullish
The current price has already bounced back up. The long upper wick marks the short sellers’ take-profit point.
When that candlestick engulfs the previous one—and it’s a big candlestick—the market has already reversed.
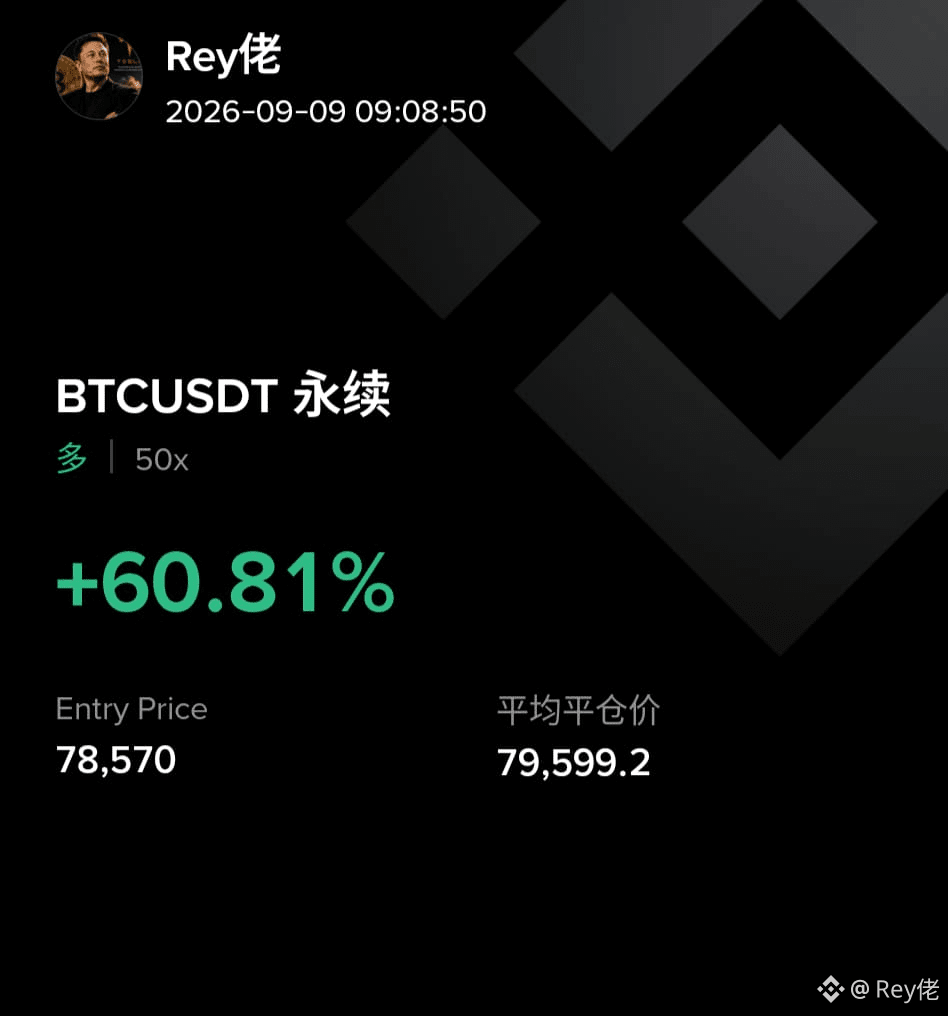
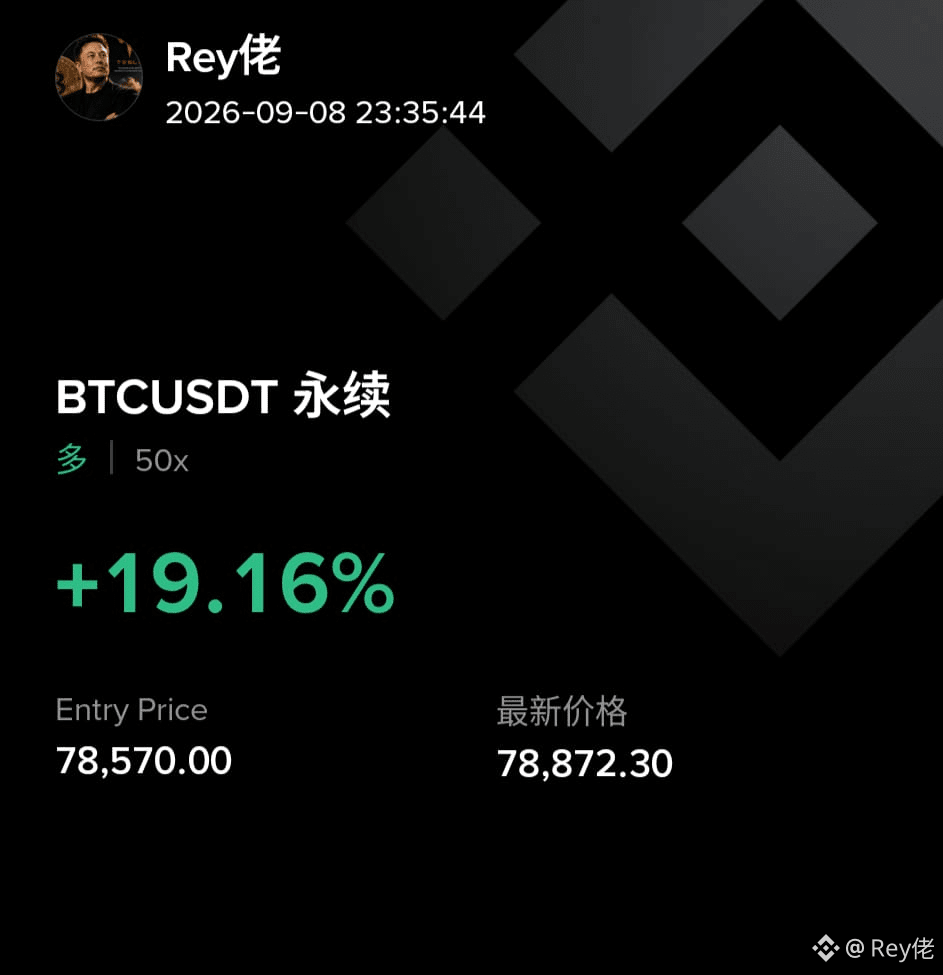
I entered a long position at market price directly at 78570. I entered that way because I was impatient, but I knew that the prior low wouldn’t be broken, so I went in directly.
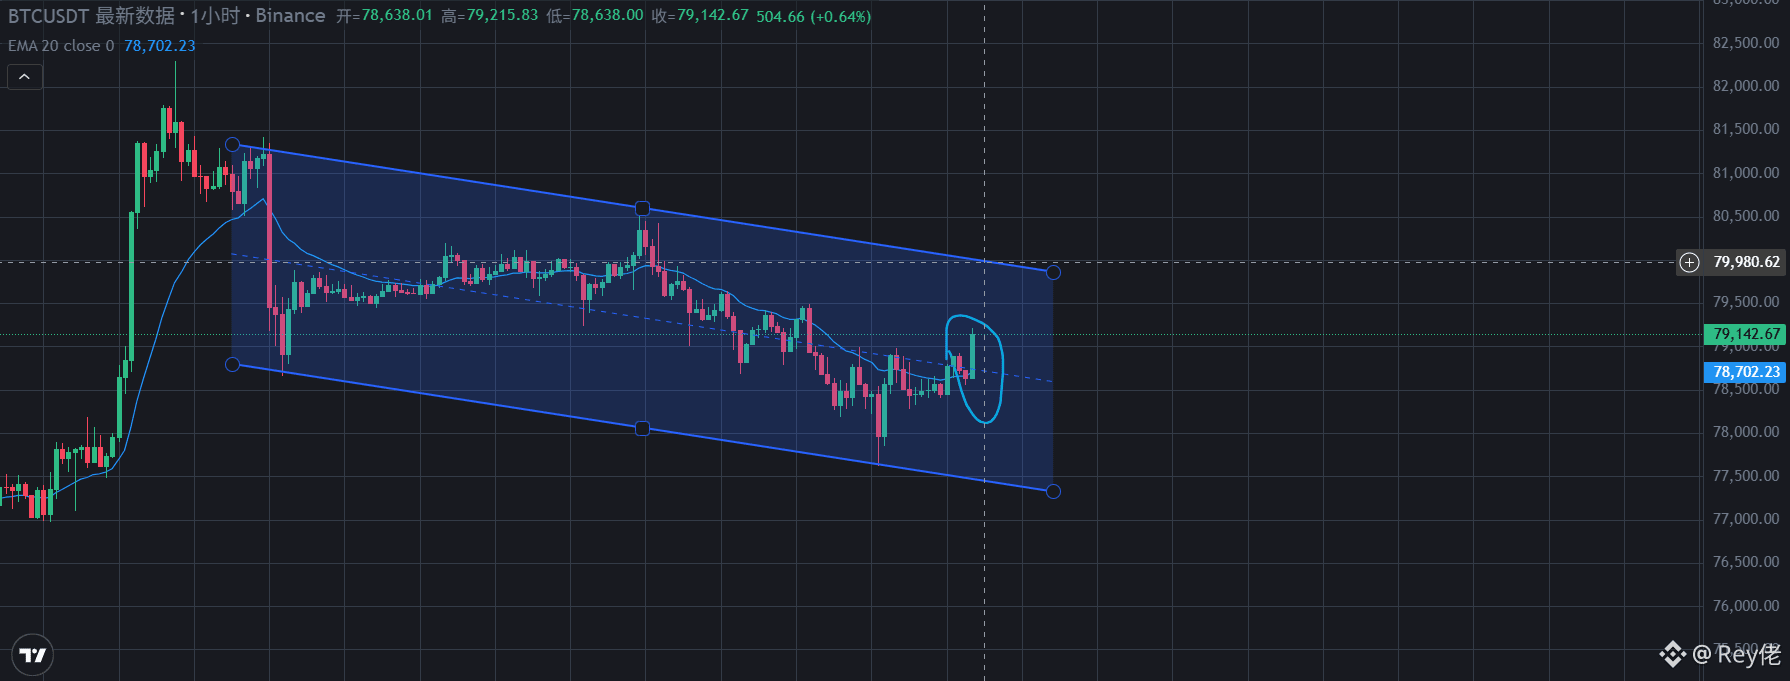
Right now the market is moving up. I’m looking at its structure using a big channel. If you ask me what the current trend is like, I can only say to focus on the channel first. What you can see now is a very clean breakout candlestick. This candlestick is dangerous because its bottom has no pullback at all—it's a very strong bullish candlestick. I don’t know whether the top of the channel can hold.
Market analysis:
In the short term, 80000 (around that area) is the primary resistance level. If it holds, then the next possible drop is very likely not to break the previous low.
In the medium term, it’s mainly about Bitcoin’s EMA. If it breaks below or touches it, then it should rebound back toward the previous high.
$BTC #BTC☀ #BTC走势分析
The current price has already bounced back up. The long upper wick marks the short sellers’ take-profit point.
When that candlestick engulfs the previous one—and it’s a big candlestick—the market has already reversed.
I entered a long position at market price directly at 78570. I entered that way because I was impatient, but I knew that the prior low wouldn’t be broken, so I went in directly.
Right now the market is moving up. I’m looking at its structure using a big channel. If you ask me what the current trend is like, I can only say to focus on the channel first. What you can see now is a very clean breakout candlestick. This candlestick is dangerous because its bottom has no pullback at all—it's a very strong bullish candlestick. I don’t know whether the top of the channel can hold.
Market analysis:
In the short term, 80000 (around that area) is the primary resistance level. If it holds, then the next possible drop is very likely not to break the previous low.
In the medium term, it’s mainly about Bitcoin’s EMA. If it breaks below or touches it, then it should rebound back toward the previous high.
$BTC #BTC☀ #BTC走势分析
When that candlestick engulfs the previous one—and it’s a big candlestick—the market has already reversed.
I entered a long position at market price directly at 78570. I entered that way because I was impatient, but I knew that the prior low wouldn’t be broken, so I went in directly.
Right now the market is moving up. I’m looking at its structure using a big channel. If you ask me what the current trend is like, I can only say to focus on the channel first. What you can see now is a very clean breakout candlestick. This candlestick is dangerous because its bottom has no pullback at all—it's a very strong bullish candlestick. I don’t know whether the top of the channel can hold.
Market analysis:
In the short term, 80000 (around that area) is the primary resistance level. If it holds, then the next possible drop is very likely not to break the previous low.
In the medium term, it’s mainly about Bitcoin’s EMA. If it breaks below or touches it, then it should rebound back toward the previous high.
$BTC #BTC☀ #BTC走势分析
1
1.2k
·
--
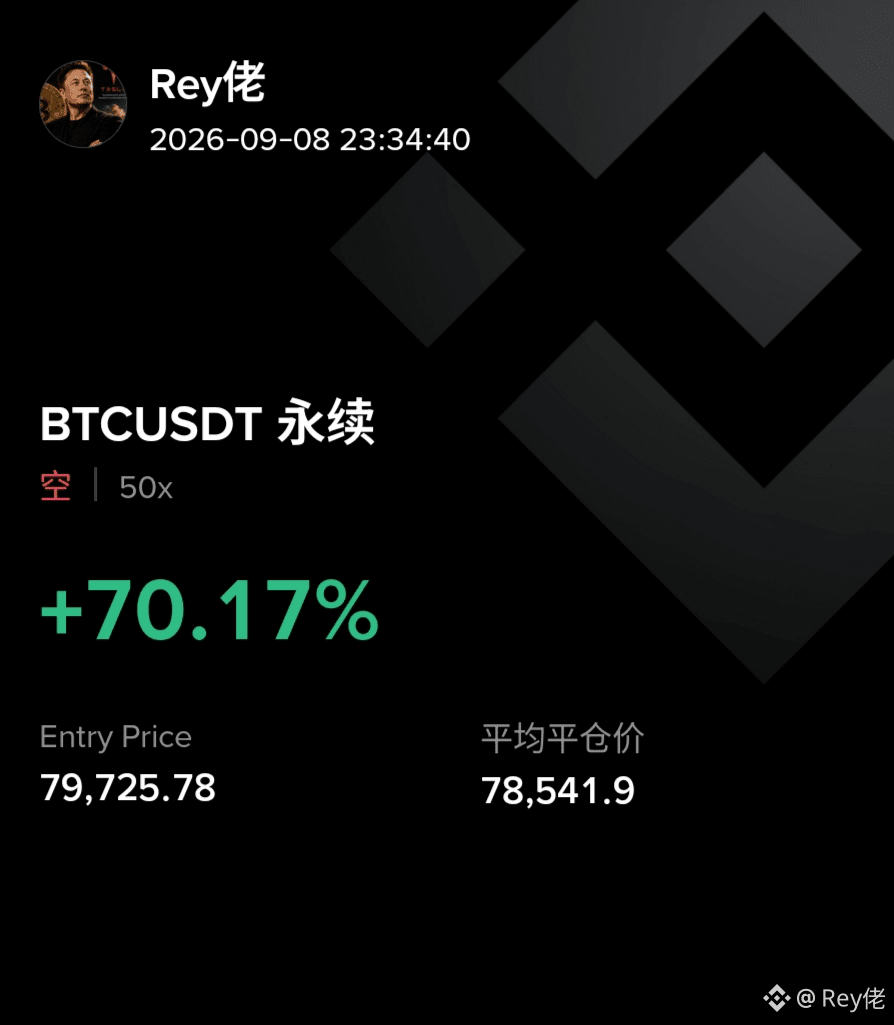
Damn it, I cut the loss, and only made 70%
Greed—there’s no reason to change my original take-profit approach. I thought it would reach 77,000, so I set 77,500 just in case, but it never even got there. I’m fed up.
When I saw that big K-line, it had already bounced back—$BTC #BTC☀
Damn it, I cut the loss, and only made 70%
Greed—there’s no reason to change my original take-profit approach. I thought it would reach 77,000, so I set 77,500 just in case, but it never even got there. I’m fed up.
When I saw that big K-line, it had already bounced back—$BTC #BTC☀
Greed—there’s no reason to change my original take-profit approach. I thought it would reach 77,000, so I set 77,500 just in case, but it never even got there. I’m fed up.
When I saw that big K-line, it had already bounced back—$BTC #BTC☀
232
·
--
Bearish
Just look—has it broken down? Now the price has reached the most interesting part: the short-side (bear) take-profit/exit signal has appeared around 77,000. But will the long side give an opportunity? Next, we need to watch the direction.
The bear exit signal appeared near the broken support level. However, it hasn’t been confirmed yet—this is only the initial pattern.
I’ve been bearish since 80,850, and we’ve already moved a fair distance from there. The shorts’ profits up above are also pretty good. It’s just that at this level, they can’t wipe out a large number of long positions yet—so I think the price will continue to probe lower.
Short-term market analysis: After breaking support, it will test the previous explosive breakout level. So 77,000 is very likely to be the final bear exit point (if the bear signal is confirmed).
Medium-term outlook: It’s a rebound, rebounding back toward the previous high.
$BTC #比特币走势分析
{spot}(BTCUSDT)
Just look—has it broken down? Now the price has reached the most interesting part: the short-side (bear) take-profit/exit signal has appeared around 77,000. But will the long side give an opportunity? Next, we need to watch the direction.
The bear exit signal appeared near the broken support level. However, it hasn’t been confirmed yet—this is only the initial pattern.
I’ve been bearish since 80,850, and we’ve already moved a fair distance from there. The shorts’ profits up above are also pretty good. It’s just that at this level, they can’t wipe out a large number of long positions yet—so I think the price will continue to probe lower.
Short-term market analysis: After breaking support, it will test the previous explosive breakout level. So 77,000 is very likely to be the final bear exit point (if the bear signal is confirmed).
Medium-term outlook: It’s a rebound, rebounding back toward the previous high.
$BTC #比特币走势分析
The bear exit signal appeared near the broken support level. However, it hasn’t been confirmed yet—this is only the initial pattern.
I’ve been bearish since 80,850, and we’ve already moved a fair distance from there. The shorts’ profits up above are also pretty good. It’s just that at this level, they can’t wipe out a large number of long positions yet—so I think the price will continue to probe lower.
Short-term market analysis: After breaking support, it will test the previous explosive breakout level. So 77,000 is very likely to be the final bear exit point (if the bear signal is confirmed).
Medium-term outlook: It’s a rebound, rebounding back toward the previous high.
$BTC #比特币走势分析
1
631
·
--
Bearish
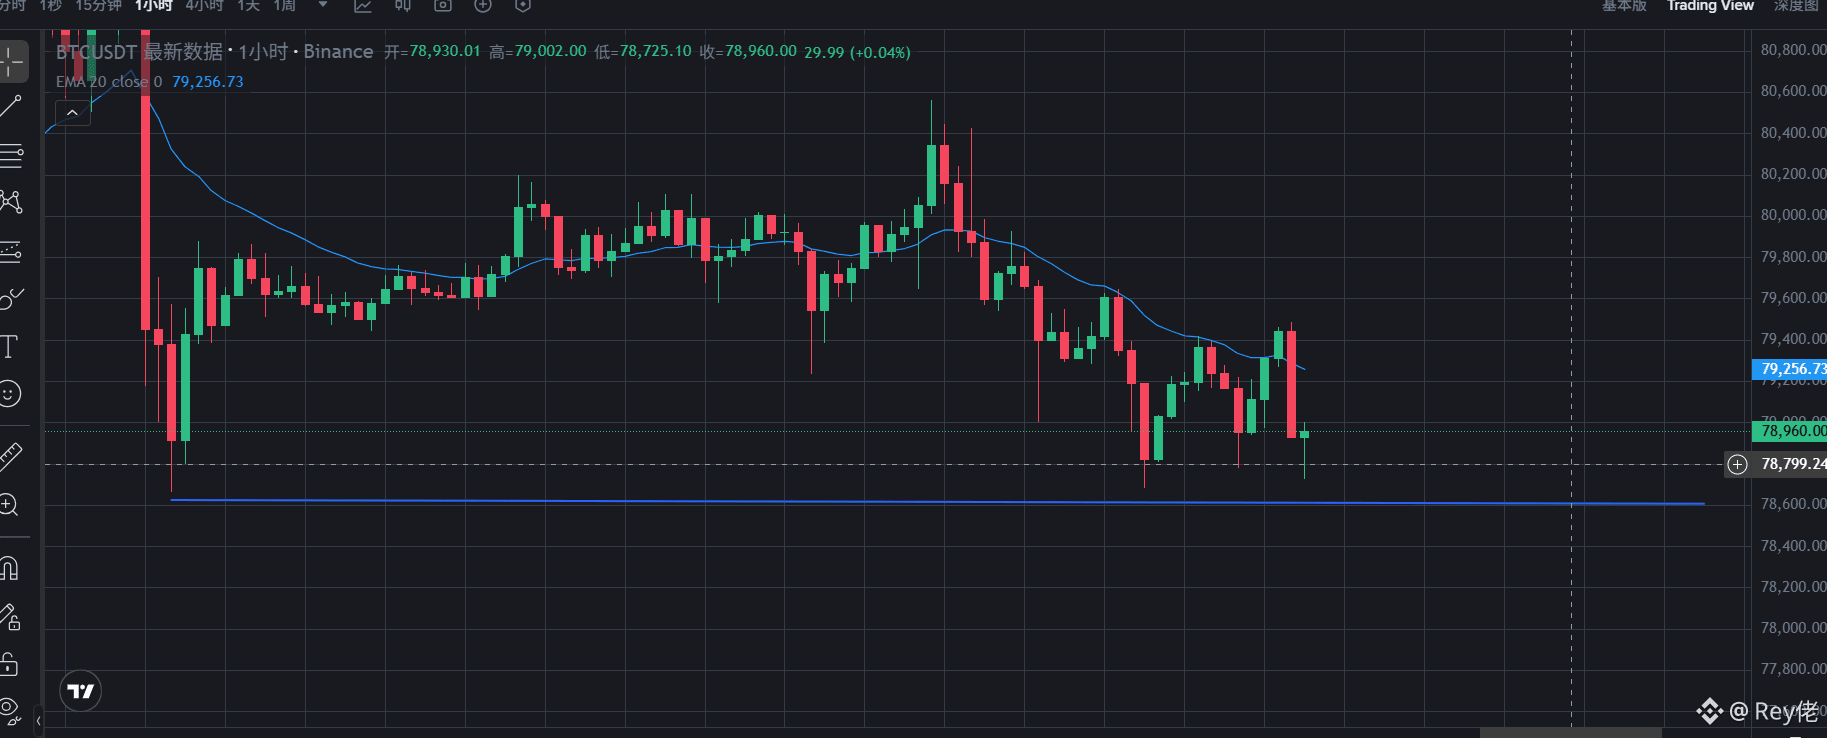
Many people think it's a double-bottom and will reverse, but look—no matter how hard the bulls push at that bottom, the bears easily pull it back, so it's likely that support won't hold. It may start out strong, but toward the end it becomes weaker and weaker.
The bears don’t have much time left. Right now, it’s still before the head—it's only missing a right shoulder before a major pullback starts.
Price analysis: In the short term, it’s still mainly bearish, but the bearish move is also coming to an end. Now we’re waiting for the bulls’ entry point (which is also the take-profit point for short positions).
For the medium term, there’s still likely another wave of upward movement. A break above the previous high will probably be difficult, but around that previous high there may still be a chance.
Waiting for the short take-profit signal and the long entry signal...
$BTC #BTC走势分析
Many people think it's a double-bottom and will reverse, but look—no matter how hard the bulls push at that bottom, the bears easily pull it back, so it's likely that support won't hold. It may start out strong, but toward the end it becomes weaker and weaker.
The bears don’t have much time left. Right now, it’s still before the head—it's only missing a right shoulder before a major pullback starts.
Price analysis: In the short term, it’s still mainly bearish, but the bearish move is also coming to an end. Now we’re waiting for the bulls’ entry point (which is also the take-profit point for short positions).
For the medium term, there’s still likely another wave of upward movement. A break above the previous high will probably be difficult, but around that previous high there may still be a chance.
Waiting for the short take-profit signal and the long entry signal...
$BTC #BTC走势分析
The bears don’t have much time left. Right now, it’s still before the head—it's only missing a right shoulder before a major pullback starts.
Price analysis: In the short term, it’s still mainly bearish, but the bearish move is also coming to an end. Now we’re waiting for the bulls’ entry point (which is also the take-profit point for short positions).
For the medium term, there’s still likely another wave of upward movement. A break above the previous high will probably be difficult, but around that previous high there may still be a chance.
Waiting for the short take-profit signal and the long entry signal...
$BTC #BTC走势分析
1.7k
·
--
Bearish
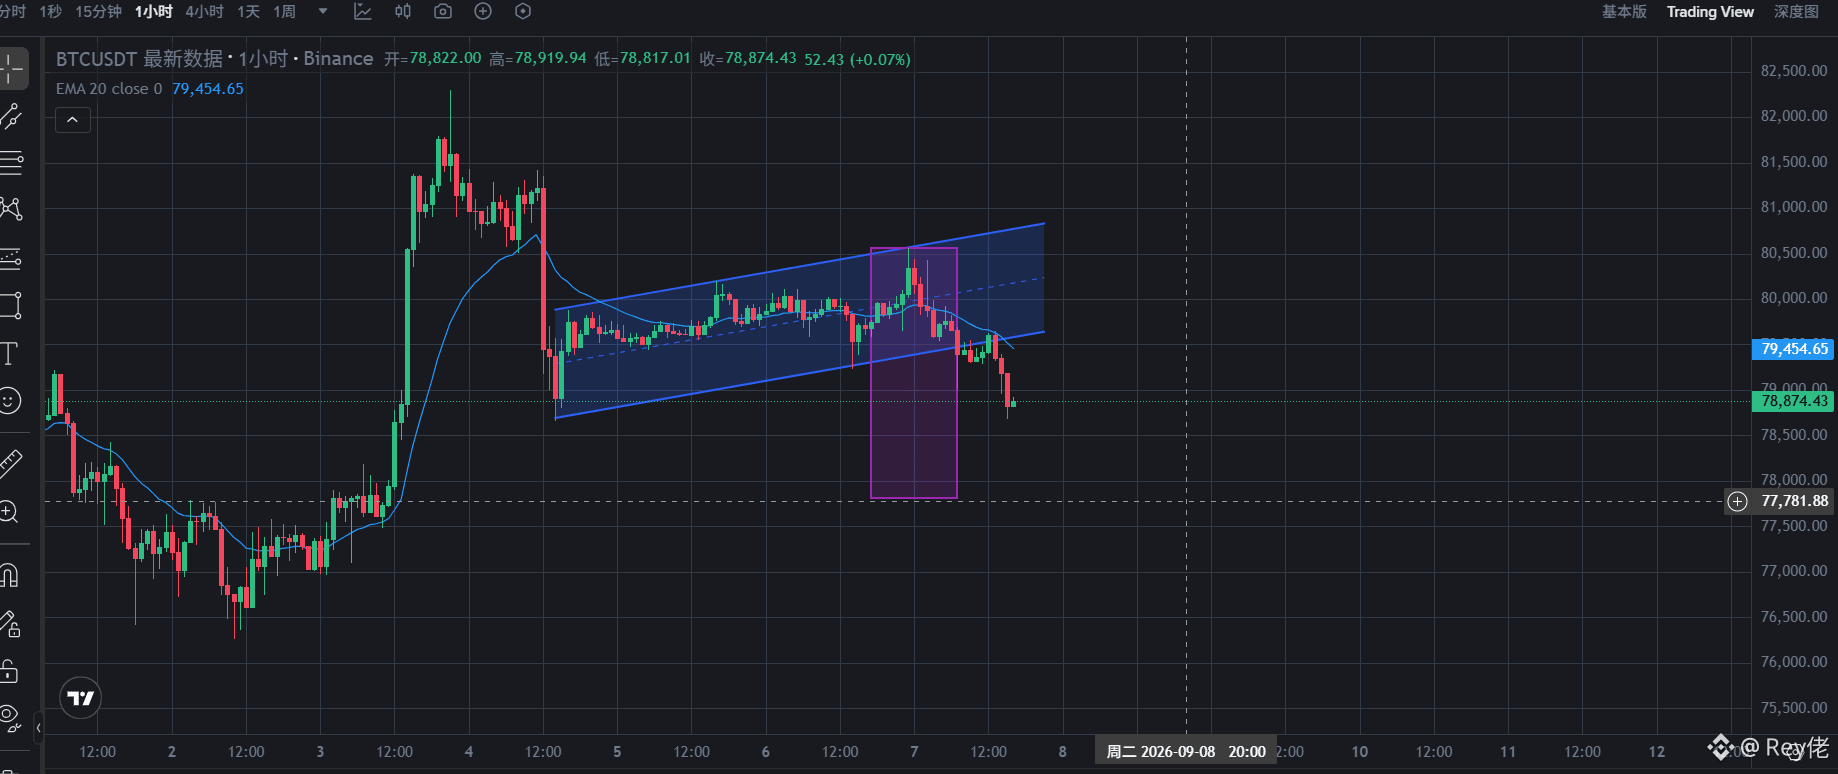
If someone asks me, “Can I still enter at the current price?”
I can only say, you can enter anytime. It’s just whether you accept taking stop-loss, and whether you can accept a very poor risk-reward ratio.
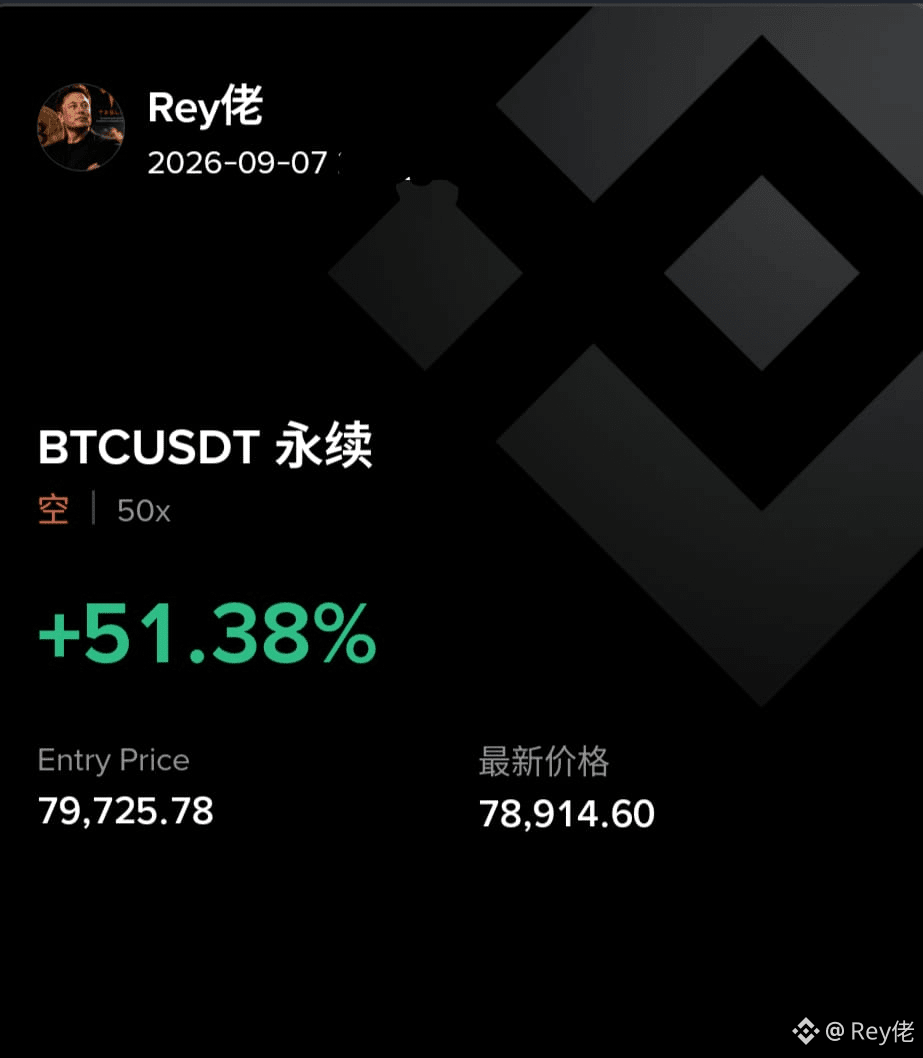
Some people say, “Why did you leave when you only made so little at the initial entry point?” That’s because the funding fee and trading commissions add up too expensively.
Also, the market has been ranging for too long. So I decided to exit first and wait for a signal before entering again. Earlier, I said that for the shorts to recover the trend, they would need a big bearish candle—and it really did drop hard. I immediately went short right under that move.
And once the price breaks the channel, it won’t bounce back that quickly.
Market analysis: After breaking the channel, we’re currently in the middle phase. Now we’re waiting for signals to see how far the shorts can push and where the take-profit levels are.
Meanwhile, the bulls are watching to see whether the previous low can hold as support. Both sides are waiting for a signal.
At the moment, the shorts are still dominating the market. My initial estimate is that if the bulls fail and then join the shorts, the price can reach 77,850—but we still need more signals to confirm.
$BTC #比特币走势分析 #bitcoin
If someone asks me, “Can I still enter at the current price?”
I can only say, you can enter anytime. It’s just whether you accept taking stop-loss, and whether you can accept a very poor risk-reward ratio.
Some people say, “Why did you leave when you only made so little at the initial entry point?” That’s because the funding fee and trading commissions add up too expensively.
Also, the market has been ranging for too long. So I decided to exit first and wait for a signal before entering again. Earlier, I said that for the shorts to recover the trend, they would need a big bearish candle—and it really did drop hard. I immediately went short right under that move.
And once the price breaks the channel, it won’t bounce back that quickly.
Market analysis: After breaking the channel, we’re currently in the middle phase. Now we’re waiting for signals to see how far the shorts can push and where the take-profit levels are.
Meanwhile, the bulls are watching to see whether the previous low can hold as support. Both sides are waiting for a signal.
At the moment, the shorts are still dominating the market. My initial estimate is that if the bulls fail and then join the shorts, the price can reach 77,850—but we still need more signals to confirm.
$BTC #比特币走势分析 #bitcoin
I can only say, you can enter anytime. It’s just whether you accept taking stop-loss, and whether you can accept a very poor risk-reward ratio.
Some people say, “Why did you leave when you only made so little at the initial entry point?” That’s because the funding fee and trading commissions add up too expensively.
Also, the market has been ranging for too long. So I decided to exit first and wait for a signal before entering again. Earlier, I said that for the shorts to recover the trend, they would need a big bearish candle—and it really did drop hard. I immediately went short right under that move.
And once the price breaks the channel, it won’t bounce back that quickly.
Market analysis: After breaking the channel, we’re currently in the middle phase. Now we’re waiting for signals to see how far the shorts can push and where the take-profit levels are.
Meanwhile, the bulls are watching to see whether the previous low can hold as support. Both sides are waiting for a signal.
At the moment, the shorts are still dominating the market. My initial estimate is that if the bulls fail and then join the shorts, the price can reach 77,850—but we still need more signals to confirm.
$BTC #比特币走势分析 #bitcoin
552
·
--
Bearish
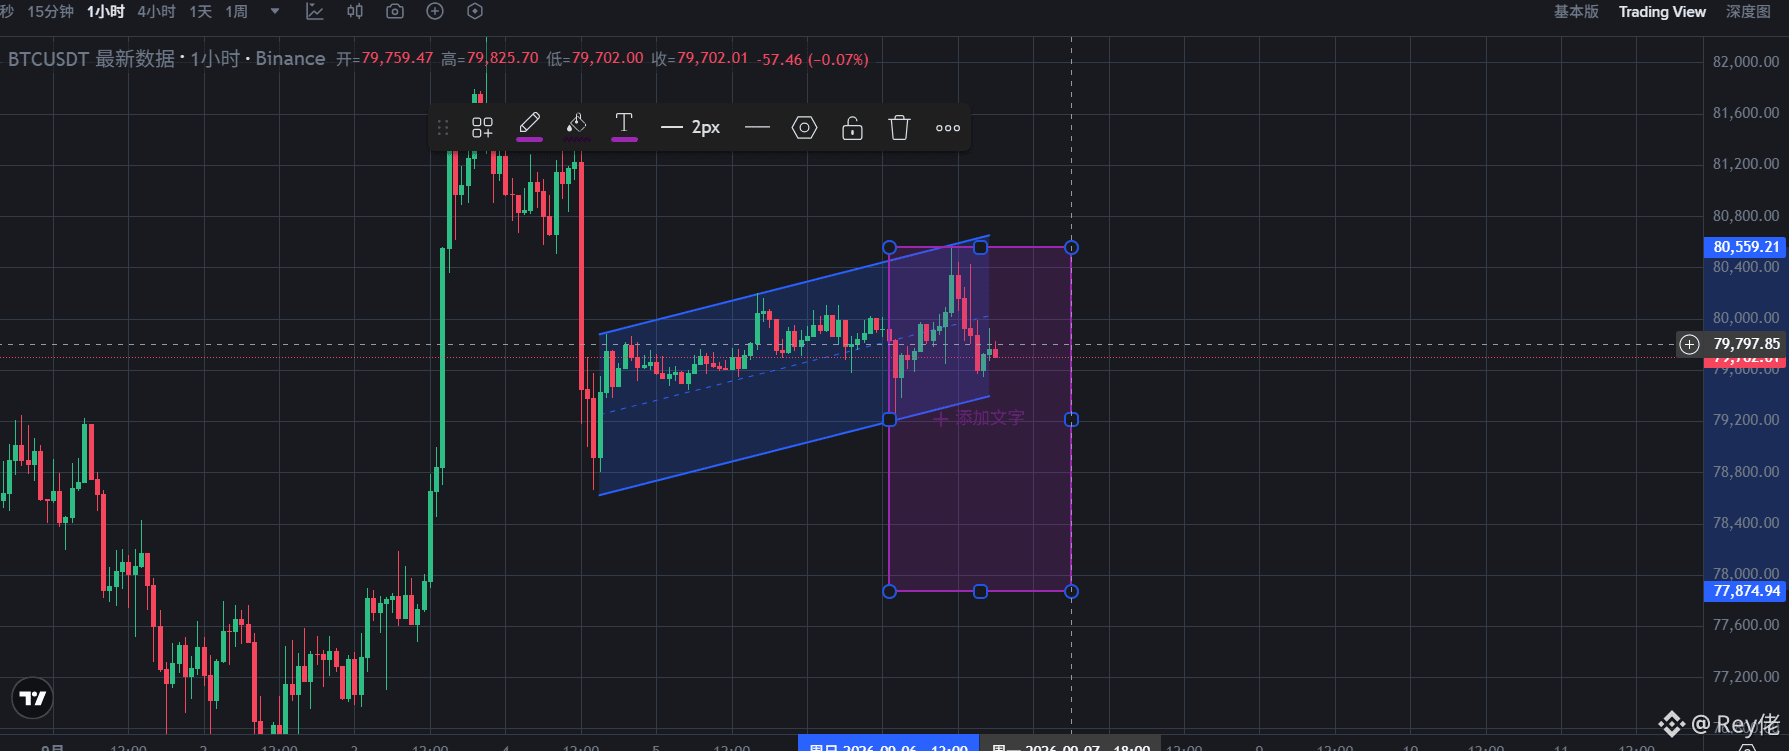
77850 Look! The rising channel can’t hold anymore, a head-and-shoulders top has formed, and short positions are back in.
Although the rebound within this channel was slightly stronger than expected, the overall trend has not changed at all.
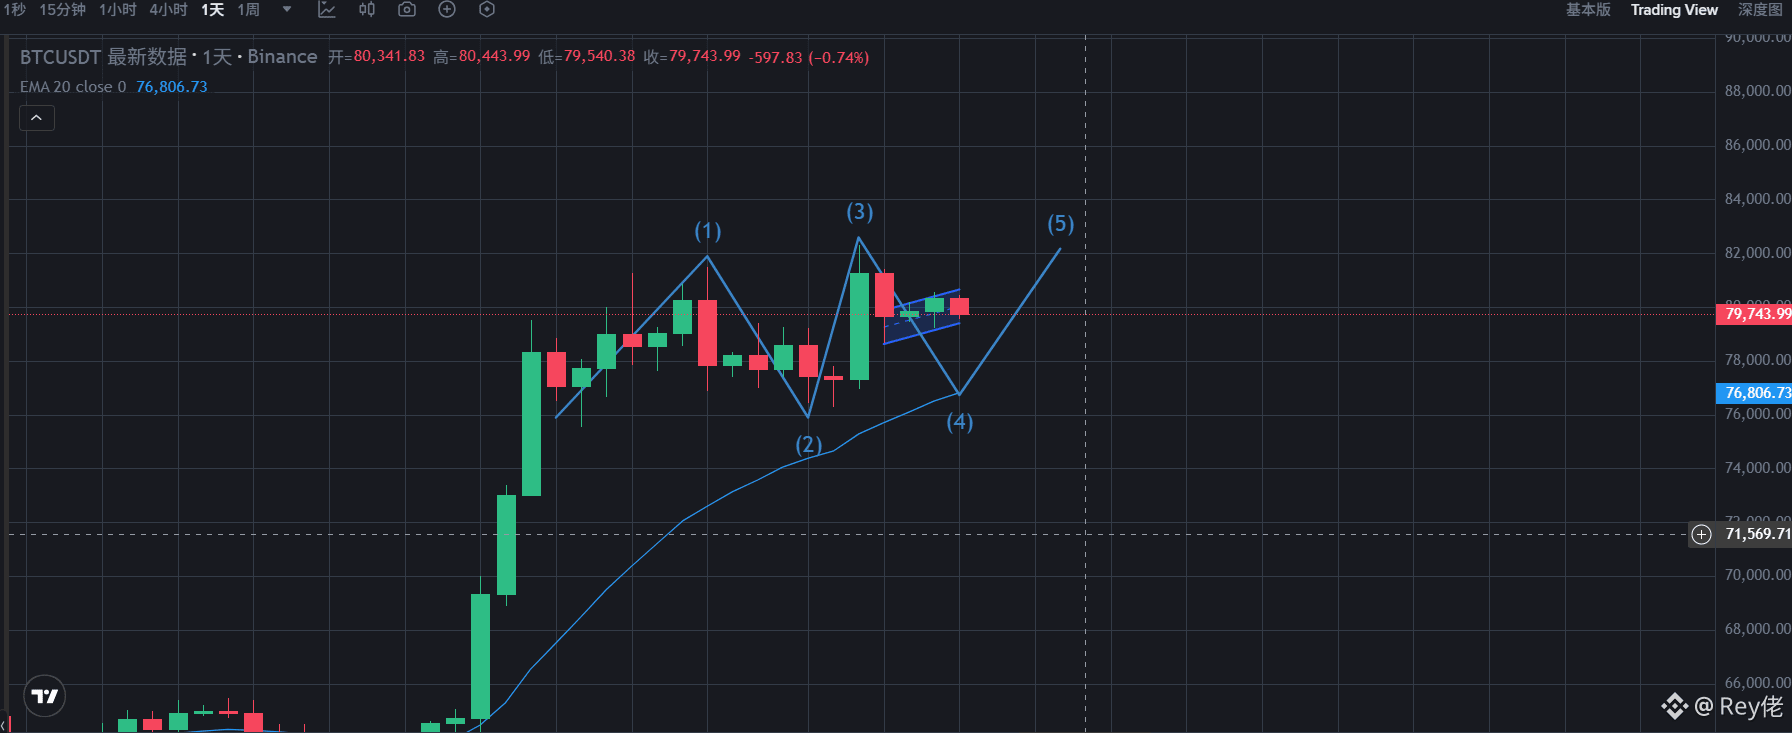
The daily-level EMA pullback demand is strong, and the 4-hour head-and-shoulders top structure is already clear.
This sideways move is just exhausting the last bit of rebound momentum from the bulls; once the lower boundary of the channel breaks, an accelerated drop can happen at any time.
Specific trade outlook:
Logic confluence: right-shoulder resistance of the head-and-shoulders top + daily EMA pullback attraction + expected break below the lower channel boundary
Take-profit target: ABCD structure target, with the first take-profit moved down to around 77,850
Risk control: if it breaks out with volume and holds above the upper channel line (around 80,550), the short-side logic is invalid
The daily pullback is inevitable$BTC
#BTC走势分析 #比特币
77850 Look! The rising channel can’t hold anymore, a head-and-shoulders top has formed, and short positions are back in.
Although the rebound within this channel was slightly stronger than expected, the overall trend has not changed at all.
The daily-level EMA pullback demand is strong, and the 4-hour head-and-shoulders top structure is already clear.
This sideways move is just exhausting the last bit of rebound momentum from the bulls; once the lower boundary of the channel breaks, an accelerated drop can happen at any time.
Specific trade outlook:
Logic confluence: right-shoulder resistance of the head-and-shoulders top + daily EMA pullback attraction + expected break below the lower channel boundary
Take-profit target: ABCD structure target, with the first take-profit moved down to around 77,850
Risk control: if it breaks out with volume and holds above the upper channel line (around 80,550), the short-side logic is invalid
The daily pullback is inevitable$BTC
#BTC走势分析 #比特币
Although the rebound within this channel was slightly stronger than expected, the overall trend has not changed at all.
The daily-level EMA pullback demand is strong, and the 4-hour head-and-shoulders top structure is already clear.
This sideways move is just exhausting the last bit of rebound momentum from the bulls; once the lower boundary of the channel breaks, an accelerated drop can happen at any time.
Specific trade outlook:
Logic confluence: right-shoulder resistance of the head-and-shoulders top + daily EMA pullback attraction + expected break below the lower channel boundary
Take-profit target: ABCD structure target, with the first take-profit moved down to around 77,850
Risk control: if it breaks out with volume and holds above the upper channel line (around 80,550), the short-side logic is invalid
The daily pullback is inevitable$BTC
#BTC走势分析 #比特币
266
·
--
Stopped out, couldn’t make even 1%, but it’s fine — strict stop-loss is necessary $BTC #比特币走势分析 #比特币
In the crypto market, it’s not about never losing; it’s about losing less and making more
The risks were already mentioned before. It has been consolidating for too long, and the bulls can very easily take over the market
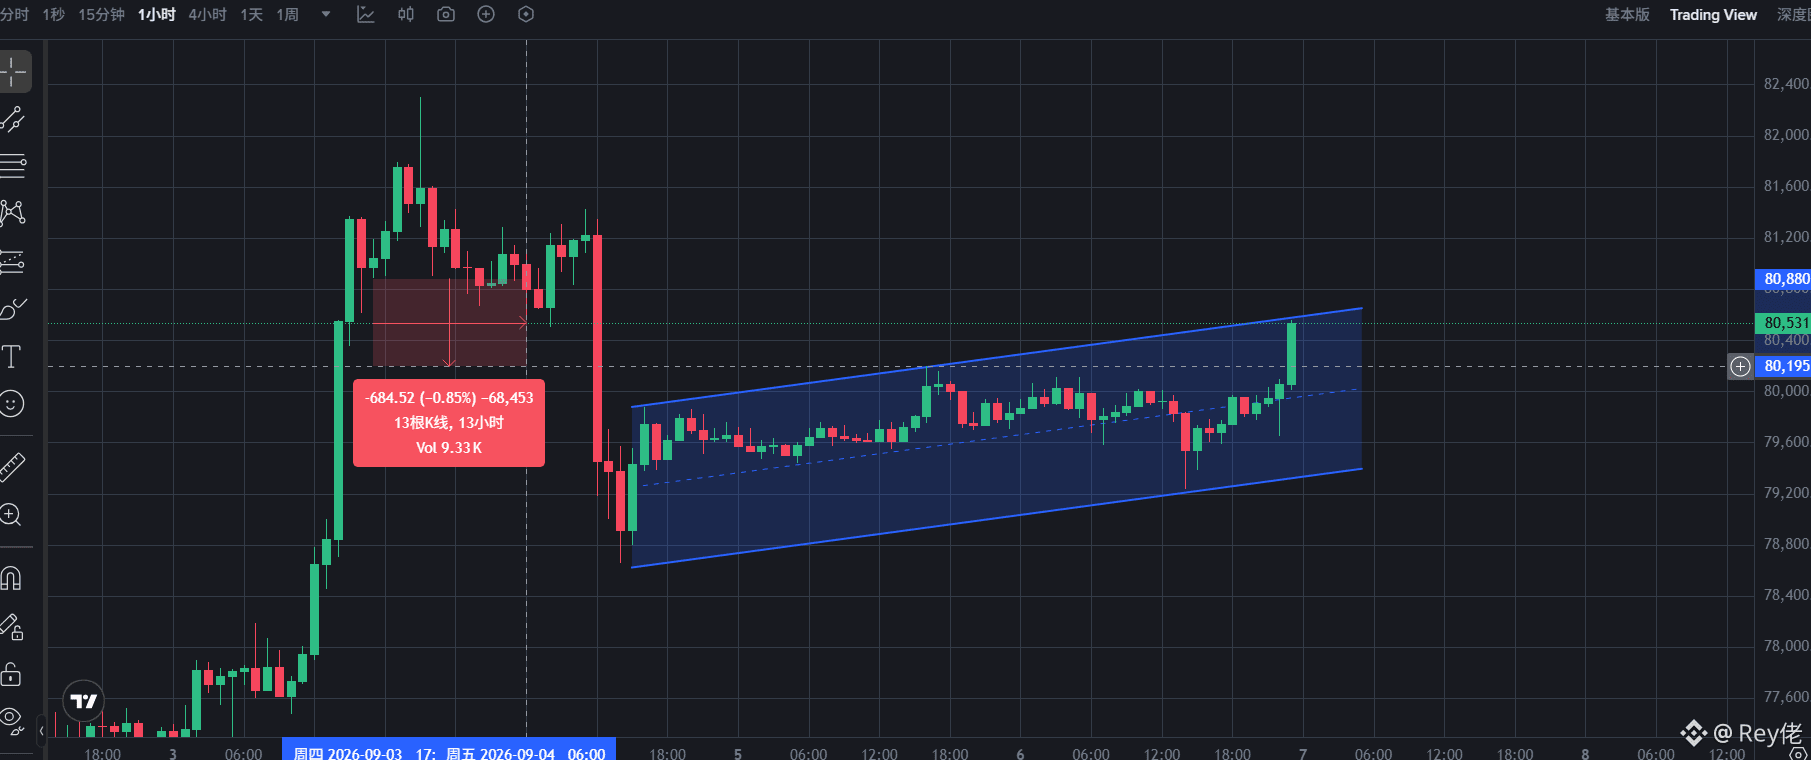
Short term: the bears are very weak right now. If they want to restore the trend, a big bearish candle needs to appear to once again absorb all those gains, but that’s difficult because the price has already rejected further declines twice. The only advantage is that the price is still inside the channel right now (bear flag), so the bulls have a certain chance of failing
Long term: the top of the range is very hard to break through. Right now, it’s difficult even to test 82500. To break through, it must first hold above 82500, so later on it will most likely return below 70000
Stopped out, couldn’t make even 1%, but it’s fine — strict stop-loss is necessary $BTC #比特币走势分析 #比特币
In the crypto market, it’s not about never losing; it’s about losing less and making more
The risks were already mentioned before. It has been consolidating for too long, and the bulls can very easily take over the market
Short term: the bears are very weak right now. If they want to restore the trend, a big bearish candle needs to appear to once again absorb all those gains, but that’s difficult because the price has already rejected further declines twice. The only advantage is that the price is still inside the channel right now (bear flag), so the bulls have a certain chance of failing
Long term: the top of the range is very hard to break through. Right now, it’s difficult even to test 82500. To break through, it must first hold above 82500, so later on it will most likely return below 70000
In the crypto market, it’s not about never losing; it’s about losing less and making more
The risks were already mentioned before. It has been consolidating for too long, and the bulls can very easily take over the market
Short term: the bears are very weak right now. If they want to restore the trend, a big bearish candle needs to appear to once again absorb all those gains, but that’s difficult because the price has already rejected further declines twice. The only advantage is that the price is still inside the channel right now (bear flag), so the bulls have a certain chance of failing
Long term: the top of the range is very hard to break through. Right now, it’s difficult even to test 82500. To break through, it must first hold above 82500, so later on it will most likely return below 70000
359
·
--
Bearish
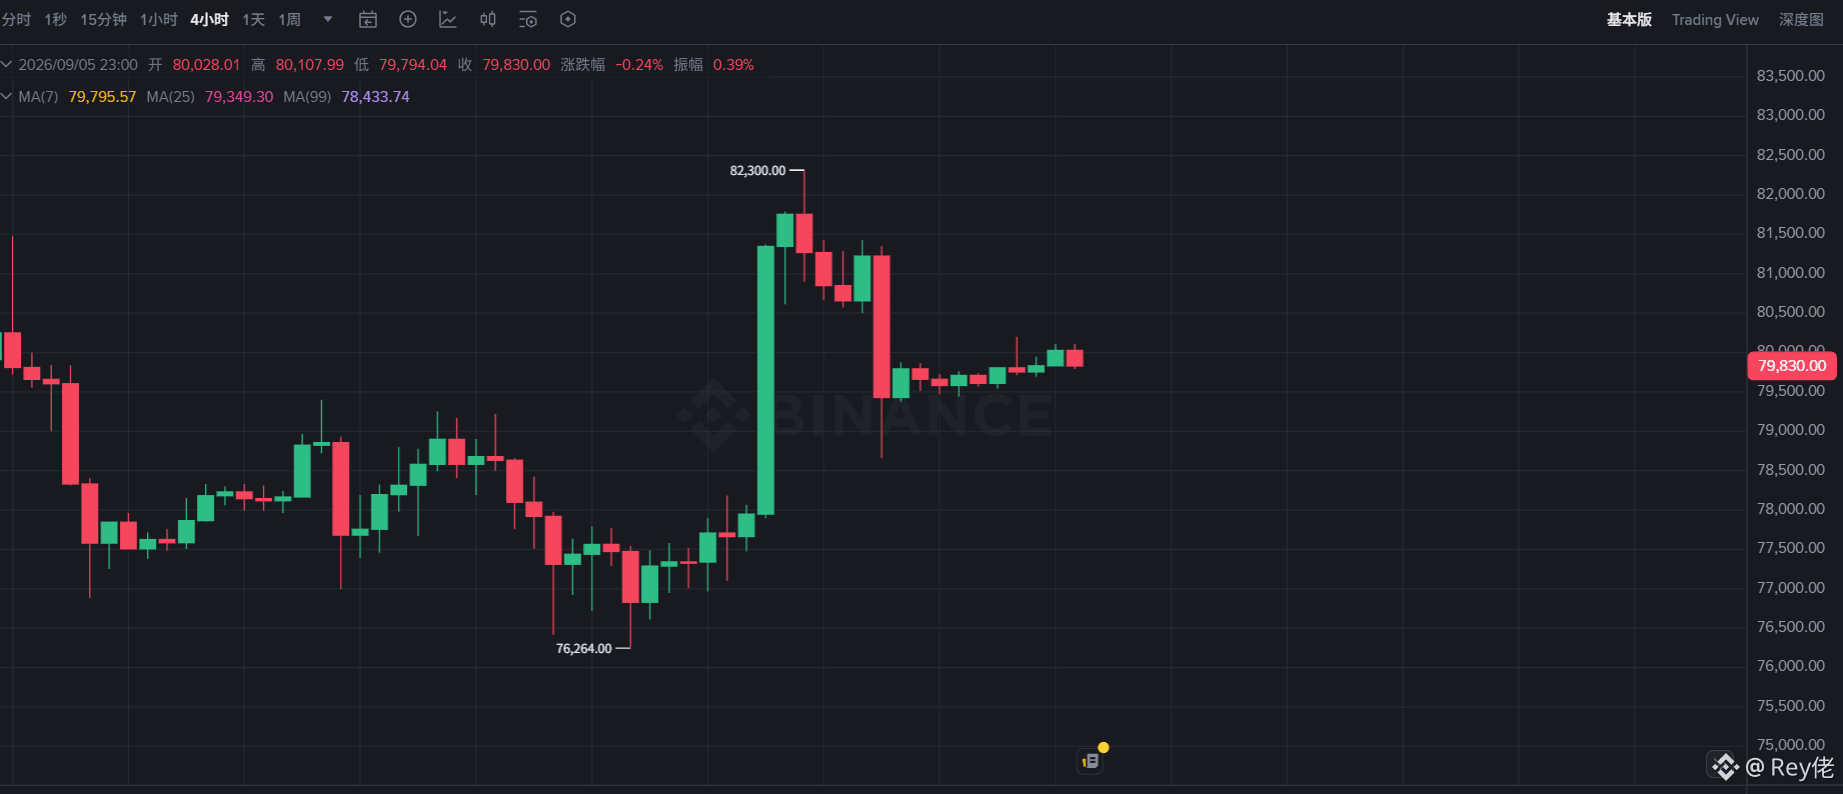
At present, it looks increasingly difficult for Bitcoin to drop directly to 76500.
My original expectation was: after a large bearish candle dumped the price, there would be a small rebound, followed by bears quickly stepping in again to continue testing the key support below. $BTC #比特币走势分析 #比特币 #bitcoin
But the problem now is that the sideways movement has lasted too long.
Originally, bears could have used the momentum created by that large bearish candle to make a decisive move to test the support below, but now the downward momentum is being gradually diluted by time.
So for the current structure, I am more inclined to see it shift from the original V-shaped decline into an ABCD structure.
And the area around 77500 will be a very critical level in this structure.
This is not only a potential take-profit zone for the ABCD pattern, but also the previous launch point; combined with overhead trapped positions and technical resistance, the pressure around 77500 will not be small.
So what truly deserves attention next is whether the first stop-loss at 80200 is not broken, and the second stop-loss at 80500 (if it is tested, then the downward trend is gone).
The 80800 entry point previously given is still in profit so far...
At present, it looks increasingly difficult for Bitcoin to drop directly to 76500.
My original expectation was: after a large bearish candle dumped the price, there would be a small rebound, followed by bears quickly stepping in again to continue testing the key support below. $BTC #比特币走势分析 #比特币 #bitcoin
But the problem now is that the sideways movement has lasted too long.
Originally, bears could have used the momentum created by that large bearish candle to make a decisive move to test the support below, but now the downward momentum is being gradually diluted by time.
So for the current structure, I am more inclined to see it shift from the original V-shaped decline into an ABCD structure.
And the area around 77500 will be a very critical level in this structure.
This is not only a potential take-profit zone for the ABCD pattern, but also the previous launch point; combined with overhead trapped positions and technical resistance, the pressure around 77500 will not be small.
So what truly deserves attention next is whether the first stop-loss at 80200 is not broken, and the second stop-loss at 80500 (if it is tested, then the downward trend is gone).
The 80800 entry point previously given is still in profit so far...
My original expectation was: after a large bearish candle dumped the price, there would be a small rebound, followed by bears quickly stepping in again to continue testing the key support below. $BTC #比特币走势分析 #比特币 #bitcoin
But the problem now is that the sideways movement has lasted too long.
Originally, bears could have used the momentum created by that large bearish candle to make a decisive move to test the support below, but now the downward momentum is being gradually diluted by time.
So for the current structure, I am more inclined to see it shift from the original V-shaped decline into an ABCD structure.
And the area around 77500 will be a very critical level in this structure.
This is not only a potential take-profit zone for the ABCD pattern, but also the previous launch point; combined with overhead trapped positions and technical resistance, the pressure around 77500 will not be small.
So what truly deserves attention next is whether the first stop-loss at 80200 is not broken, and the second stop-loss at 80500 (if it is tested, then the downward trend is gone).
The 80800 entry point previously given is still in profit so far...
2
1.2k
·
--
Bearish
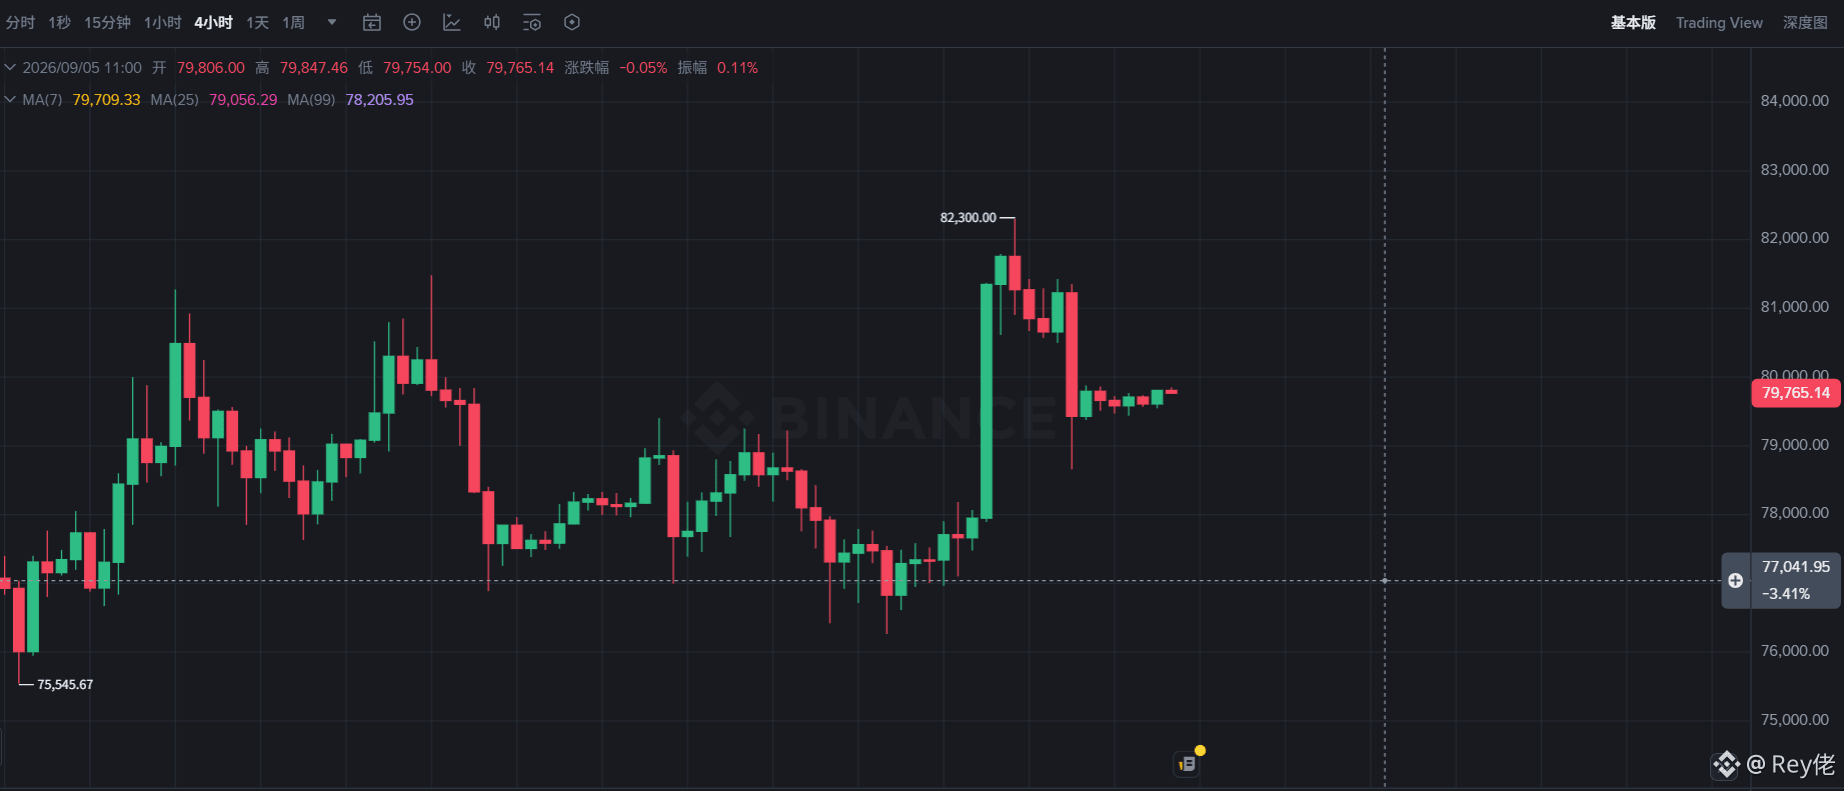
Bitcoin is currently hovering around 79,800. Originally, I thought it would go straight down, but now it looks like it wants to consolidate. $BTC #比特币走势分析 #比特币
There are currently two directions: either challenge 76,550-77,000 or test the resistance above again (I’m leaning toward the downside)
Why?
First, because of the momentum of that large K-line, the bulls were unable to challenge, break through, or engulf that big bearish candle.
Second, it is possible to prove that the bears are weak, but there is a gap at 80,500 unless this rebound can test it.
Third, after the big bearish candle, there has been a lot of consolidation, which is a typical bear flag.
Key levels to watch: 80,500 is the level for filling the gap, 81,500 is where the bulls take control of the market, and 76,550 is an important support level (also the take-profit point)
Bitcoin is currently hovering around 79,800. Originally, I thought it would go straight down, but now it looks like it wants to consolidate. $BTC #比特币走势分析 #比特币
There are currently two directions: either challenge 76,550-77,000 or test the resistance above again (I’m leaning toward the downside)
Why?
First, because of the momentum of that large K-line, the bulls were unable to challenge, break through, or engulf that big bearish candle.
Second, it is possible to prove that the bears are weak, but there is a gap at 80,500 unless this rebound can test it.
Third, after the big bearish candle, there has been a lot of consolidation, which is a typical bear flag.
Key levels to watch: 80,500 is the level for filling the gap, 81,500 is where the bulls take control of the market, and 76,550 is an important support level (also the take-profit point)
There are currently two directions: either challenge 76,550-77,000 or test the resistance above again (I’m leaning toward the downside)
Why?
First, because of the momentum of that large K-line, the bulls were unable to challenge, break through, or engulf that big bearish candle.
Second, it is possible to prove that the bears are weak, but there is a gap at 80,500 unless this rebound can test it.
Third, after the big bearish candle, there has been a lot of consolidation, which is a typical bear flag.
Key levels to watch: 80,500 is the level for filling the gap, 81,500 is where the bulls take control of the market, and 76,550 is an important support level (also the take-profit point)
1.3k
·
--
Bearish
Rey佬
·
--
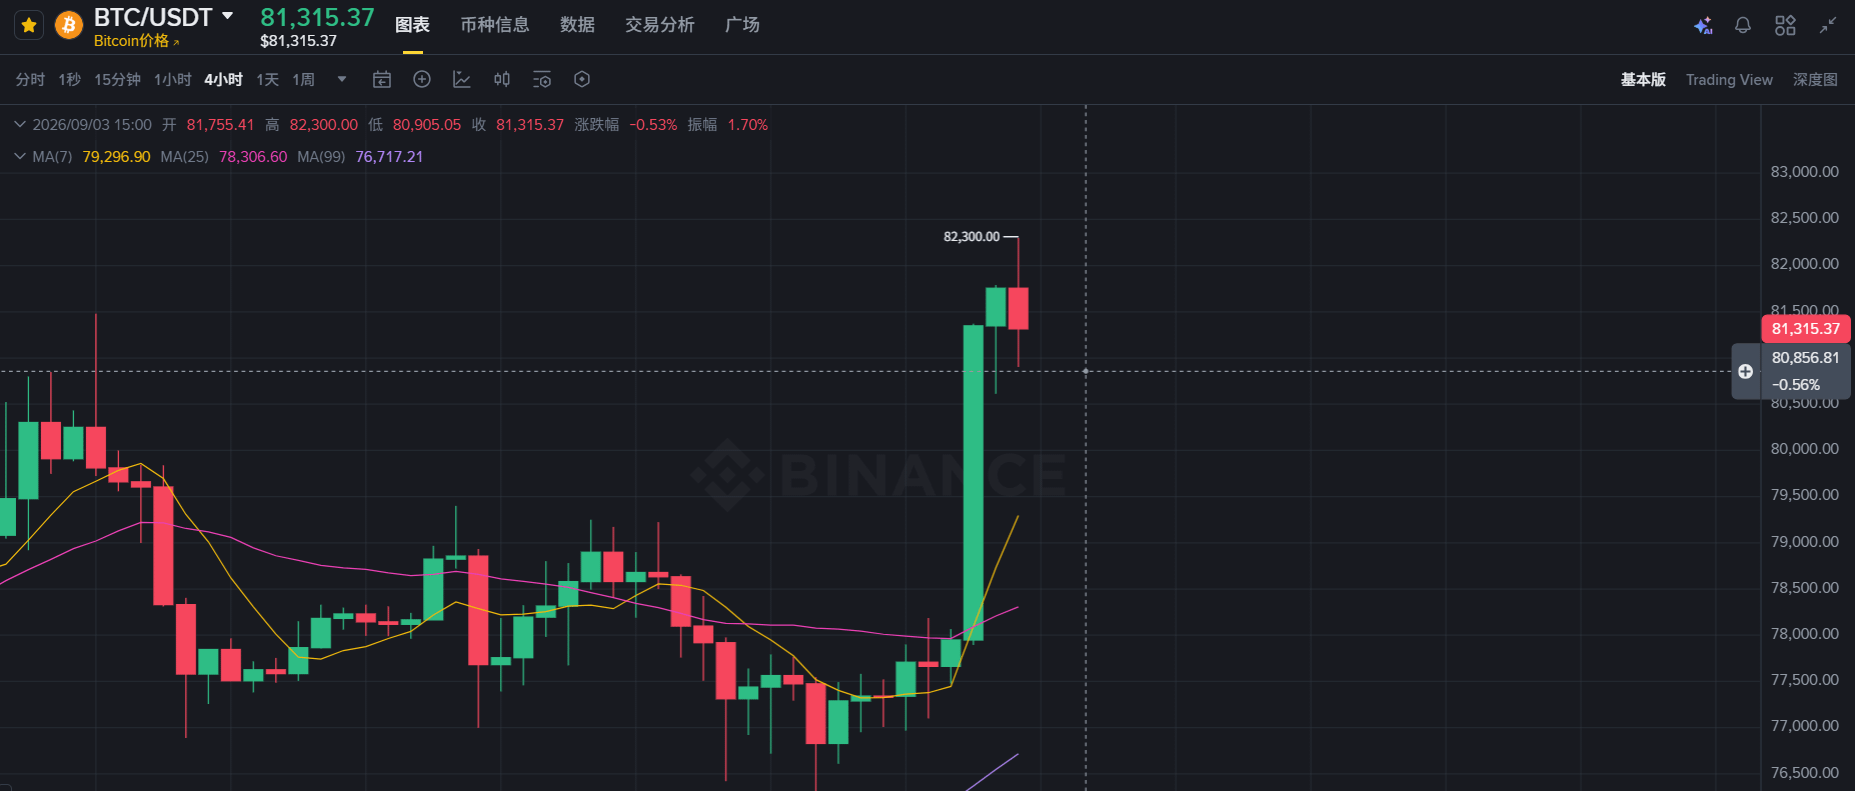
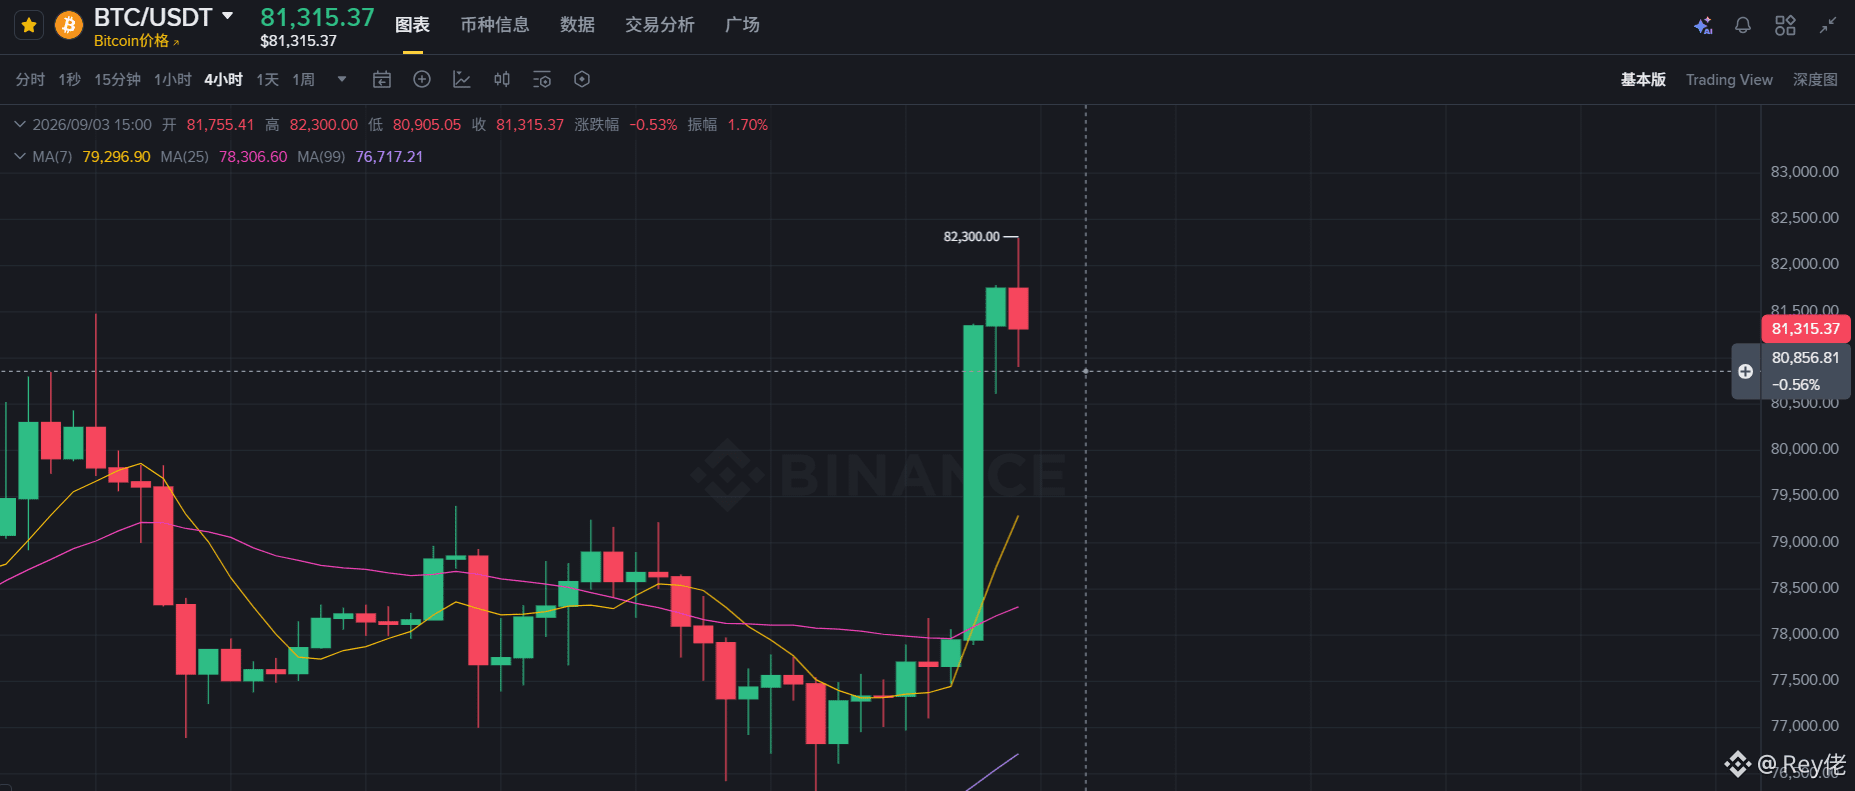
BearishThe double top has already formed. The most important level right now is a break below 80800. If it breaks below and closes below it, then most likely it will be dumped downwards for #比特币 #BTC走势分析
This is what I mentioned earlier: the double top is testing resistance (I suspect it will fail).
Some people will say that with a candle this big, it looks like it must be bullish. But I’m saying that “up” is possible only if it can reclaim and hold above 82500; otherwise it’s hard.
Right now, if it breaks below 80800, it will go test the breakout starting point. If it fails to break, then the trend is likely to push up toward 83000. But if it holds above, then hitting 100,000 is easy.
I plan to short around below 80850, with a stop loss placed above the high point.
This is what I mentioned earlier: the double top is testing resistance (I suspect it will fail).
Some people will say that with a candle this big, it looks like it must be bullish. But I’m saying that “up” is possible only if it can reclaim and hold above 82500; otherwise it’s hard.
Right now, if it breaks below 80800, it will go test the breakout starting point. If it fails to break, then the trend is likely to push up toward 83000. But if it holds above, then hitting 100,000 is easy.
I plan to short around below 80850, with a stop loss placed above the high point.
327
·
--
Bearish
The double top has already formed. The most important level right now is a break below 80800. If it breaks below and closes below it, then most likely it will be dumped downwards for #比特币 #BTC走势分析
This is what I mentioned earlier: the double top is testing resistance (I suspect it will fail).
Some people will say that with a candle this big, it looks like it must be bullish. But I’m saying that “up” is possible only if it can reclaim and hold above 82500; otherwise it’s hard.
Right now, if it breaks below 80800, it will go test the breakout starting point. If it fails to break, then the trend is likely to push up toward 83000. But if it holds above, then hitting 100,000 is easy.
I plan to short around below 80850, with a stop loss placed above the high point.
The double top has already formed. The most important level right now is a break below 80800. If it breaks below and closes below it, then most likely it will be dumped downwards for #比特币 #BTC走势分析
This is what I mentioned earlier: the double top is testing resistance (I suspect it will fail).
Some people will say that with a candle this big, it looks like it must be bullish. But I’m saying that “up” is possible only if it can reclaim and hold above 82500; otherwise it’s hard.
Right now, if it breaks below 80800, it will go test the breakout starting point. If it fails to break, then the trend is likely to push up toward 83000. But if it holds above, then hitting 100,000 is easy.
I plan to short around below 80850, with a stop loss placed above the high point.
This is what I mentioned earlier: the double top is testing resistance (I suspect it will fail).
Some people will say that with a candle this big, it looks like it must be bullish. But I’m saying that “up” is possible only if it can reclaim and hold above 82500; otherwise it’s hard.
Right now, if it breaks below 80800, it will go test the breakout starting point. If it fails to break, then the trend is likely to push up toward 83000. But if it holds above, then hitting 100,000 is easy.
I plan to short around below 80850, with a stop loss placed above the high point.
1
2k
·
--
Bearish
Bitcoin may now want to challenge the breakout again, but the resistance above is too strong, so the chances of a breakout are low.
Unless it can get above 82500
I hope it can test it and form a double top...
Bitcoin may now want to challenge the breakout again, but the resistance above is too strong, so the chances of a breakout are low.
Unless it can get above 82500
I hope it can test it and form a double top...
Unless it can get above 82500
I hope it can test it and form a double top...
1
339
·
--
Bearish
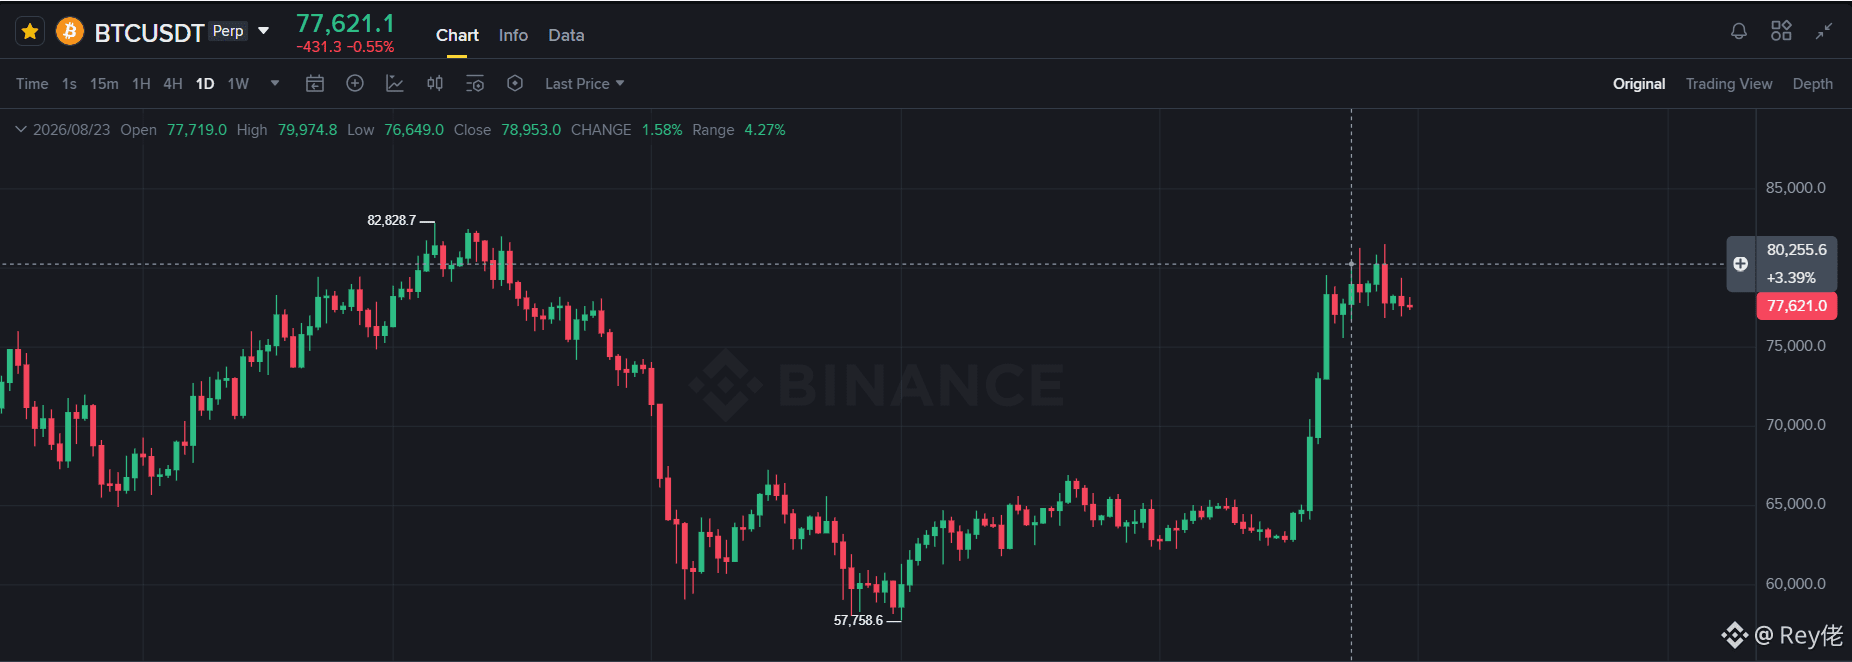
This K-line is currently in a breakout mode: #BTC走势分析
{spot}(BTCUSDT)
Some people will say, “Even a fool can see it.” They’ll argue that since there are such strong, consecutive bullish candles, no matter how you look at it, it should keep rising—but that’s not the case.
First of all, we’re currently in a trading range, and specifically at the top of that range. The main problem now is whether it will break out of the range or pull back to the bottom. You need to know that if it breaks out, it’s aiming to go toward the 100,000 threshold. And this trading range is only the second top—above it, the 83,000 resistance is very strong. Also, the weekly chart has given the signal “rejecting the doji”...
My view is that it will pull back to the bottom, but the possibility of making a fresh low is relatively small. Still, 63,000 is possible. The main reason is that this trading range is likely to form a head-and-shoulders bottom, and this big push is essentially wave—an inducement to lure traders.
Key signal: “If within 1 week it can strongly close below 76,000, then falling to around 63,000 is basically set. If the price can break above 82,500 and close there, then 100,000 should be reached quite easily.”
But the current signal is a breakout mode, while the weekly chart gives me a pullback signal—so personally, I’m leaning more toward a downside move.
This K-line is currently in a breakout mode: #BTC走势分析
Some people will say, “Even a fool can see it.” They’ll argue that since there are such strong, consecutive bullish candles, no matter how you look at it, it should keep rising—but that’s not the case.
First of all, we’re currently in a trading range, and specifically at the top of that range. The main problem now is whether it will break out of the range or pull back to the bottom. You need to know that if it breaks out, it’s aiming to go toward the 100,000 threshold. And this trading range is only the second top—above it, the 83,000 resistance is very strong. Also, the weekly chart has given the signal “rejecting the doji”...
My view is that it will pull back to the bottom, but the possibility of making a fresh low is relatively small. Still, 63,000 is possible. The main reason is that this trading range is likely to form a head-and-shoulders bottom, and this big push is essentially wave—an inducement to lure traders.
Key signal: “If within 1 week it can strongly close below 76,000, then falling to around 63,000 is basically set. If the price can break above 82,500 and close there, then 100,000 should be reached quite easily.”
But the current signal is a breakout mode, while the weekly chart gives me a pullback signal—so personally, I’m leaning more toward a downside move.
Some people will say, “Even a fool can see it.” They’ll argue that since there are such strong, consecutive bullish candles, no matter how you look at it, it should keep rising—but that’s not the case.
First of all, we’re currently in a trading range, and specifically at the top of that range. The main problem now is whether it will break out of the range or pull back to the bottom. You need to know that if it breaks out, it’s aiming to go toward the 100,000 threshold. And this trading range is only the second top—above it, the 83,000 resistance is very strong. Also, the weekly chart has given the signal “rejecting the doji”...
My view is that it will pull back to the bottom, but the possibility of making a fresh low is relatively small. Still, 63,000 is possible. The main reason is that this trading range is likely to form a head-and-shoulders bottom, and this big push is essentially wave—an inducement to lure traders.
Key signal: “If within 1 week it can strongly close below 76,000, then falling to around 63,000 is basically set. If the price can break above 82,500 and close there, then 100,000 should be reached quite easily.”
But the current signal is a breakout mode, while the weekly chart gives me a pullback signal—so personally, I’m leaning more toward a downside move.
1
1.4k
·
--
Damn, if you can play the game like this...
That’s enough—don’t ask. Keep going and look ahead.
Damn, if you can play the game like this...
That’s enough—don’t ask. Keep going and look ahead.
That’s enough—don’t ask. Keep going and look ahead.
1
1
411
·
--
Bearish
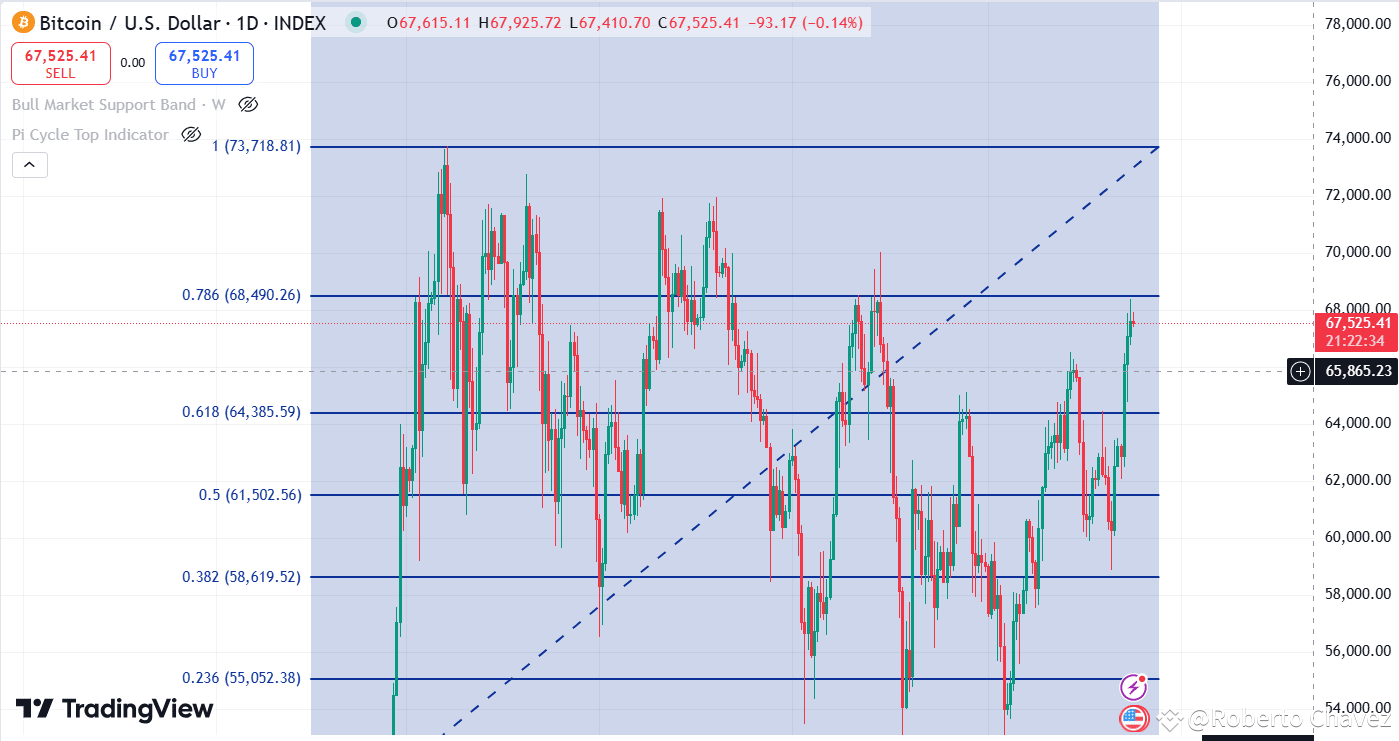
I thought you weren't going to arrive so early, but the way you arrived indicates that the fall is already forming, remember that each time you have to go through a big fall so you can keep flying...$BTC #BTC☀
{spot}(BTCUSDT)
I thought you weren't going to arrive so early, but the way you arrived indicates that the fall is already forming, remember that each time you have to go through a big fall so you can keep flying...$BTC #BTC☀
1
615
·
--
Bearish
The liquidation of that $300 million should be enough.
Now we have the final correction ahead of us, and if this time it stays above 60,900, we could be entering a real bull market. Although, honestly, I prefer it to go down to 55,000. (If today's close stays above 65,100, there may be another small pull before then.)
#BTCUptober
$BTC
{spot}(BTCUSDT)
The liquidation of that $300 million should be enough.
Now we have the final correction ahead of us, and if this time it stays above 60,900, we could be entering a real bull market. Although, honestly, I prefer it to go down to 55,000. (If today's close stays above 65,100, there may be another small pull before then.)
#BTCUptober
$BTC
Now we have the final correction ahead of us, and if this time it stays above 60,900, we could be entering a real bull market. Although, honestly, I prefer it to go down to 55,000. (If today's close stays above 65,100, there may be another small pull before then.)
#BTCUptober
$BTC
2
1.7k
·
--
Bearish
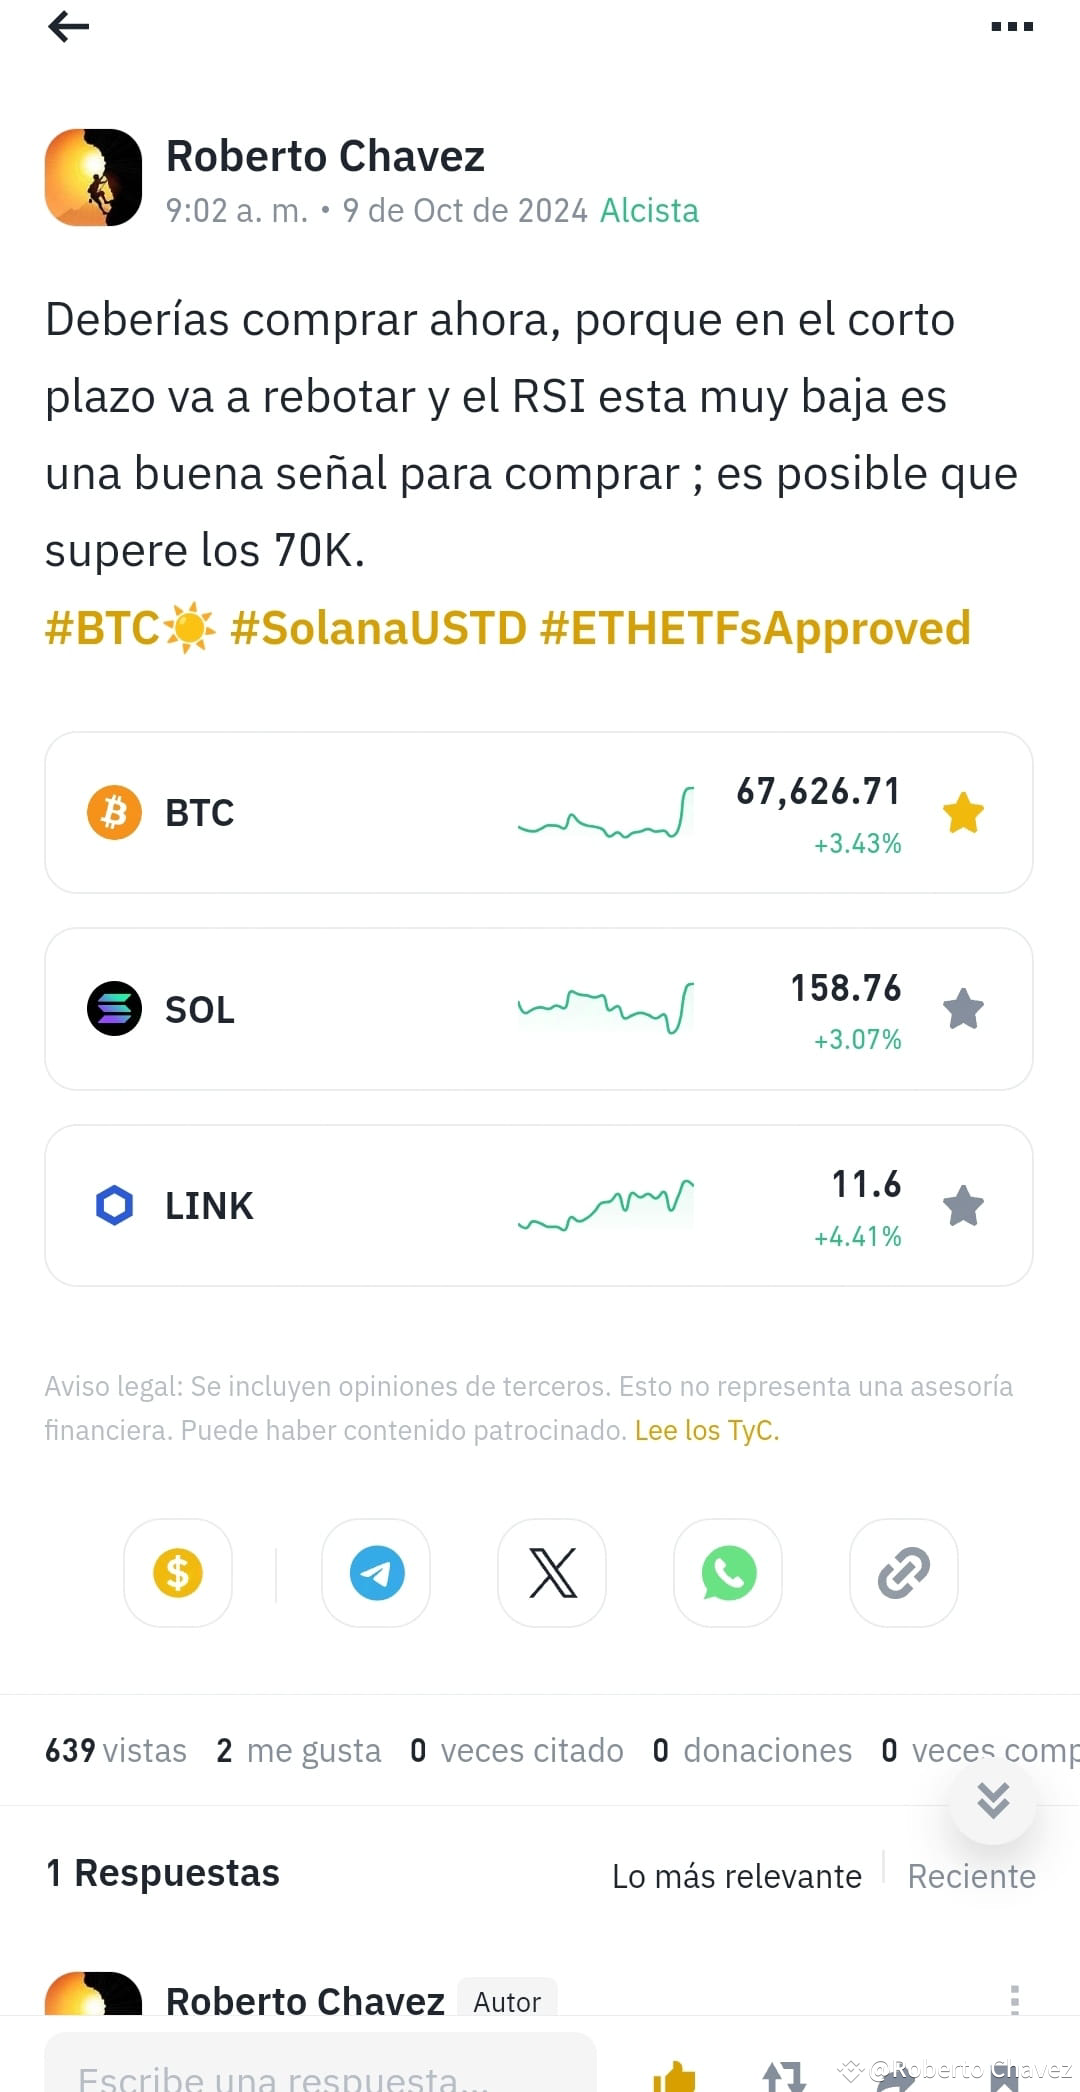
I know you're going to upload, but I never thought it would be so early. For me, that upload has to be around November 6th, but oh well 😮💨
$BTC
{spot}(BTCUSDT)
#btc70k
I know you're going to upload, but I never thought it would be so early. For me, that upload has to be around November 6th, but oh well 😮💨
$BTC
#btc70k
$BTC
#btc70k
934
Log in to explore more content
Join global crypto users on Binance Square
⚡️ Get latest and useful information about crypto.
💬 Trusted by the world’s largest crypto exchange.
👍 Discover real insights from verified creators.
Email / Phone number
Trending Topics
AppleDebutsFoldablePhone
50,512 views
990 Discussing
Apple just dropped the foldable iPhone — and the market is paying attention. This isn't just another product cycle; it's a new product category, a new CEO on stage, and a $1,999 price tag that pushes $AAPL further into ultra-premium territory. Foldables are the narrative, and Apple is now the headline.
#appledebutsfoldablephone #EUExtendsCentralContactPointToCASPs #US10YTreasuryYieldHitsHighestSinceNov2023 #BrentCrudeTops$100 #USTreasuryToBuyBackUpTo$6BLongDatedDebt
KimHotbae
·2 Likes
·3k views
TSMCAugustRevenueUp53.3%YoY
12,563 views
356 Discussing
IranSaysReadyToEscalateWarWithUS
15,655 views
355 Discussing