MATIC price is up more than 15% and is trading near $0.85. The bulls in the multi-day chart are in control and they might soon target the $1.00 level.

MATIC price started a strong increase above the $0.75 resistance against the US Dollar.
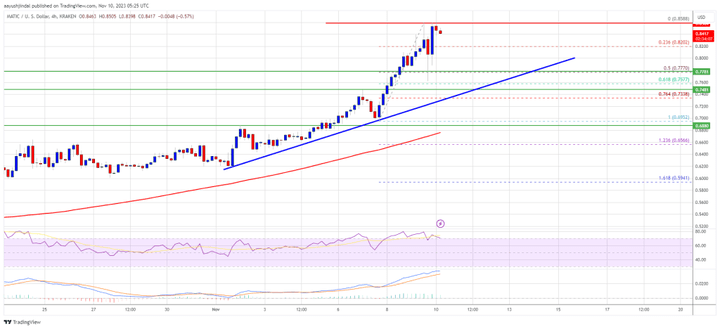
The price is trading above $0.78 and the 100 simple moving average (4-hours).
There is a key bullish trend line forming with support near $0.775 on the 4-hours chart of the MATIC/USD pair.
The pair is likely to continue rising if it breaks above the $0.850 and $0.880 resistance levels.
Polygon Price Signals Breakout
After forming a base above $0.65, Polygon price started a strong increase. MATIC broke many barriers near $0.70 and moved into a positive zone like Bitcoin and Ethereum.
The price rose by more than 15% after breaking above the $0.75 resistance level. Finally, it tested the $0.850 resistance zone. A high was formed near $0.8588 and recently the price corrected downside. There was a sharp decline below the $0.820 level.
The price even surged below the 50% Fib retracement level of the upward wave from the $0.6952 swing low to $0.8588 high. However, the bulls remain active above the $0.750 support area.
There is also a key bullish trend line forming with support near $0.775 on the 4-hours chart of the MATIC/USD pair. The trend line is near the 61.8% Fib retracement level of the upward wave from the $0.6952 swing low to $0.8588 high.
MATIC is currently trading above the $0.78 level and the 100 simple moving average (4-hours). An immediate resistance is near the $0.850 level. The first major resistance is near the $0.880 level. If there is an upside break above the $0.880 resistance, the price is likely to continue to rise.
The next major resistance is near the $0.920 level. A clear break above the $0.920 resistance level is likely to start a steady increase. In the mentioned case, the price might even try to move up to the $0.980 or $1.00 levels.
Downside correction for MATIC?
If the price of MATIC fails to rise above the $0.850 resistance, it could start a downside correction. An immediate support on the downside is near the $0.800 level.
The main support is near the $0.775 level or the trend line. A break below the $0.775 level could open the doors for a fresh drop towards $0.720. The next major support is near the $0.700 level.
Technical indicators
4 hours MACD – MATIC/USD The MACD is gaining momentum in the bullish zone.
4 hours RSI (Relative Strength Index) – The RSI for MATIC/USD is currently above the 50 level.
Major Support Levels – $0.800 and $0.775.
Major Resistance Levels – $0.850, $0.880, and $0.980.