
For traders who love technical analysis, powerful charting tools are essential. X Exchange is an ideal choice for both beginners and experienced traders. Alpha Rabbit offers a variety of trading and charting tools, which are free for all users.
Alpha Rabbit's featured stock market tools are now available. But if you don't know anything about these tools, it might be daunting. Alpha Rabbit's featured stock market tools have a lot of tools to try out, so which one should you start with? Next, we will introduce the beginner's guide to learn more about Alpha Rabbit's specific usage and tool introduction.
Alpha Rabbit's featured trading function covers multiple different token categories in cryptocurrencies and is also available in multiple languages, including Traditional Chinese, Simplified Chinese and English. So no matter which track of tokens you are interested in, Alpha Rabbit's featured trading function can be of great help to you.
How to use Alpha Rabbit’s special feature?
Enter the Alpha Rabbit Featured Watch and on the left you will see a series of drawing tools for highlighting any salient features of the chart. To zoom in or out of the chart, just use your mouse's scroll wheel. You can also toggle the scheduled time period in the lower left corner, but this may also change the data frequency of the icon.
1. Technical indicator settings
Starting from the top, you can do the following: select different coins, adjust the chart data update frequency and type, and add your preferred technical indicators.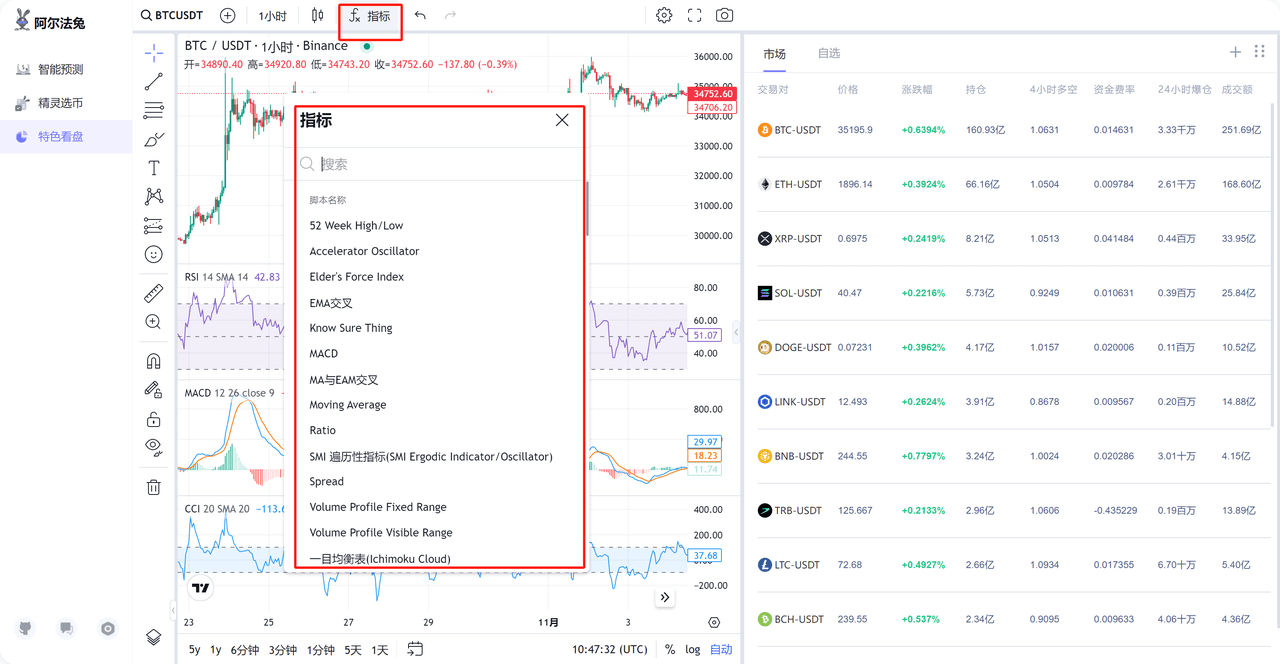
2. Custom K-line settings
One of the most important features of Alpha Rabbit is the market setting. As shown in the figure, you can customize the candlestick chart, including candlestick chart, US line, hollow candlestick chart, line chart, etc.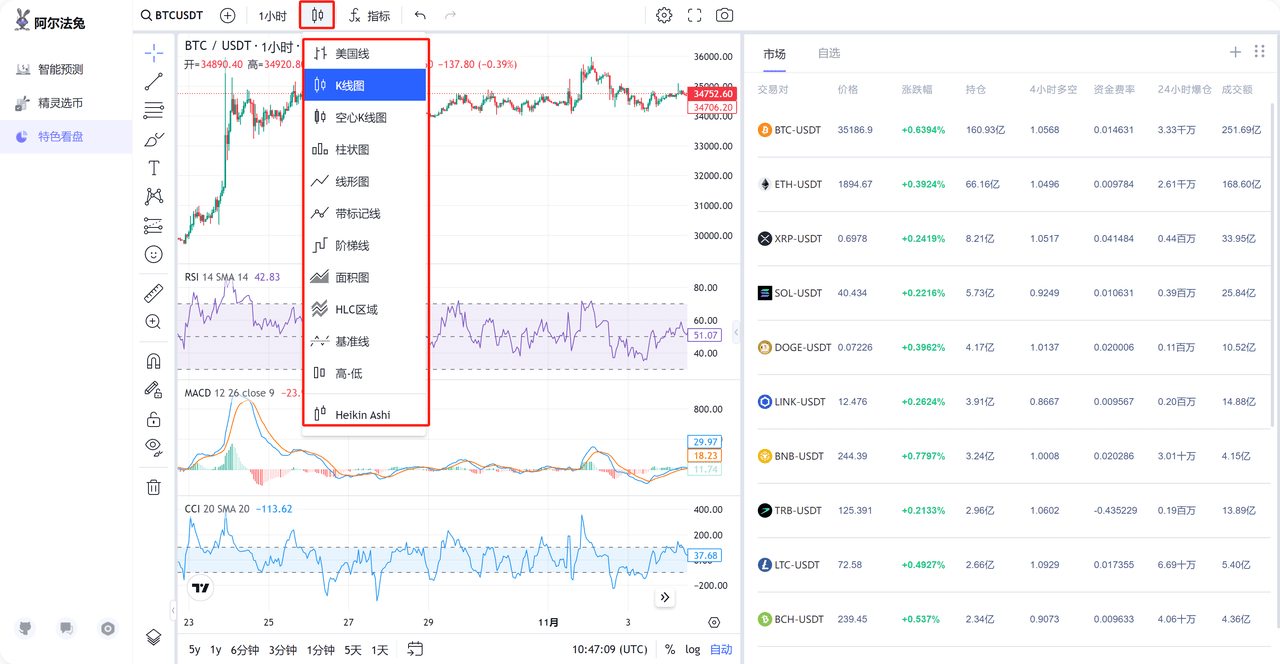
3. Custom K-line period
In the featured market view, you can also set the time period of the K-line yourself, including 1 minute, 5 minutes, 30 minutes, 1 hour, 4 hours, 1 day and 1 week.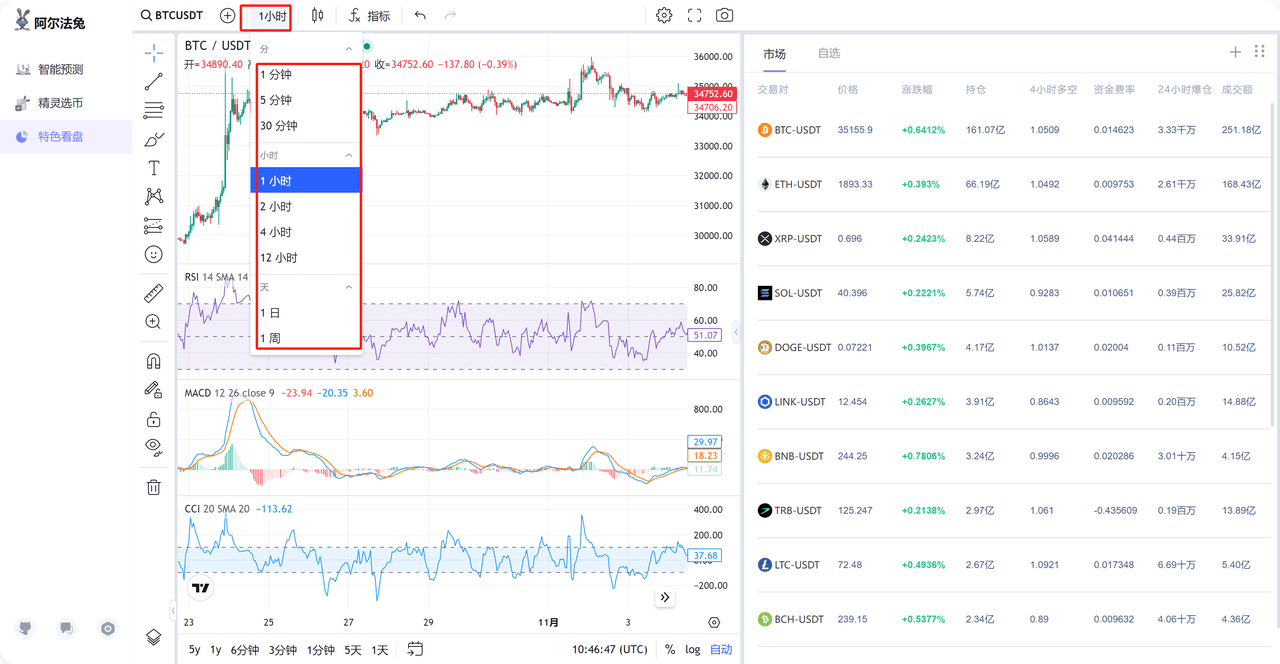
4. Chart settings
Adjust the chart style to suit your trading and analysis needs. Customize the chart style, color and time to suit your personal settings.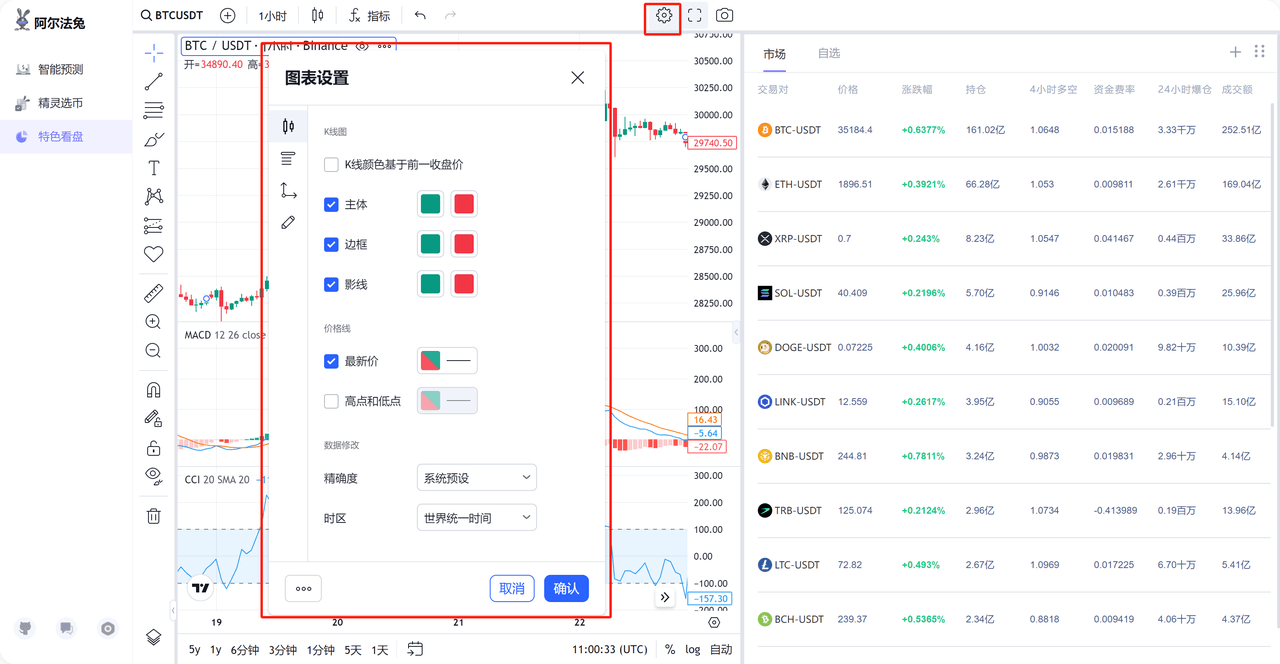
5. Full Screen Mode
With one click, you can switch to full screen mode, hiding all unnecessary distractions and making your chart fill the entire screen. This means you can see price action, technical indicators, and all the details you care about more clearly.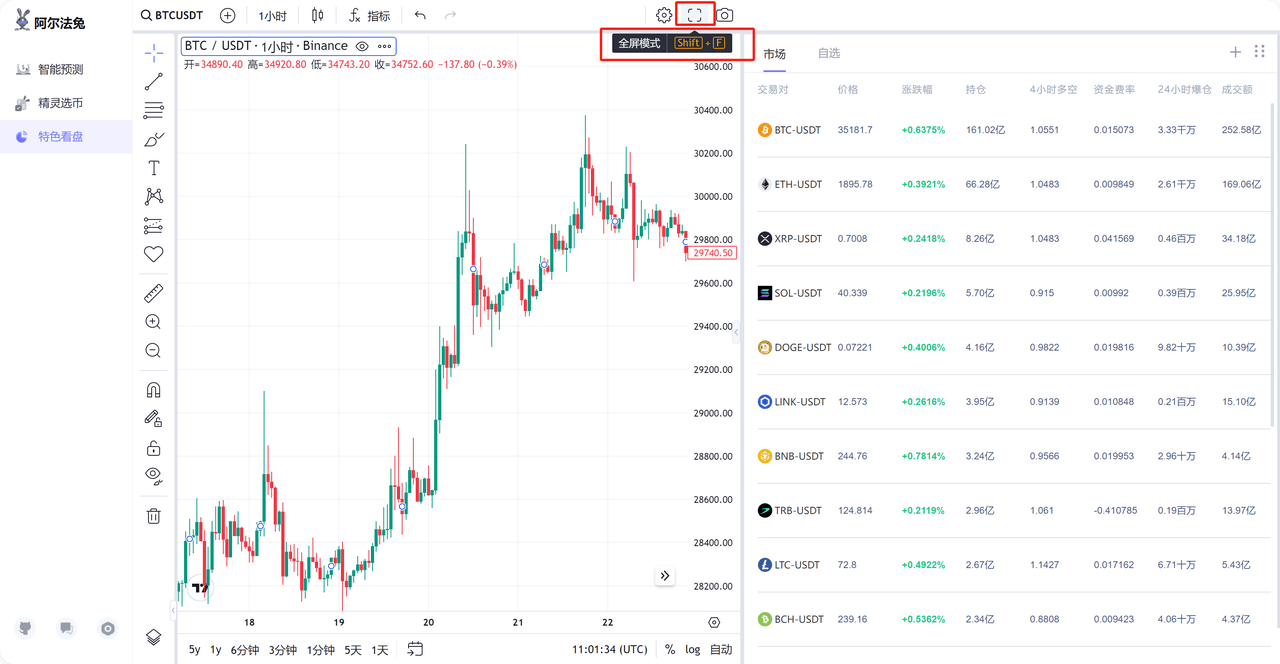
6. Generate snapshot
Record key market moments, share your technical analysis, or save trading plans. With just one click, you can freeze the wonderful moments into pictures and share them with your social circles or save them to your archives at any time.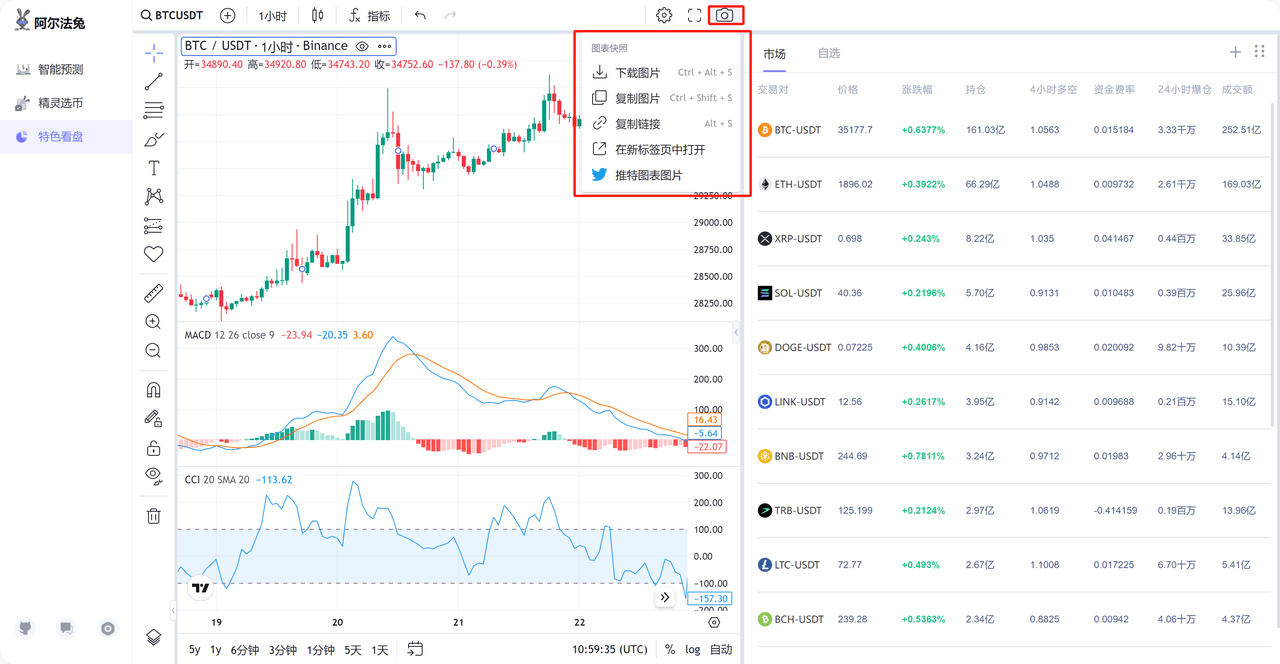
Alpha Rabbit's special tools include:
With Alpha Rabbit's unique market-watching tools, you can easily take notes, add comments, mark trends and patterns, perform measurements and forecasts, and calculate price levels. These powerful tools are all located in a convenient panel on the left side of the chart, which will be described in detail below.
1. Trendline tool
The Trendline tool allows you to draw straight lines on the chart, including arrows, rays, information lines, extension lines and trendline angles to mark the direction of price trends. This helps you identify rising or falling price trends. With the text annotation function, you can add instructions and notes to record your analysis and decision-making ideas.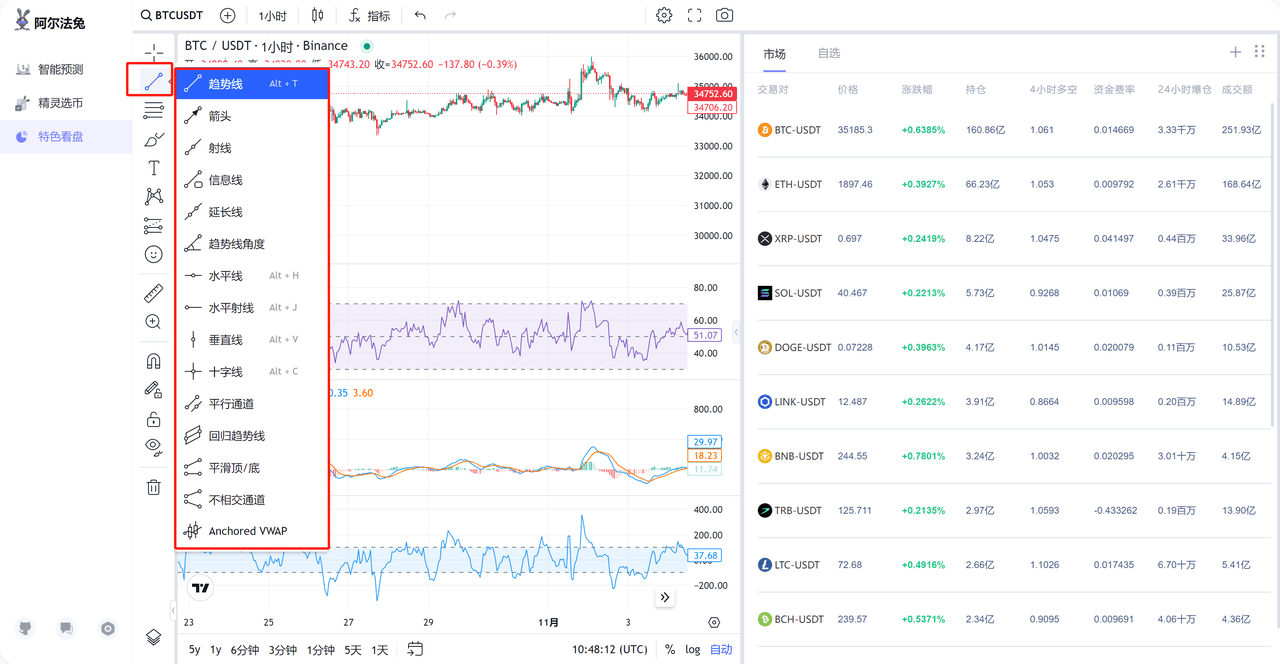
2. Gann and Fibonacci Tools
The Fibonacci and Gann tools automatically draw price levels based on the Fibonacci sequence and Gann theory, helping to identify potential support and resistance levels. In the tool settings, you can adjust the number of levels and calculation coefficients to suit your analytical needs and market characteristics.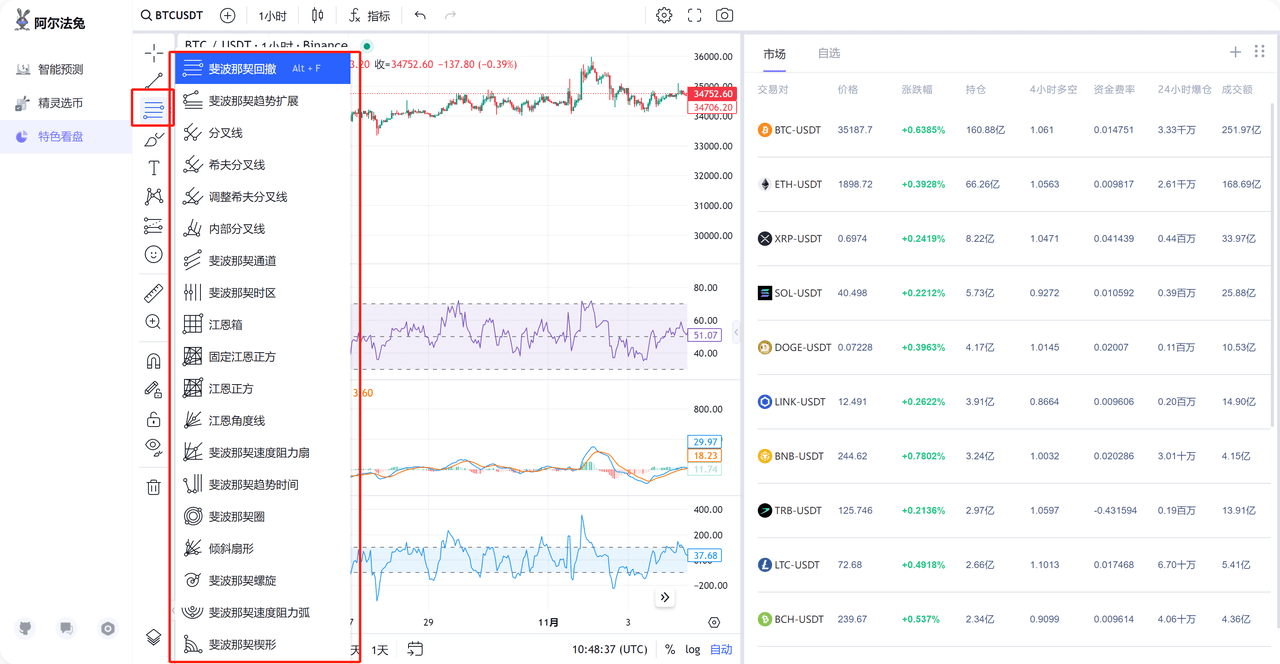
3. Geometric shape drawing tools
The geometric drawing tools are versatile and can be used to draw free-form lines, mark key points on a chart, or draw standard geometric shapes such as rectangles, circles, and arrows. These tools help highlight important patterns, shapes, and trends to better understand market dynamics.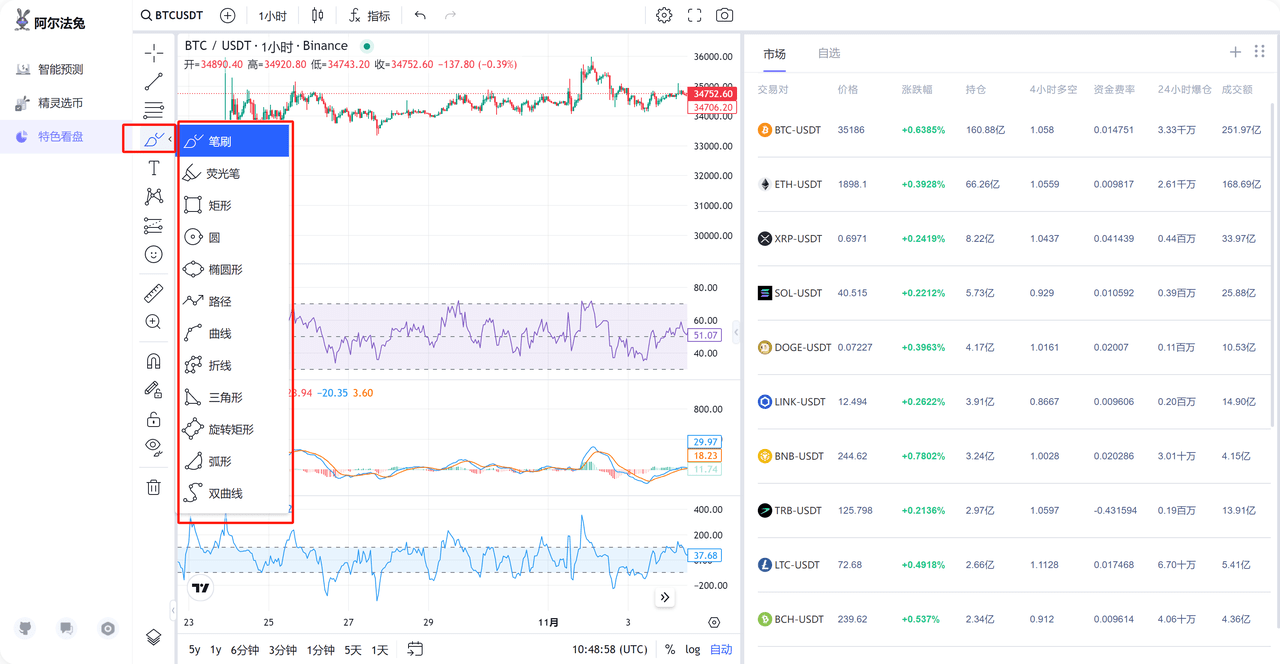
4. Annotation Tools
The Annotation tool allows you to add text annotations directly onto your chart, providing more detailed analysis and explanation. This can be used to point out key events, news or technical patterns, providing a clearer visual reference.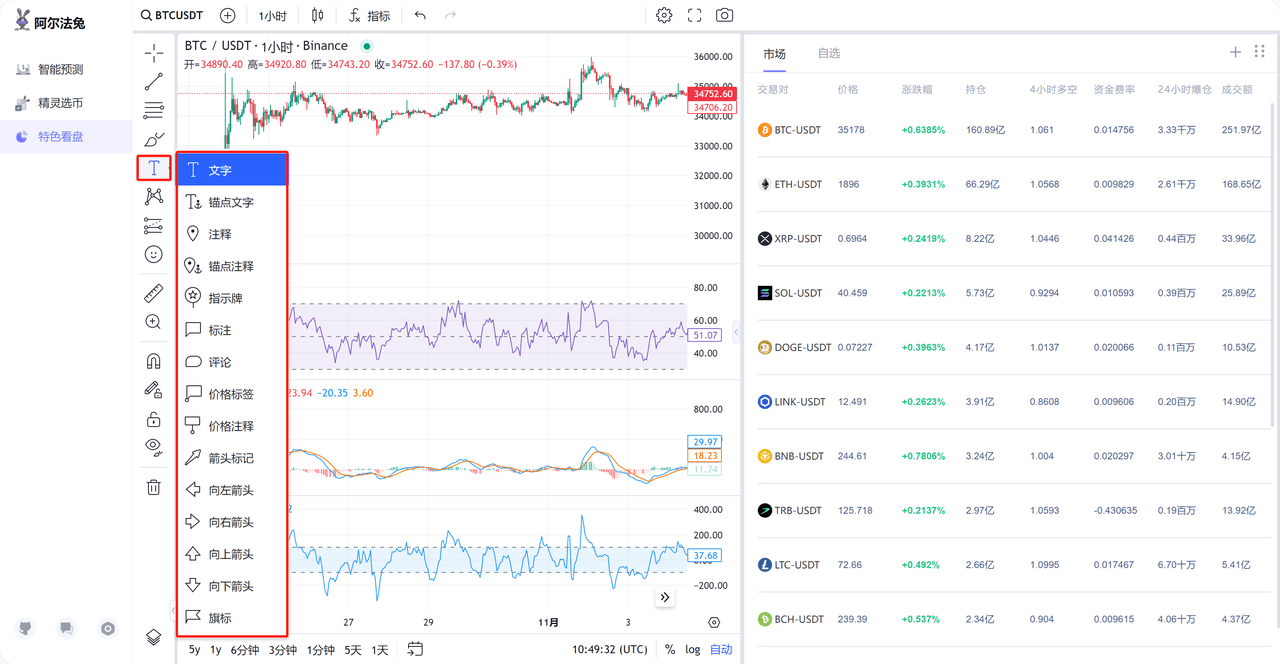
5. Morphological marking
The Pattern Marker tool enables you to quickly mark the highs and lows on the price chart, as well as the distance between them. These markers can be used to identify pattern patterns, such as XABCD patterns, SYFY patterns, triangle patterns, head and shoulders patterns, and many other patterns, which can help predict future price trends.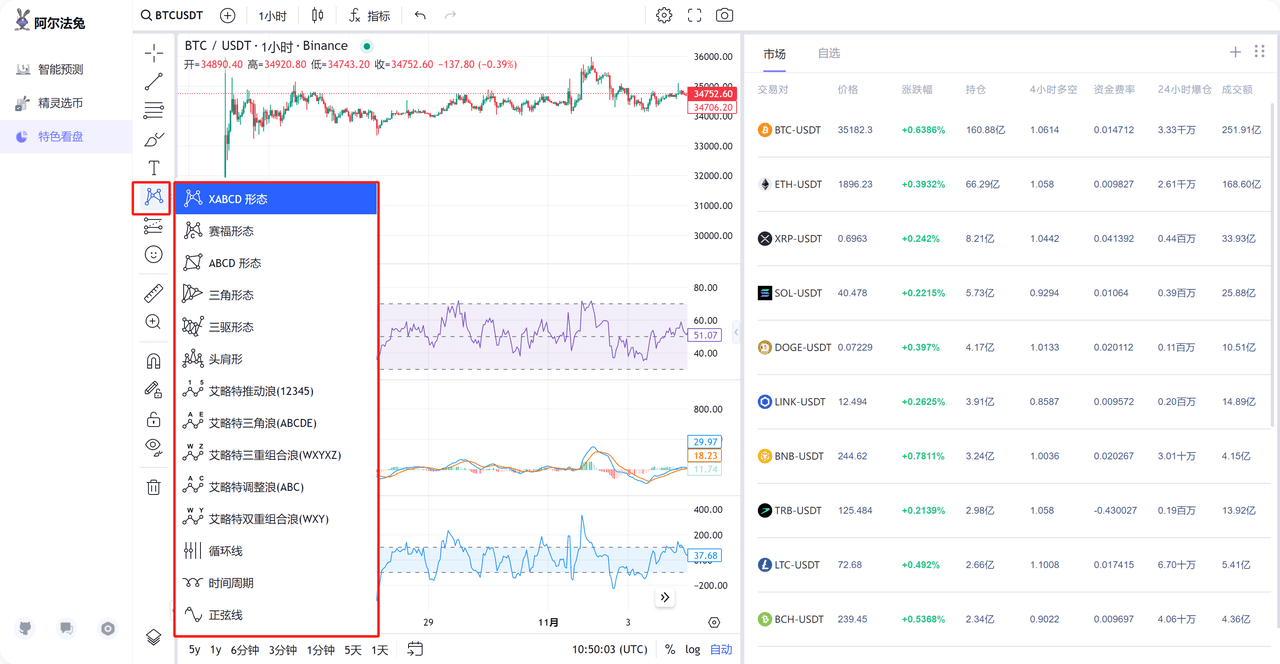
6. Prediction and measurement tools
Forecasting and measurement tools can be used to measure price distances, predict price movements and assess trading position sizes. These tools provide data support, enabling you to make more precise market analysis and decisions.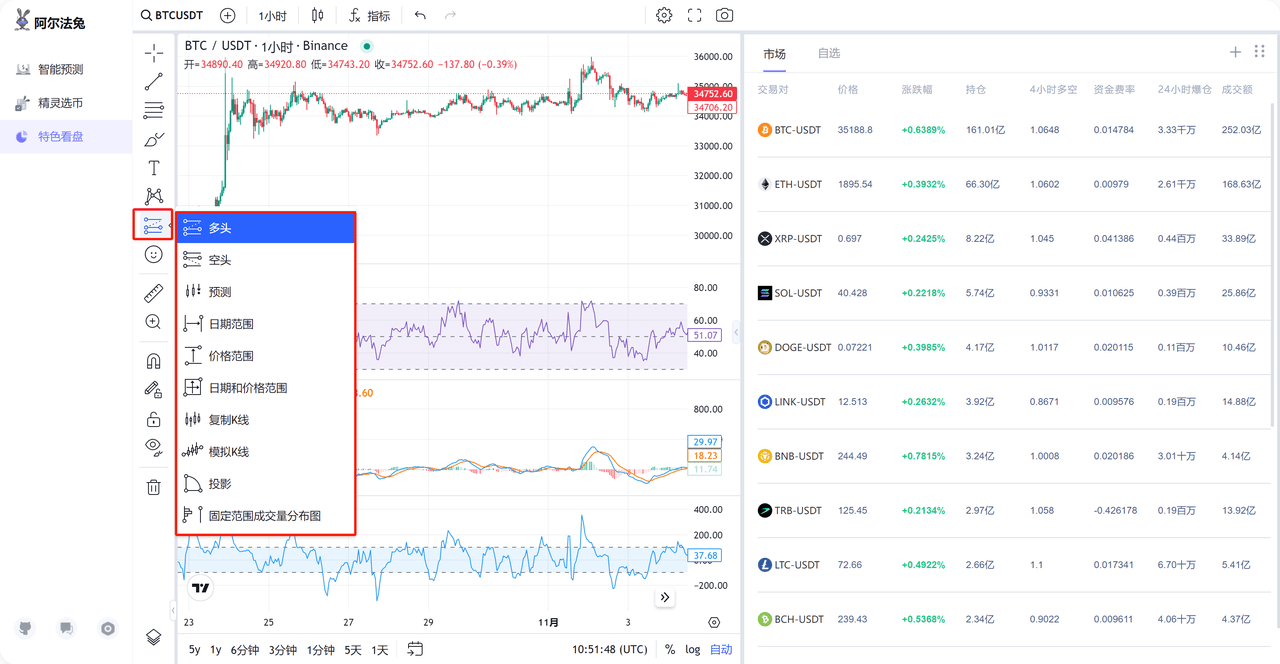
7. Icon Tools
The Icon Tool adds more variety and creativity to your analysis. It can be used not only to decorate charts, but also to add emojis, stickers, and other graphic elements. By using different icons, you can highlight specific data points or emphasize important events, making charts more informative.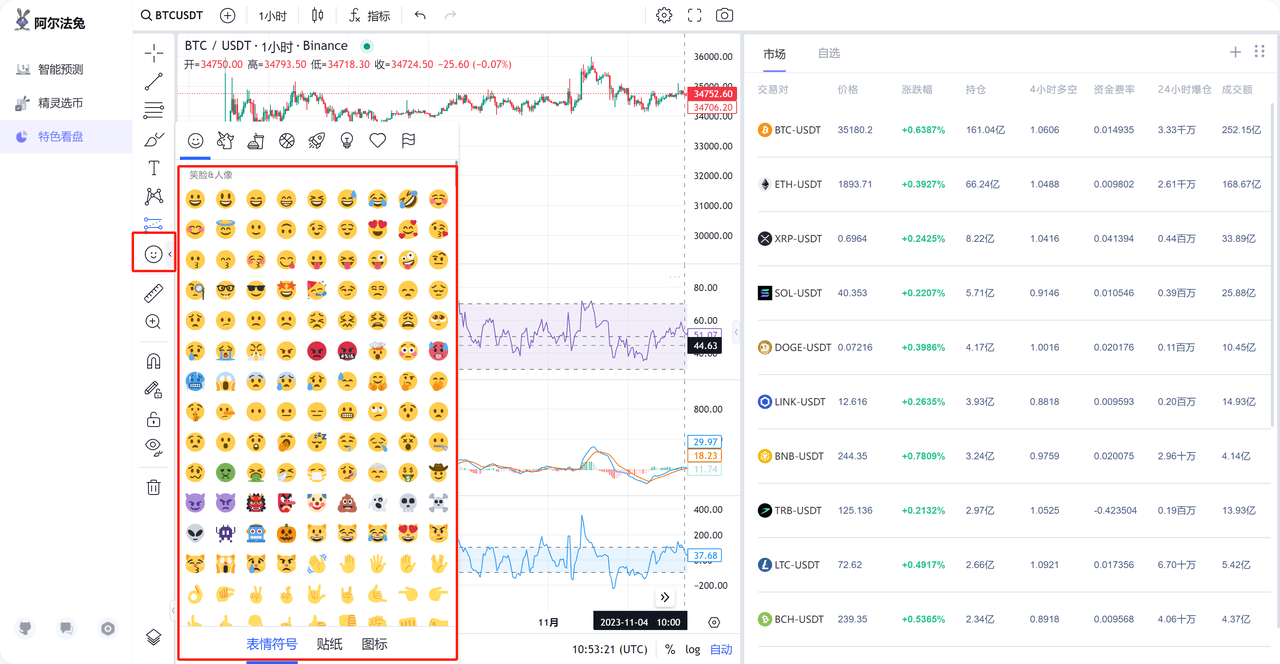
8. Measurement function
The measurement function allows you to easily measure the number of candlesticks and days in a specific area on the chart, providing key data for technical analysis, trend research and volatility analysis. Simply draw a box and you can get important information such as the number of candlesticks and days in the selected area.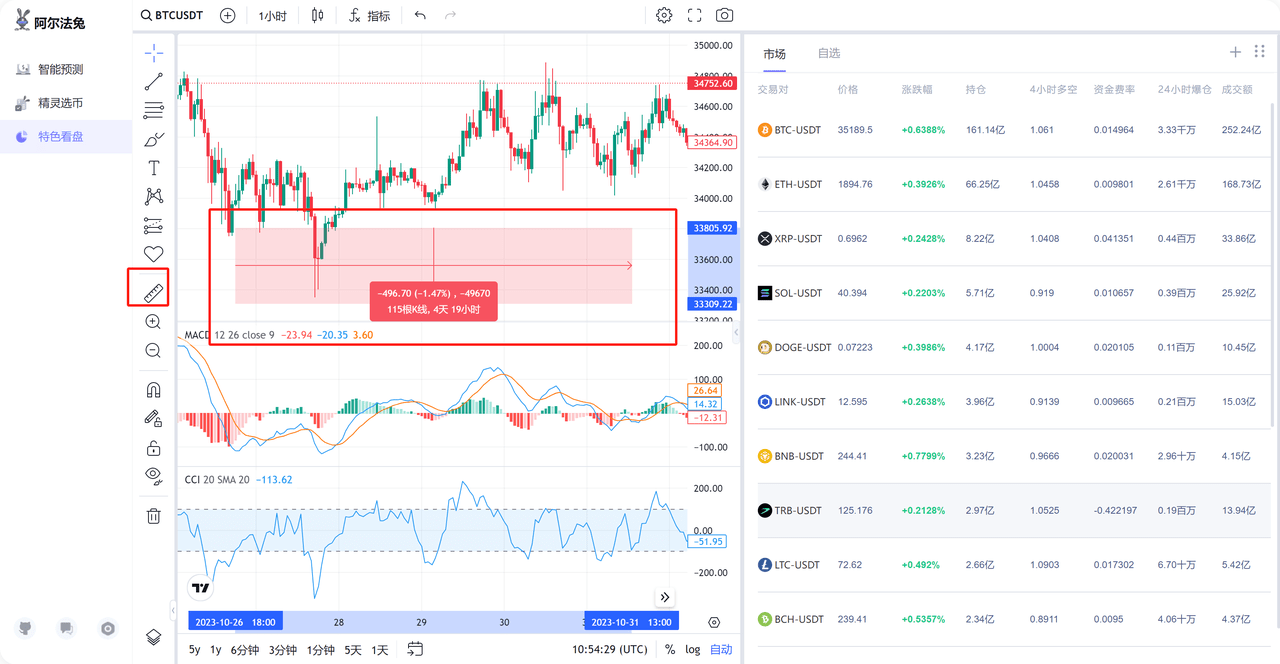
9. Strong magnet & weak magnet function
The magnet function is to attract the high price or low price near the cursor when drawing a trend line. You can draw a line that is exactly aligned with the high price or low price. When using the magnet function, click the magnet icon in the toolbar on the left side of the chart and select a strong magnet or a weak magnet.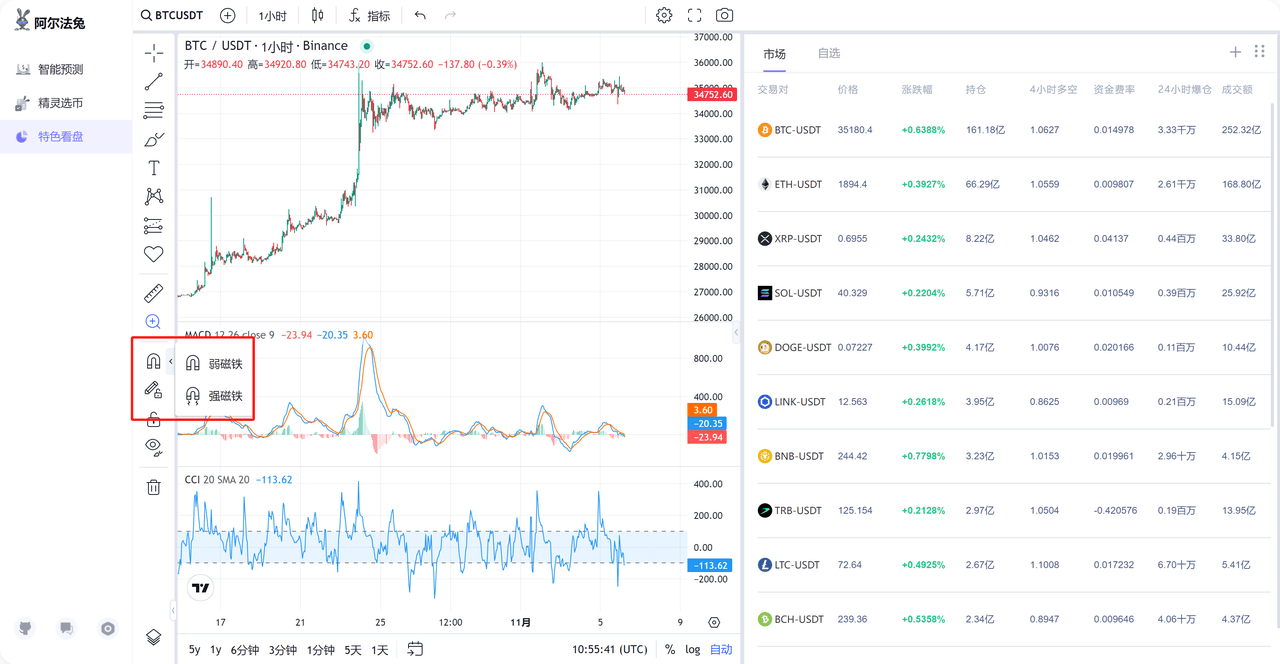
10. Keep drawing function
The drawing tool will generally stop after drawing. If you only draw one line or one drawing, it will not feel inconvenient. However, when drawing trend lines continuously, you need to select the line each time, which will be inconvenient. At this time, it will be very convenient to use the keep drawing function. Just click this icon when using it.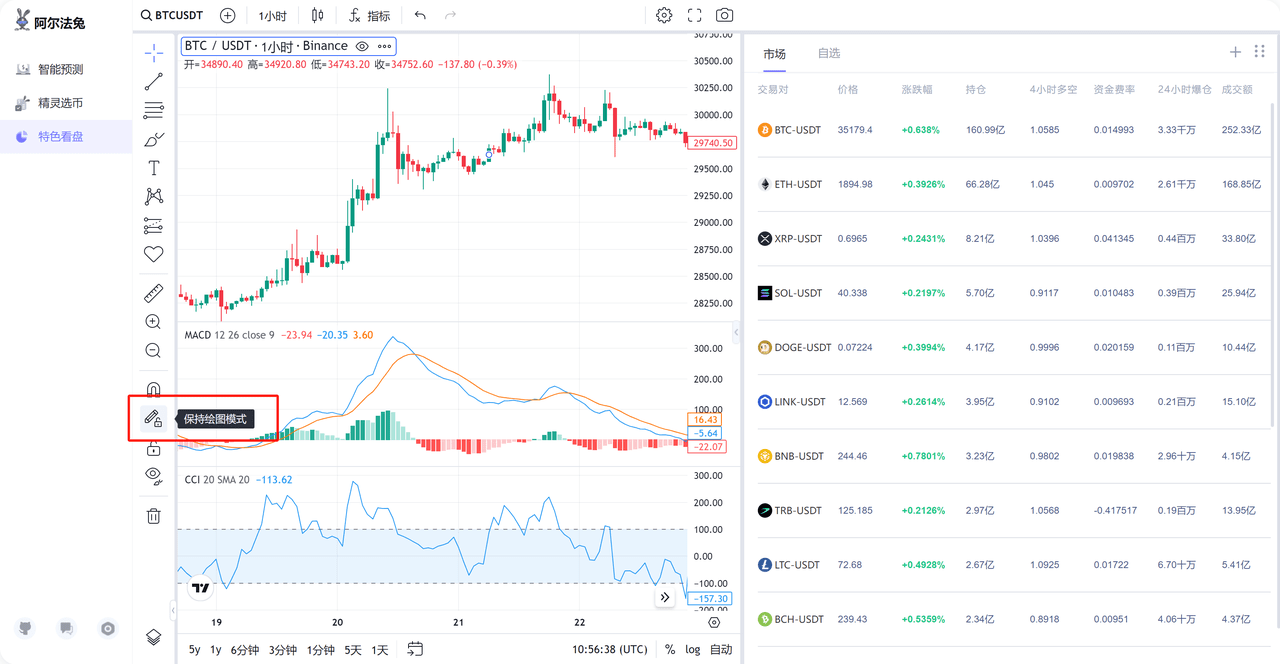
11. Lock all drawings
The Lock All Drawings function prevents you from accidentally touching other lines when analyzing icons. Using this function will fix all drawings and they cannot be moved.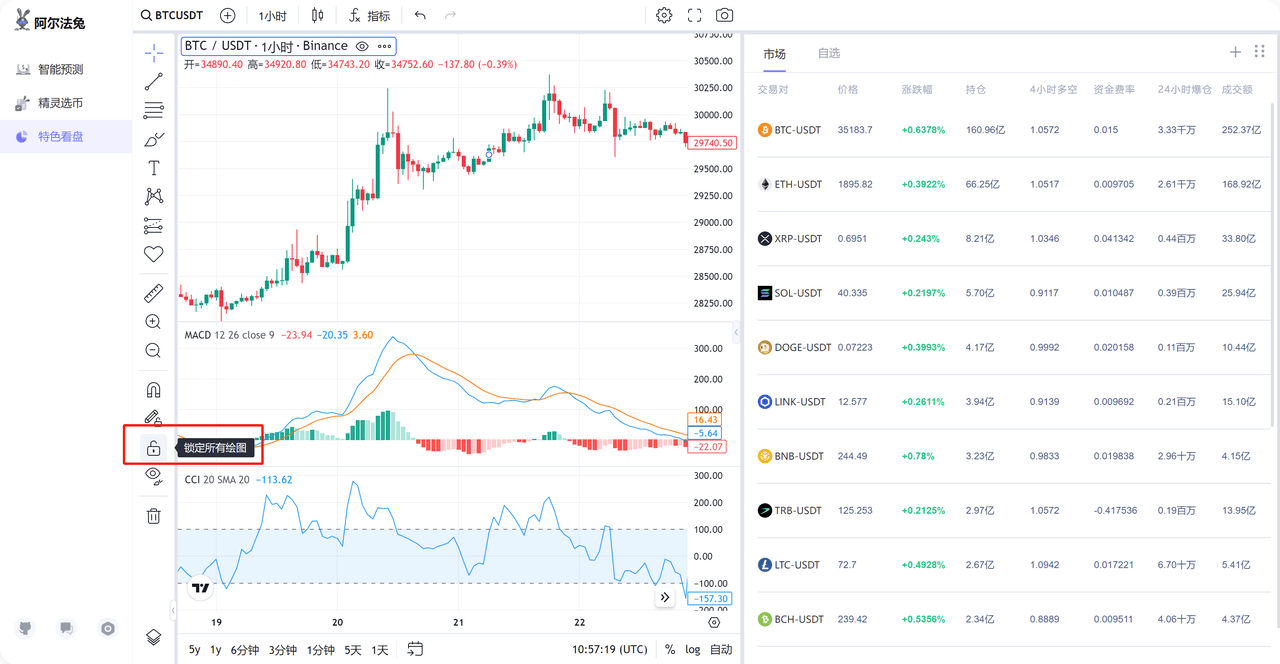
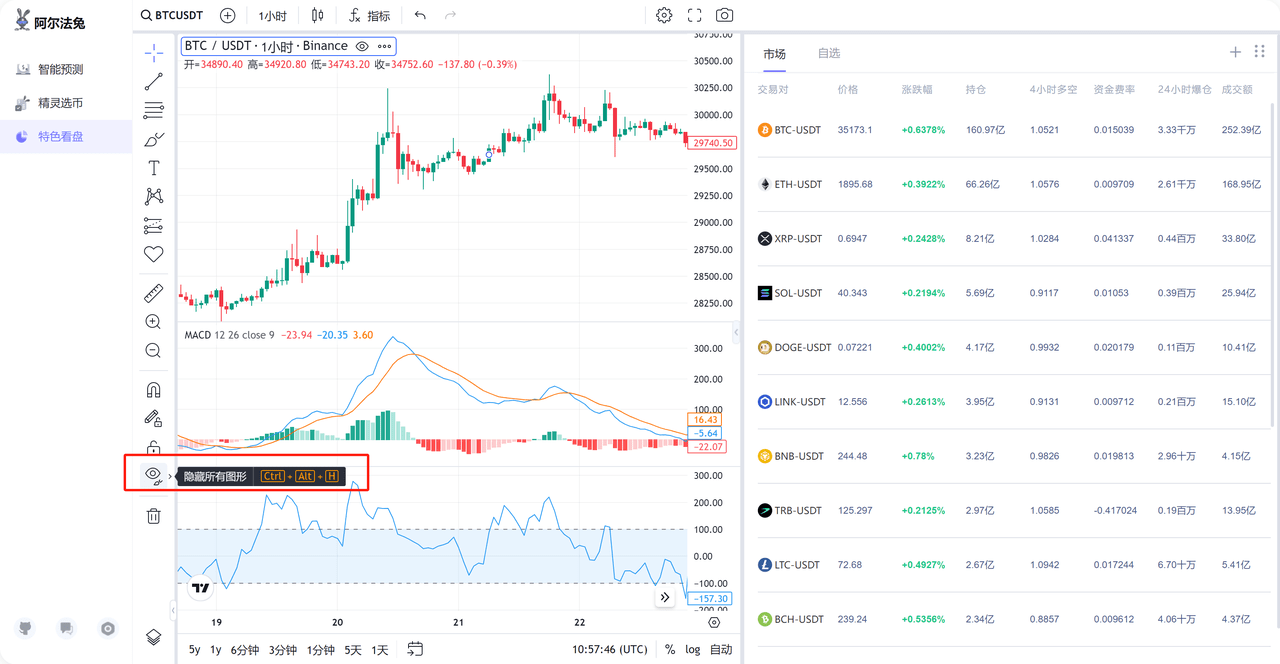
12. Restore button
When you don't need to view the painted graphics, you can temporarily hide all the painted graphics, and click to unlock them when needed.
13. Delete the drawing function
Delete all drawing history with one click. By removing technical indicators on the chart, you can make the chart clearer and easier to read.
About X Exchange
X Exchange is the world's first Web2.5 intelligent digital asset trading platform. At XExchange, we are committed to providing users with a safer, more efficient and more convenient digital asset trading experience through intelligent technology and Web2.5.
X Academy is a think tank of X Exchange focusing on digital asset research. X Academy focuses on training and incubating new crypto members to build a future of encryption and decentralization. X Academy provides users with high-quality institutional-level crypto research, combining market dynamics, project research, on-chain data, and online social networking to create a top crypto intelligence academy.