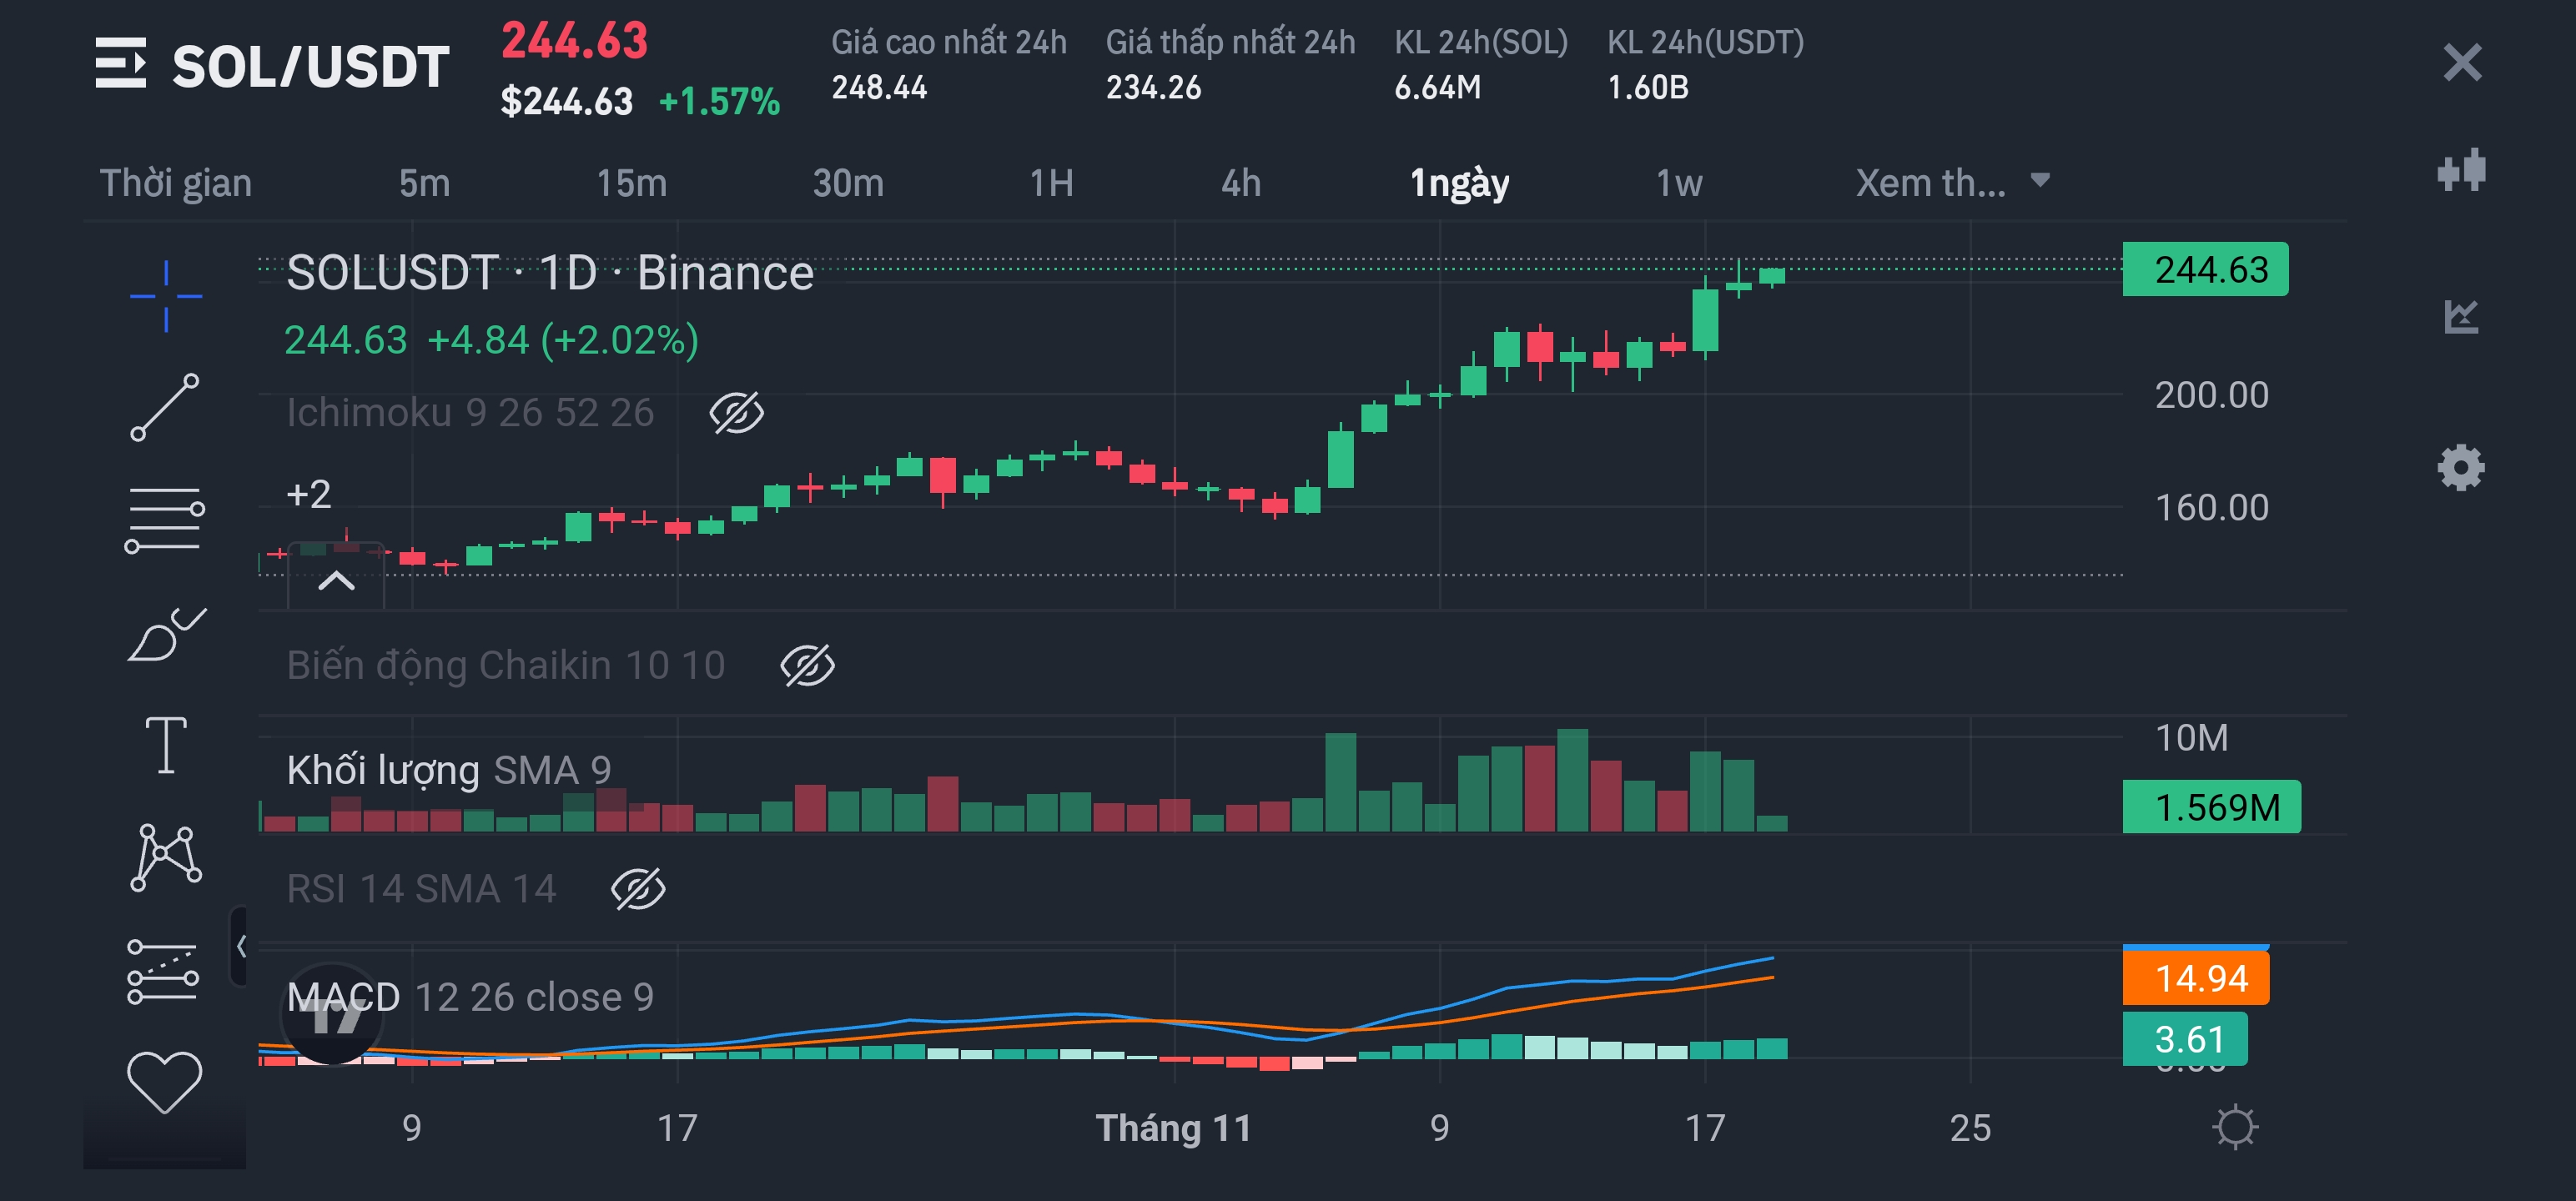
The MACD (Moving Average Convergence Divergence) tool is a technical indicator commonly used in financial market analysis, primarily to determine the trend and strength of an asset. The MACD is calculated by taking the difference between two moving averages (usually 12 periods and 26 periods). This indicator is typically represented as a MACD line and a signal line, as well as a histogram to show the distance between the two lines.
### How to use MACD:
1. Buy signal: When the MACD line crosses above the signal line.
2. Sell signal: When the MACD line crosses below the signal line.
3. Divergence: If the price makes a new high/low but the MACD does not follow, it may indicate weakness in the current trend.
### Note:
- Use MACD along with other indicators to increase accuracy.
- You need to have a clear understanding of the market and the impact of external factors on prices.
If you need more information or specific guidance, let me know!