

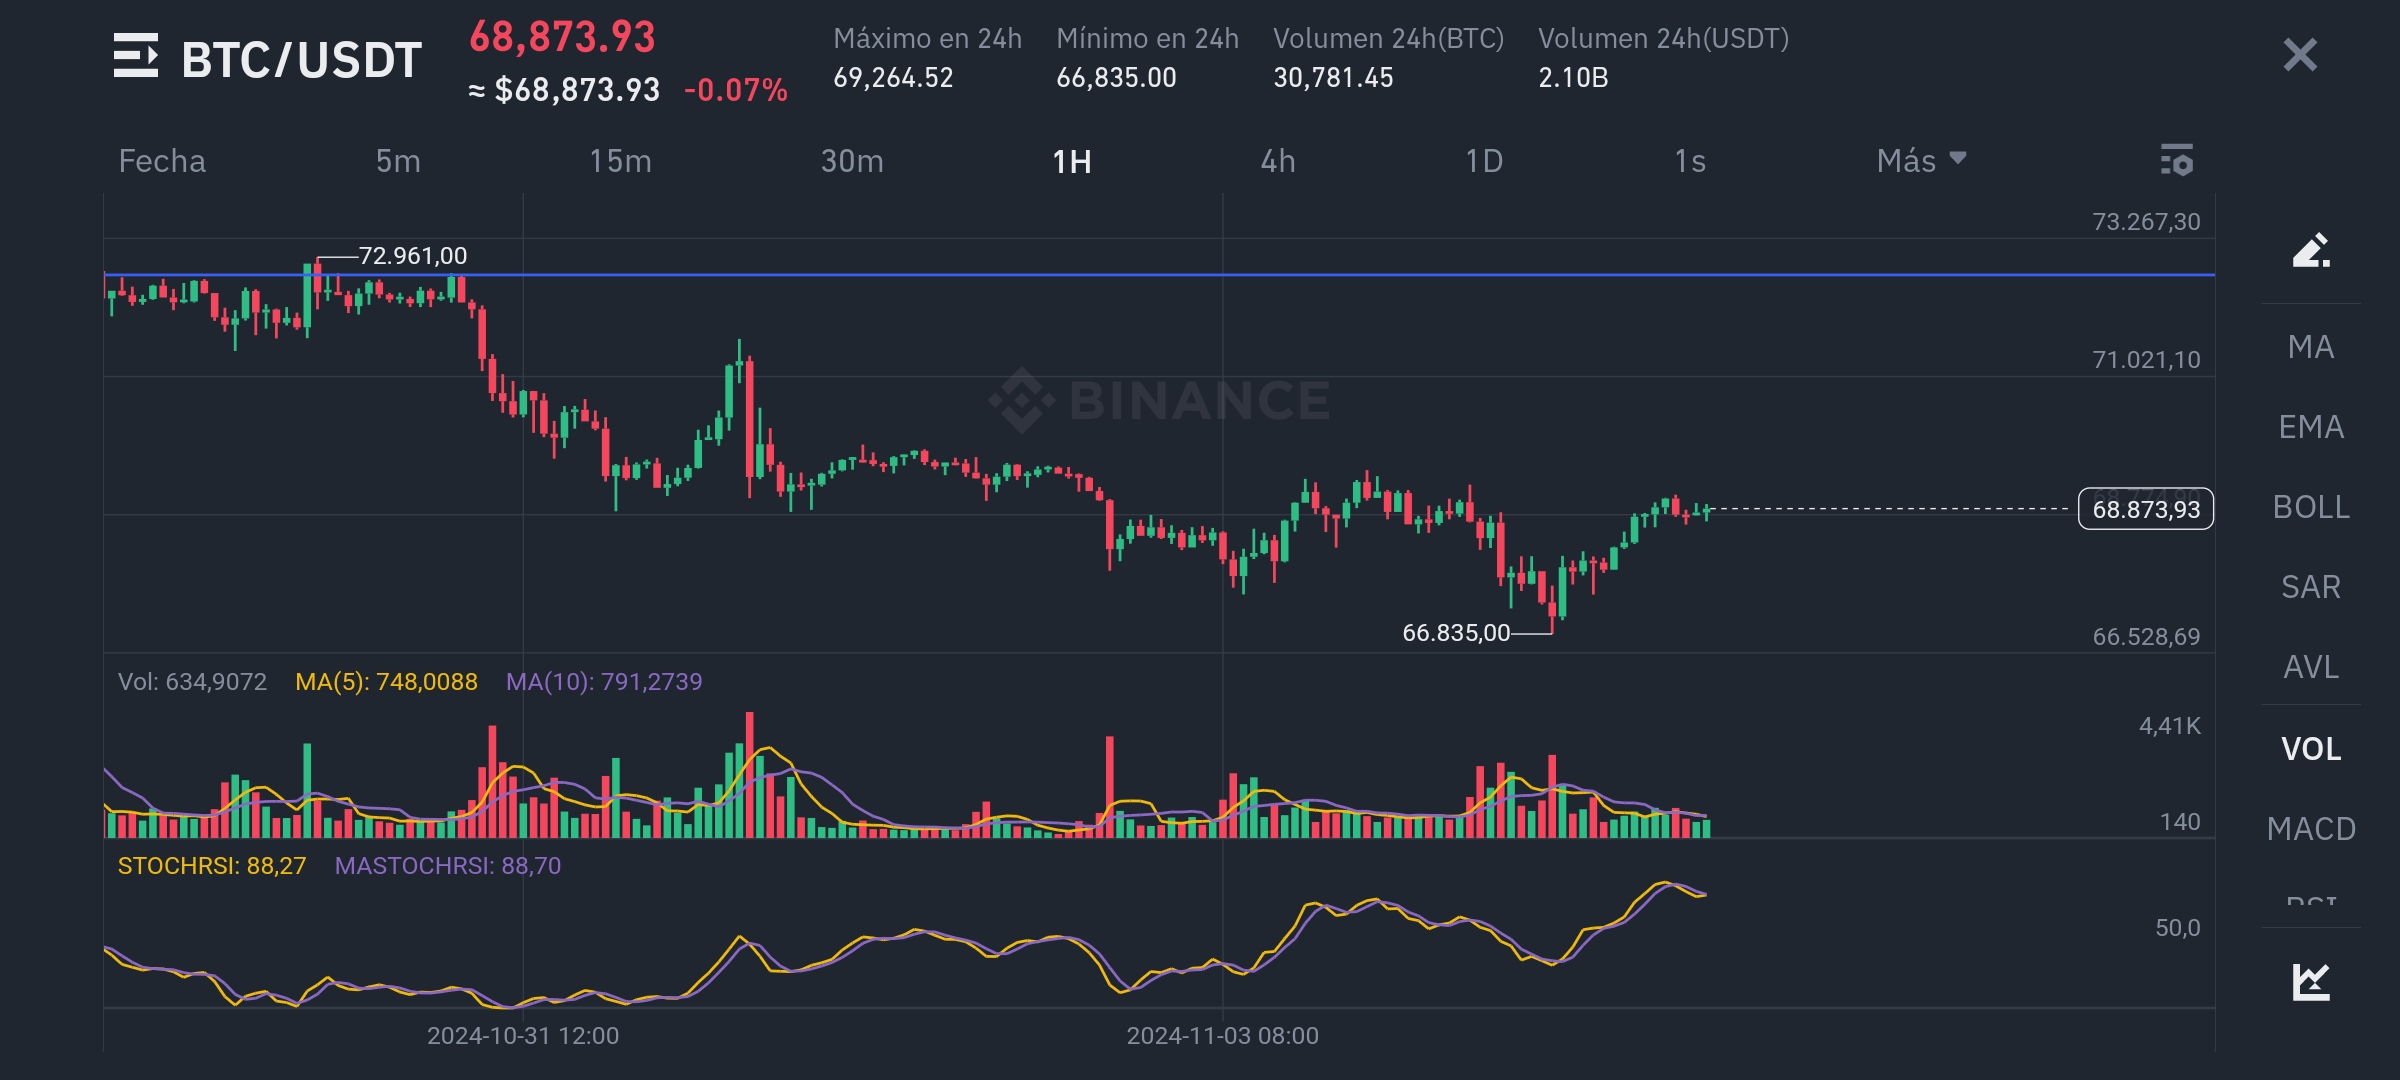
detailed analysis of BTC/USD and GRT/USD, considering both graphical and fundamental aspects, especially in the context of the elections in the United States, which could affect volatility and price movements.
1. Analysis of BTC/USD (Bitcoin)
Graphical Analysis
Observing the 30-minute chart for BTC/USD:
The price has retraced from a recent high and is moving within a range defined by Fibonacci retracement levels.
In the chart, the 23.6% Fibonacci level seems to act as local support in the area of $68,207.06 USD, while immediate resistance is near the 38.2% Fibonacci level around $70,537.93 USD.
The moving averages seem to be crossing downwards, indicating a possible continuation of the bearish trend in the short term if the price fails to break key resistances.
The stochastic shows oversold conditions or close to them, suggesting that there could be a technical rebound in the short term if the current support is maintained.
Fundamental Analysis
Elections in the United States tend to increase uncertainty in the markets, which can lead investors to seek safe-haven assets like Bitcoin. Additionally, the general market sentiment may fluctuate based on election results and the potential impact on the country's economic and monetary policy.
Probable Scenarios:
Rise in BTC/USD: If the election results generate uncertainty or volatility in traditional markets, we could see an increase in demand for Bitcoin, taking it to test resistances around $70,000 USD and, if momentum continues, towards higher levels in the Fibonacci range (50% and 61.8%).
Drop in BTC/USD: If the market interprets the results positively for risk assets, it is possible that the price of BTC will continue its downward correction and approach the support around $65,000 USD, with a possible extension to $63,802.96 USD in a scenario of greater selling pressure.