
Original author: Lisa, LD Capital
BTC is known as "digital gold", and traders often use the Nasdaq index as an important reference for BTC price changes. Gold and the Nasdaq are typical representatives of safe-haven assets and risky assets, respectively, which seems to be contradictory. This article will uncover whether BTC is a safe-haven asset by exploring the price influencing factors of BTC and gold.
1. Overview of Gold and BTC
1. Gold
Unit of measurement for gold
"Ounce" is the internationally accepted unit of measurement for gold, 1 troy ounce = 1.0971428 avoirdupois ounce = 31.1034768 grams.
Gold quality
Fineness refers to the purity of a metal, usually expressed in parts per thousand, but can also be expressed in "karats" or "karats". The fineness/purity of gold can be divided into 24 "karats" or "karats". Each karat (abbreviation for English carat, German karat, often written as "k") contains 4.166% gold, and the gold content of each karat is:
8 k= 8* 4.166% = 33.328% ( 333 ‰) 9 k= 9* 4.166% = 37.494% ( 375 ‰)
10 k= 10* 4.166% = 41.660% ( 417 ‰) 12 k= 12* 4.166% = 49.992% ( 500 ‰)
14 k= 14* 4.166% = 58.324% ( 583 ‰) 18 k= 18* 4.166% = 74.998% ( 750 ‰)
20 k= 20* 4.166% = 83.320% ( 833 ‰) 21 k= 21* 4.166% = 87.486% ( 875 ‰)
22 k= 22* 4.166% = 91.652% ( 916 ‰) 24 k= 24* 4.166% = 99.984% ( 999 ‰)
For example, the standard delivery object of London gold is a 400-ounce gold bar with a gold content of not less than 99.50%; Shanghai gold has delivery varieties such as Au 99.99, Au 99.95, Au 99.5, Au 50 g, and Au 100 g:
Au 99.99 is a gold ingot with a standard weight of 1 kg and a fineness of not less than 99.99%.
Au 99.95 is a gold ingot with a standard weight of 3 kg and a fineness of not less than 99.95%.
Au 99.5 is a gold ingot with a standard weight of 12.5 kg and a fineness of not less than 99.50%.
Au 50 g is a gold bar with a standard weight of 0.05 kg and a fineness of not less than 99.99%.
Au 100 g is a gold bar with a standard weight of 0.1 kg and a fineness of not less than 99.99%.
Total market value of gold
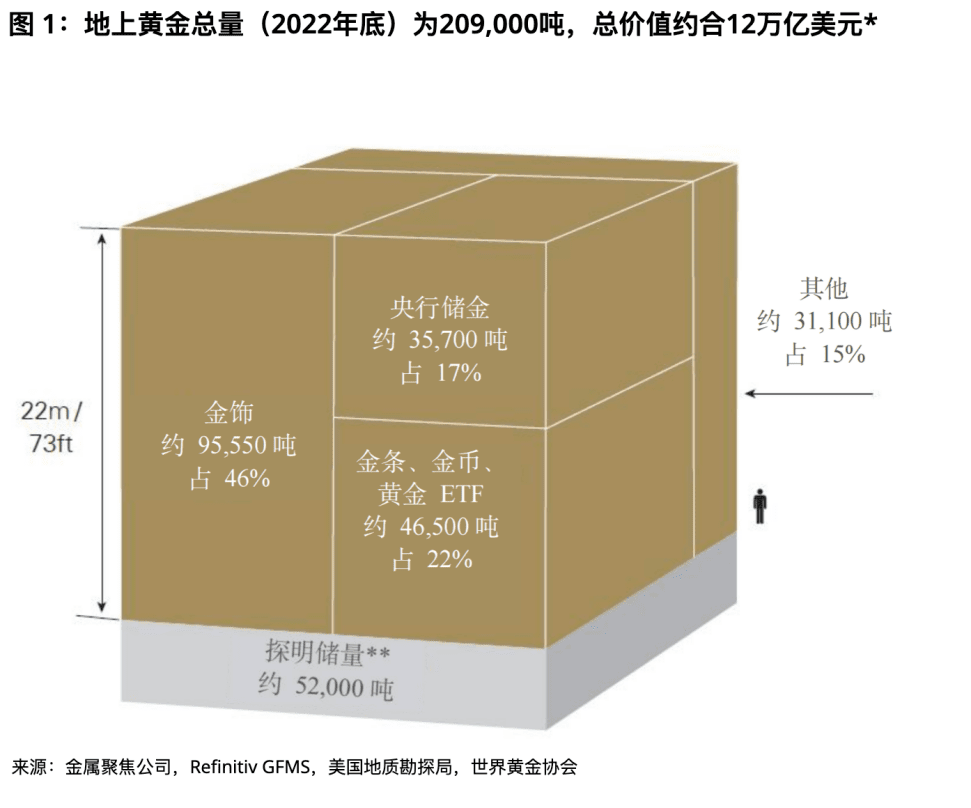
According to the World Gold Council, an estimated 209,000 tons of gold has been mined, worth about $12 trillion, with about two-thirds of it mined since 1950. If all the gold in existence were piled up, it would form a cube of pure gold 22 meters (or 73 feet) on a side.
About 46% of the total is in the form of jewellery (about 95,547 tonnes, or about $6 trillion).
Central banks hold 17% of gold (about 35,715 tons, or about $2 trillion) as reserves;
About 21% of the total is in the form of bars and coins (about 43,044 tons, or about $3 trillion);
Physically-backed gold ETFs account for about 2% of the total (about 3,473 tons, or about $0.2 trillion);
The rest, about 15% of the total (about 31,096 tons, or about $2 trillion), is used for various industrial purposes or held by other financial institutions.
Gold trading volume
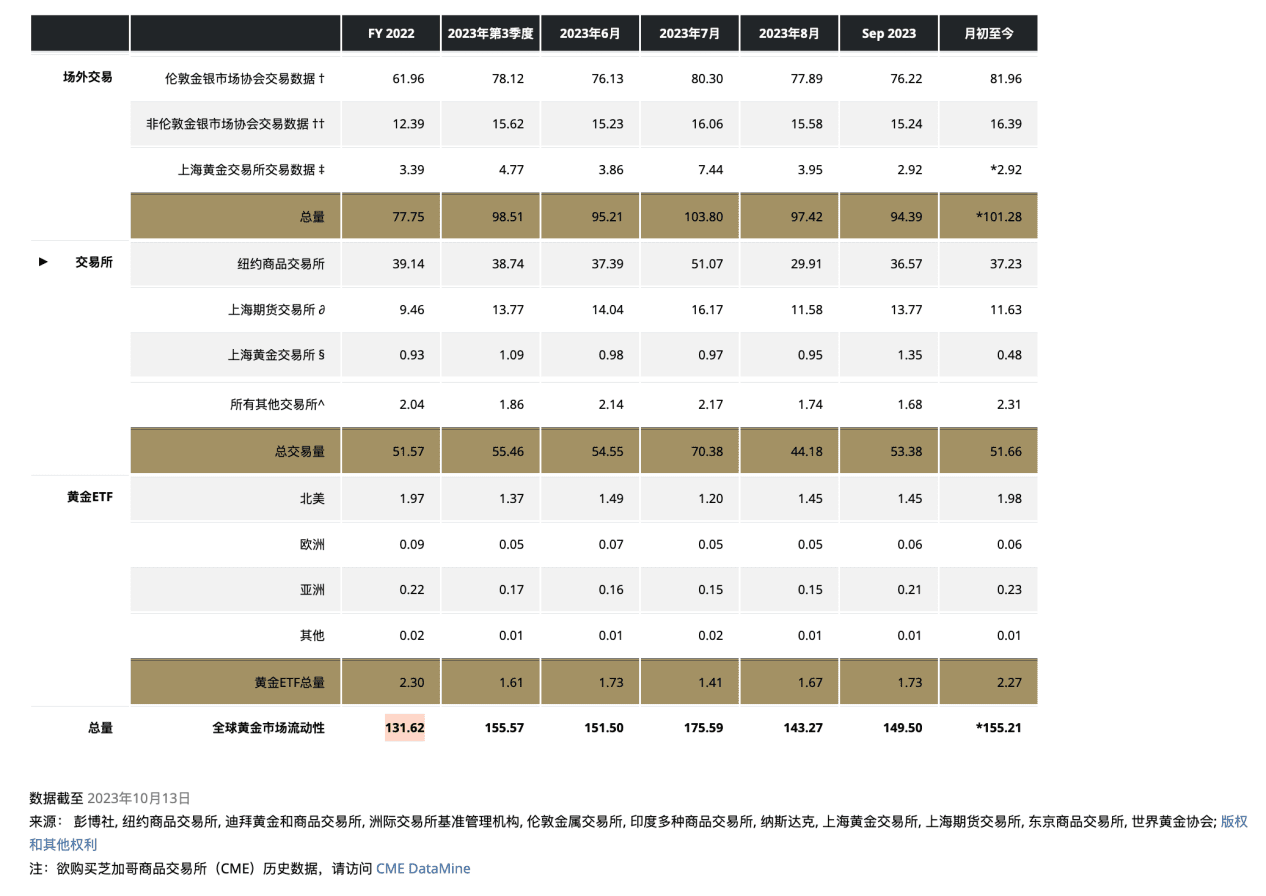
Gold is one of the most liquid assets in the world, with an average daily trading volume of $131.6 billion in 2022. The main trading venues include the London OTC market, the US futures market and the Chinese market. The London OTC market began in 1919 and is a gold spot OTC market. It is the center of gold trading. The London Bullion Market Association (LBMA) generates gold reference prices twice a day (10:30 am and 3:00 pm London time) as a benchmark for market participants to trade; the gold market of the New York Mercantile Exchange (COMEX) is currently the world's largest gold futures market; the Shanghai Gold Exchange (SGE) officially opened on October 30, 2002, providing a spot trading platform for the Chinese gold market; the futures trading of the Shanghai Futures Exchange (SHFE) supplements the spot trading of the Shanghai Gold Exchange.
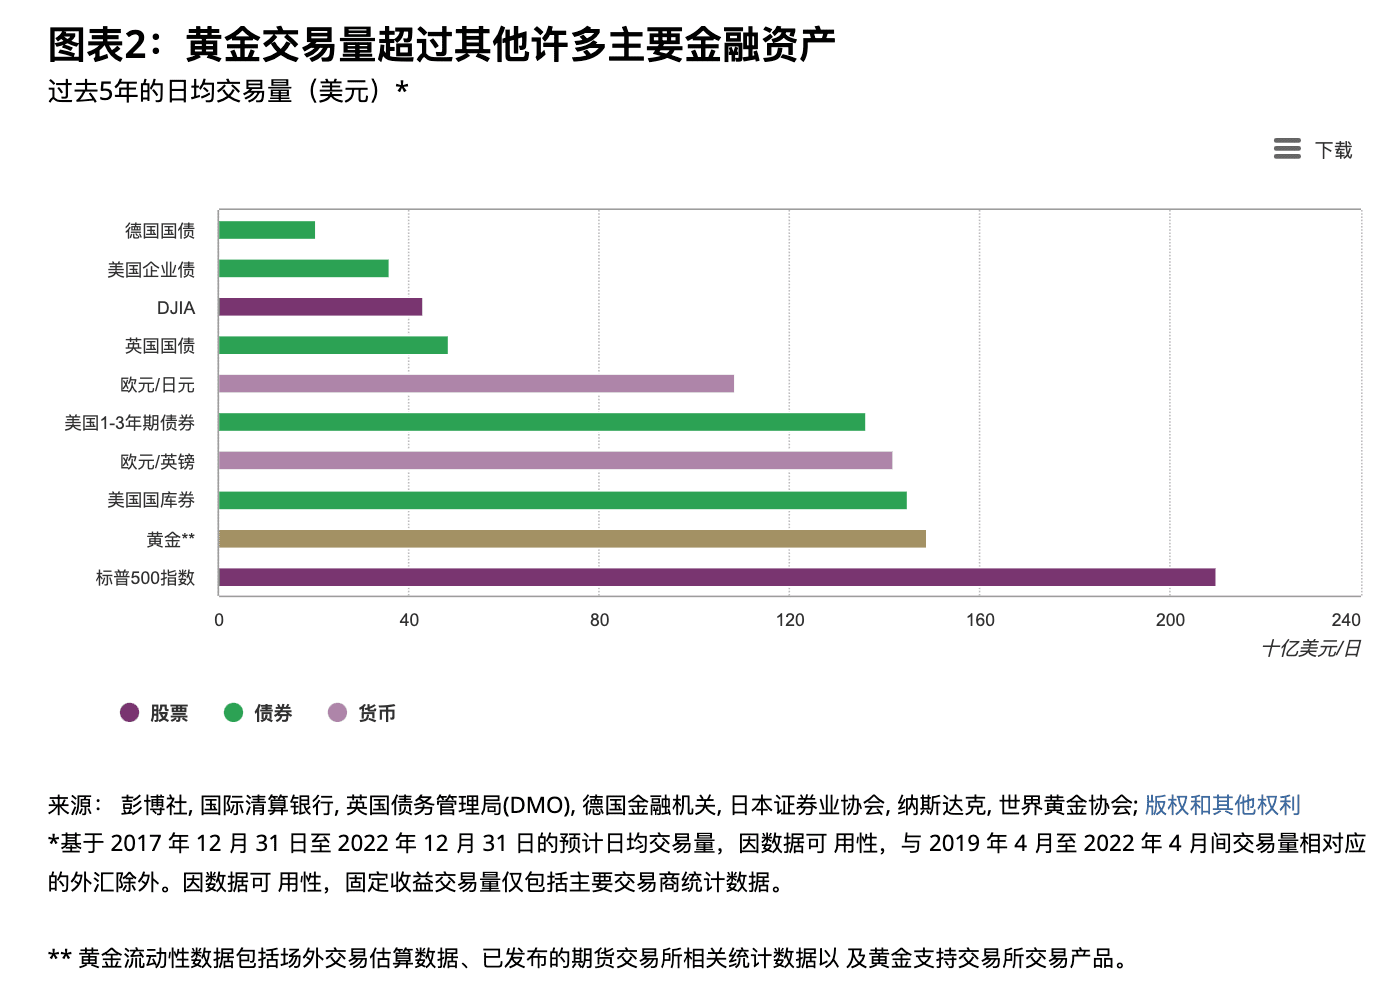
Average daily gold trading volume (in billion US dollars)
2、BTC
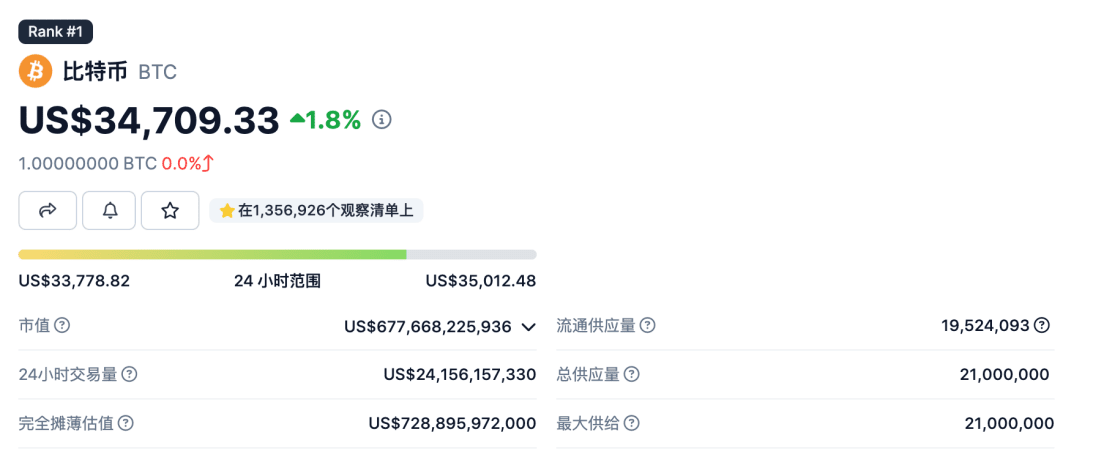
BTC's 24-hour trading volume is approximately US$24 billion, of which the majority of trading volume occurs in perpetual contracts. Recently, BTC's average daily trading volume has increased significantly, and its 24-hour trading volume is approximately 15% of gold (before this round of market conditions, it was probably less than 10%). The largest trading venues for spot and perpetual contracts are on Binance.
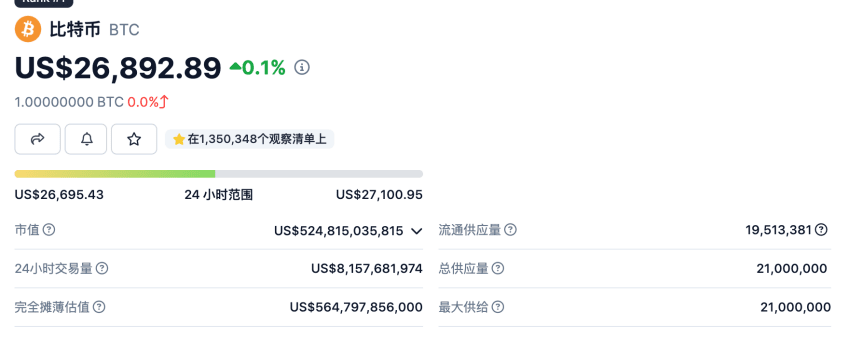
The current total market value of BTC is 677.7 billion US dollars, which is about 5.6% of the total market value of gold.
2. Factors affecting the prices of gold and BTC
1. Supply and demand
gold
Supply of Gold
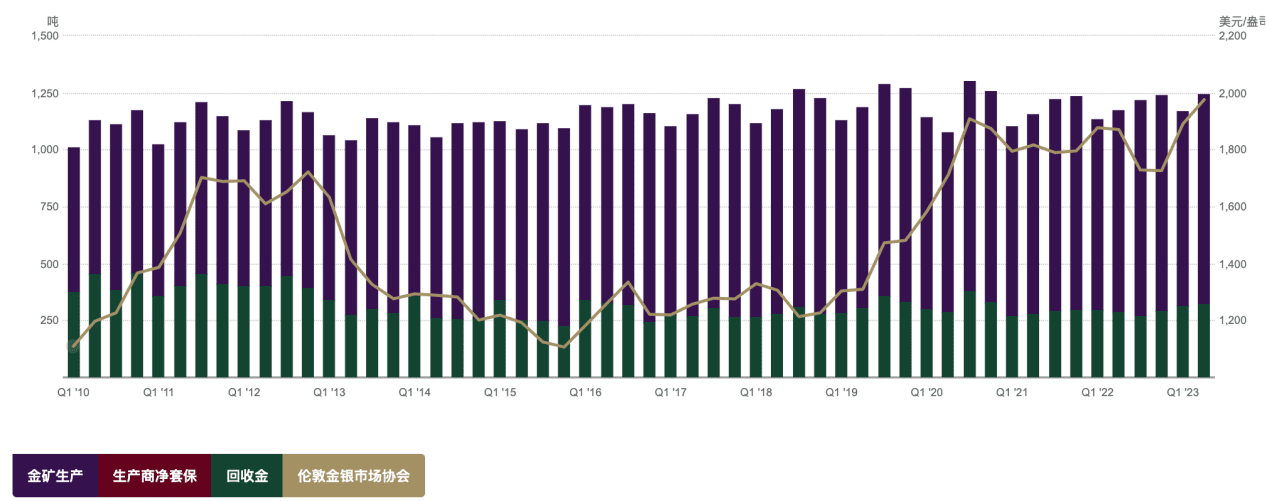
The annual increase in global gold supply is relatively stable, maintaining at around 4,800 tons from 2016 to 2022. Since gold is not easily lost, gold in the consumer sector still exists in some form and can be recycled back into the supply cycle. Therefore, the supply of gold comes from both mine production and gold recycling. In 2022, the total amount of gold recycled was 1,140.6 tons, and the total amount of mine production was 3,626.6 tons. About three-quarters of the supply came from gold mining, and one-quarter of the supply came from gold recycling. It can be seen from the figure below that the supply of gold is stable, and there has been no large trend fluctuations for many years. Therefore, the relatively rigid supply of gold has little impact on prices.
Demand for gold
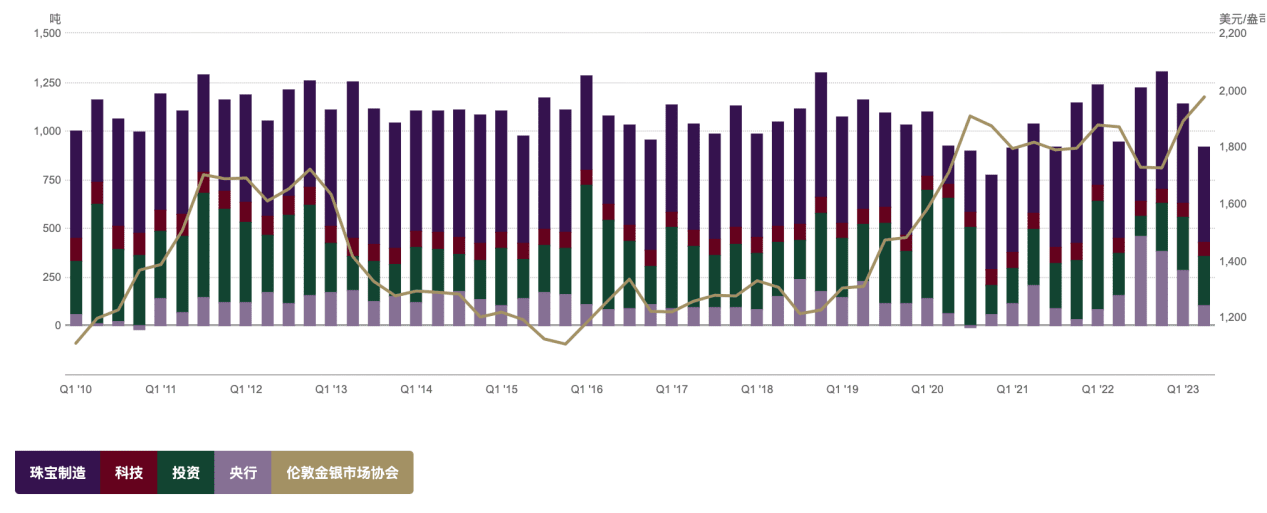
In 2022, the total global demand for gold will be 4712.5 tons. In the first half of 2023, the total global demand for gold will reach 2460 tons, a year-on-year increase of 5%. The demand for gold includes gold jewelry, medical technology and other consumer fields, investment demand, and central bank reserves of various countries. In 2022, the gold demand for jewelry manufacturing, technology, investment and central banks will be 2195.4 tons, 308.7 tons, 1126.8 tons and 1081.6 tons respectively. Among them, the largest proportion is jewelry manufacturing, reaching 47%, and the central bank demand accounts for 23%. Influenced by traditional culture, China and India are the world's largest consumers of gold jewelry. In 2022, China and India will account for 23% of the global demand for gold jewelry respectively.
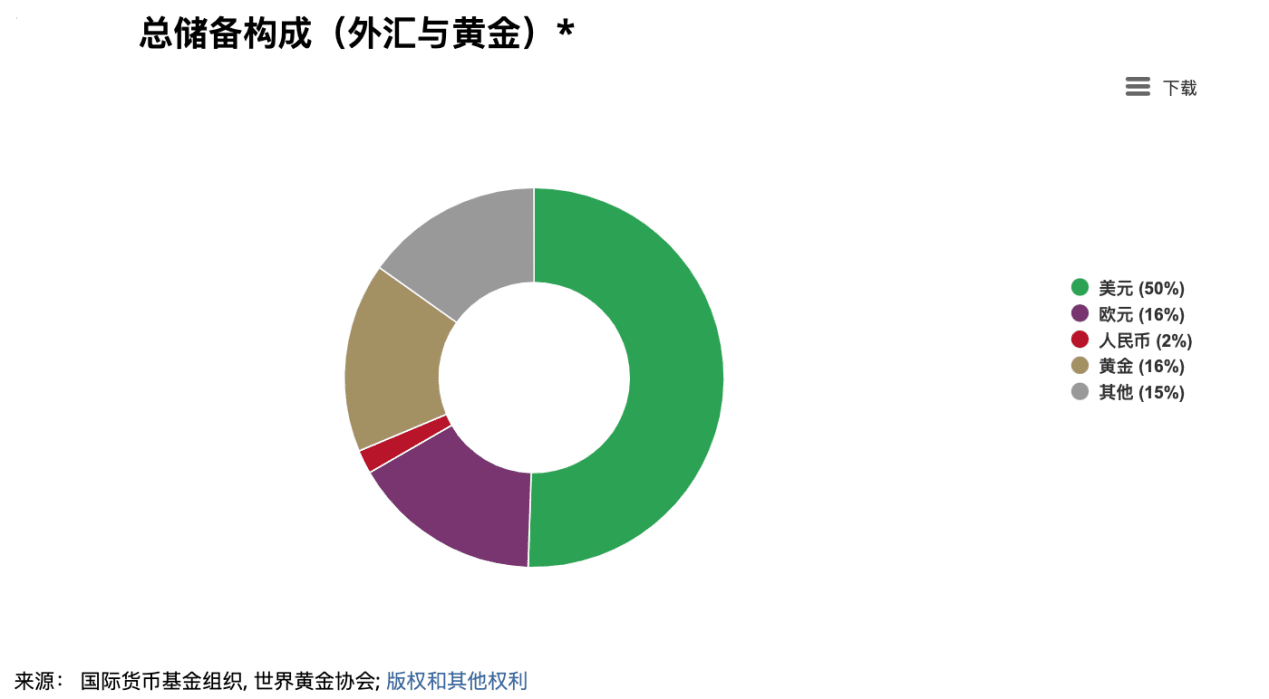
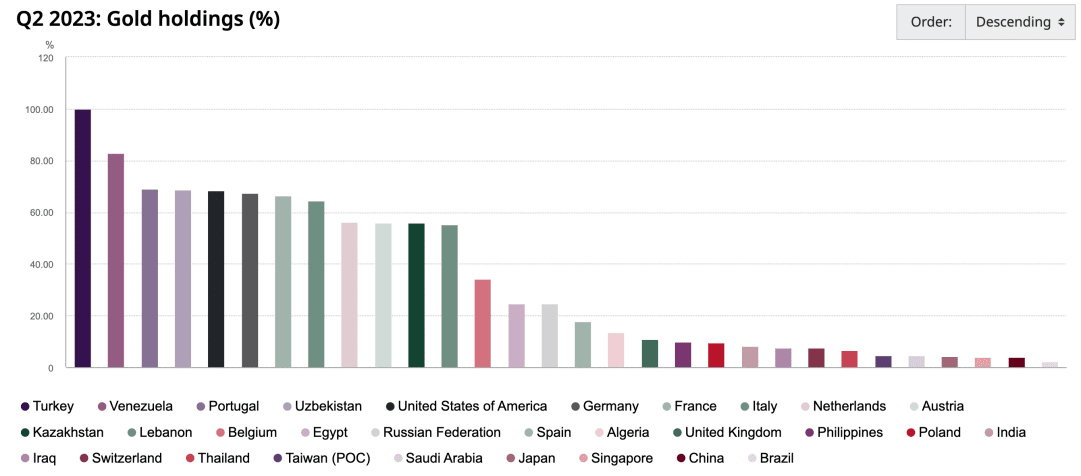
Gold is an important component of the global central bank reserves. The proportion of gold in central bank reserves varies greatly in different countries or regions. For example, the United States and Germany are close to 70%, while mainland China is only 3.8% and Japan is 4.2%. After the outbreak of the Russian-Ukrainian conflict, the United States and Europe froze the Russian central bank's US dollar foreign exchange reserves, causing non-US economies to waver in the security of the US dollar, increase the demand for diversified foreign exchange reserves, and turn to increasing gold reserves. With the advancement of de-dollarization in the future, the trend of global central banks systematically increasing their gold reserves will become more prominent in the long run.
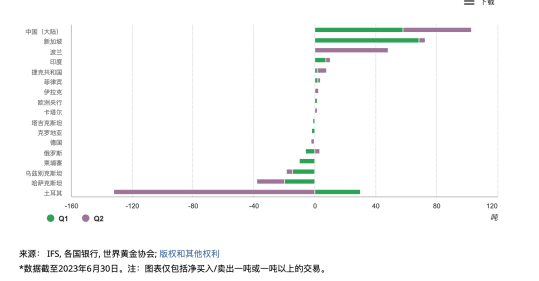
Top 20 countries/organizations with the largest gold reserves in the world
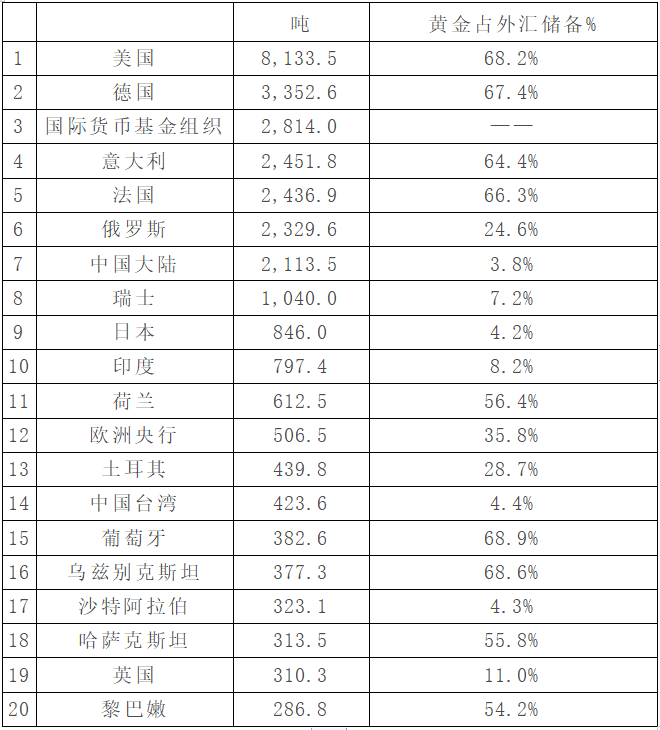
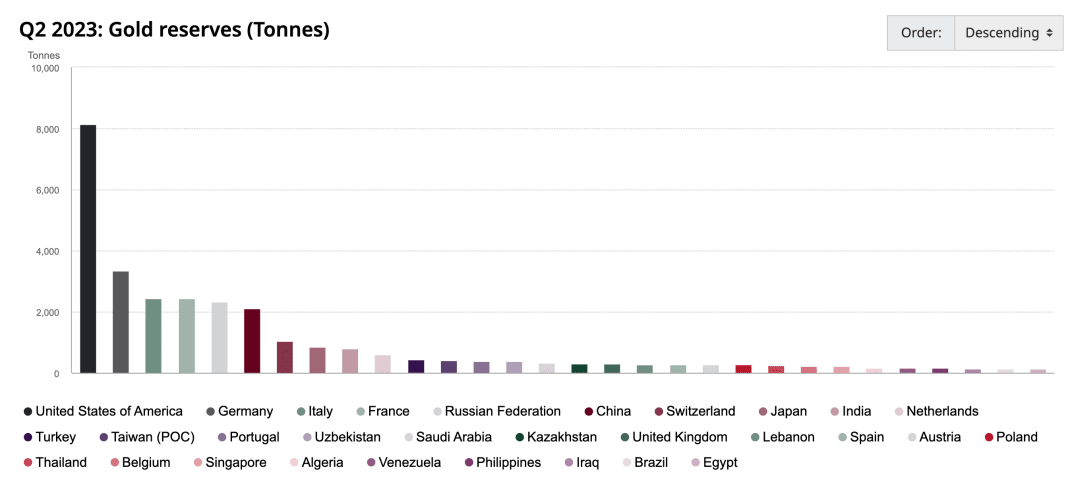
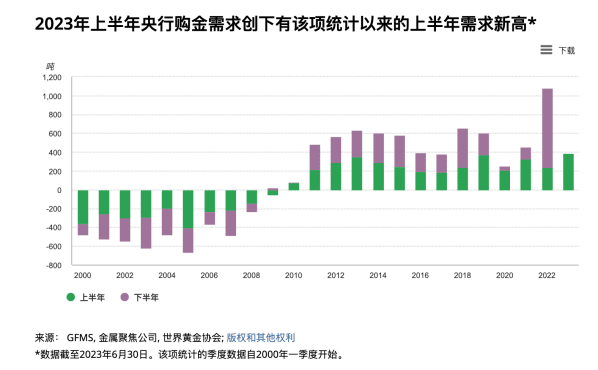
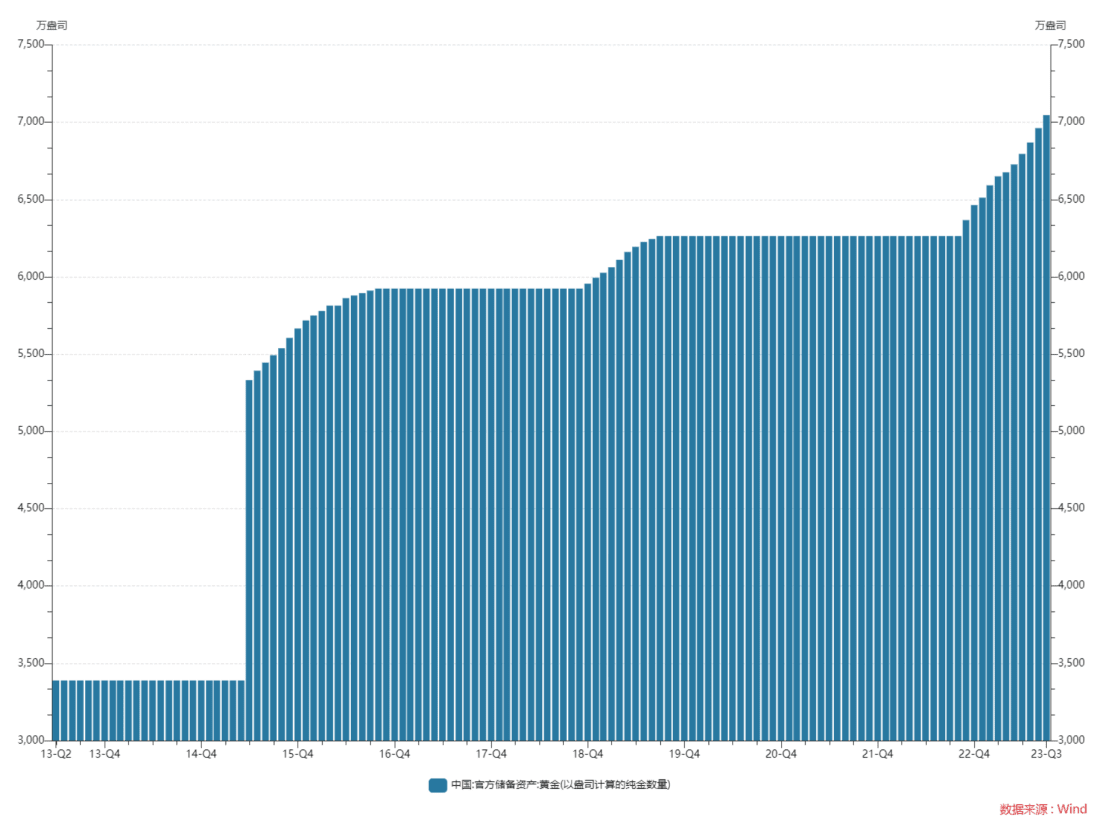
According to the World Gold Council, the central bank's demand for gold has risen sharply since the second half of 2022, with a total of 840.6 tons of gold purchased in the second half of 2022, 1.8 times the total amount for the whole year of 2021. The central bank's demand for gold in the first half of this year has increased compared with the second half of last year, but it has also reached 387 tons, setting a new high since the statistics were collected in 2000. Among them, Turkey's domestic demand for gold was strong due to the unstable political situation. The government temporarily banned the import of some gold bars and sold gold to the domestic market, which does not represent a change in Turkey's long-term gold strategy. Overall, Turkey's gold sales in the second quarter did not weaken the overall positive trend of central bank gold demand. Among them, the largest amount of gold purchases was made in mainland China, with purchases of 57.85 and 45.1 tons in the first and second quarters, respectively. According to data from October 13, China's gold reserves at the end of September were 70.46 million ounces, an increase of 840,000 ounces from the previous month, marking the 11th consecutive month of increase. In the past 11 months, the cumulative increase in the central bank's gold reserves reached 7.82 million ounces. Historically, the central bank's gold purchases have shown strategic characteristics and rarely sell.
BTC
The total supply of BTC is fixed at 21 million, and the current circulation is 19.51 million, accounting for approximately 90% of the total supply.
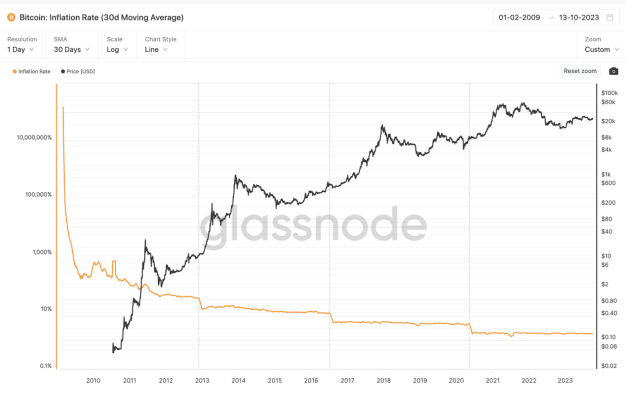
The current inflation rate of BTC is about 1.75%, and the annual inflation rate of gold is about 2%. The two are relatively close. Due to the setting of the Bitcoin halving, the inflation rate of Bitcoin BTC will be significantly lower than that of gold in the future. The most recent (2020) halving reduced the number of Bitcoins issued in each block from 12.5 to 6.25. Next A halving is expected to occur at the end of April 2024.
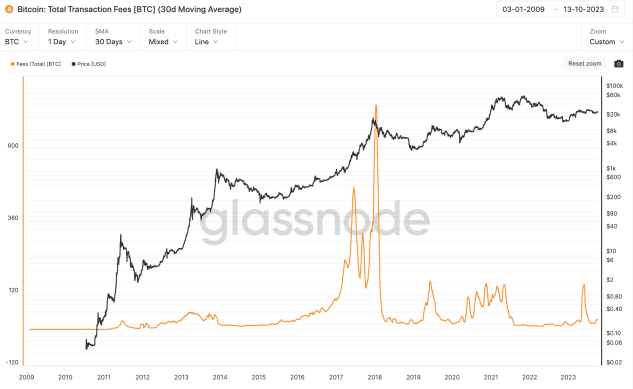
Demand is divided into two parts: handling fees and investment demand. BTC consumed about 20-30 BTC in handling fees every day for most of this year. It is roughly estimated that the handling fee expenditure is about 10,000 BTC per year, accounting for 0.5% of the total circulation. The rest is investment or speculation demand.
2. Macro environment
From the collapse of the Bretton Woods system to around 2000, inflation expectations and risk aversion were the main determinants of gold prices. In 2004, ETFs were introduced into the gold market. With the launch of gold ETFs and the expansion of gold-related trading markets, the financial attributes of gold have been enhanced, and real interest rates and the US dollar index have become important factors affecting gold prices.
US Dollar Index
Theoretically, the price of gold is usually inversely proportional to the value of the U.S. dollar. Because gold is priced in U.S. dollars, an increase in the U.S. dollar will make the price of gold relatively high. Gold becomes more expensive while its own price remains unchanged, putting downward pressure on the price of gold. ; From another perspective, from a long-term perspective, after the collapse of the Bretton Woods system, the U.S. dollar left the gold standard. Gold is essentially a hedge against credit currencies (mainly the U.S. dollar). The stronger the credit of the U.S. dollar, the lower the gold allocation value, and the U.S. dollar The weaker the credit, the higher the value of gold allocation. Periods during which gold and the U.S. dollar rise simultaneously are usually accompanied by geopolitical or economic shocks such as oil crises, subprime mortgage crises, and debt crises, and market caution and risk aversion have increased significantly.
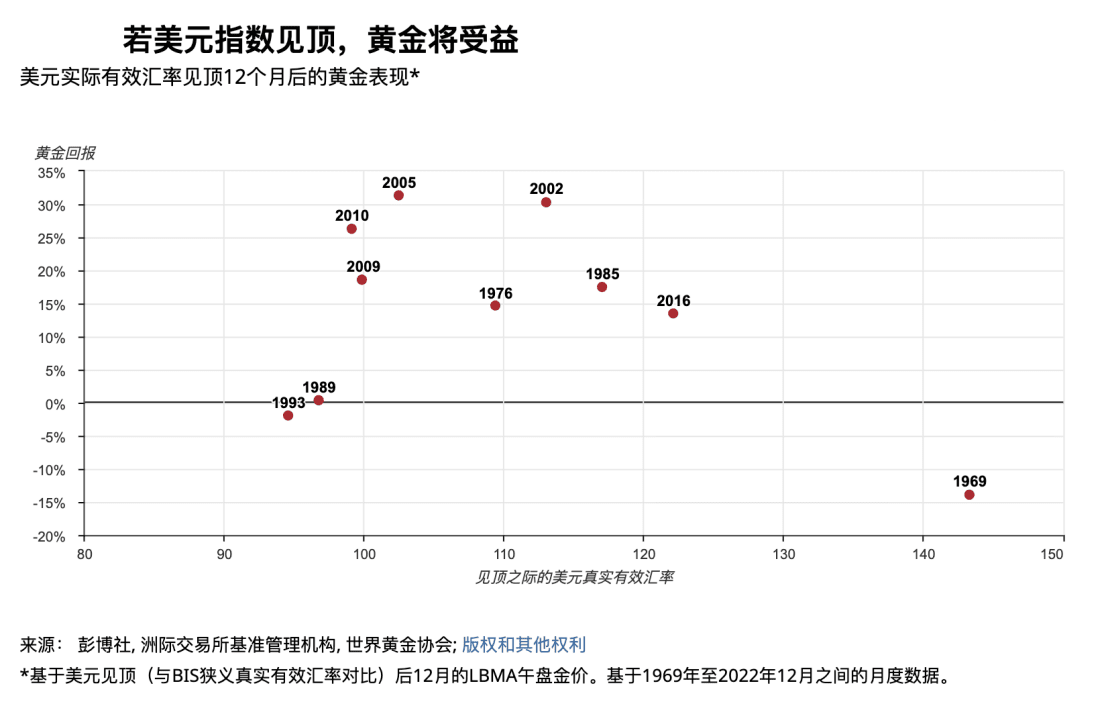
Historically, gold has had positive returns 80% of the time (average return +14%, median +16%) 12 months after the U.S. Dollar Index peaked.
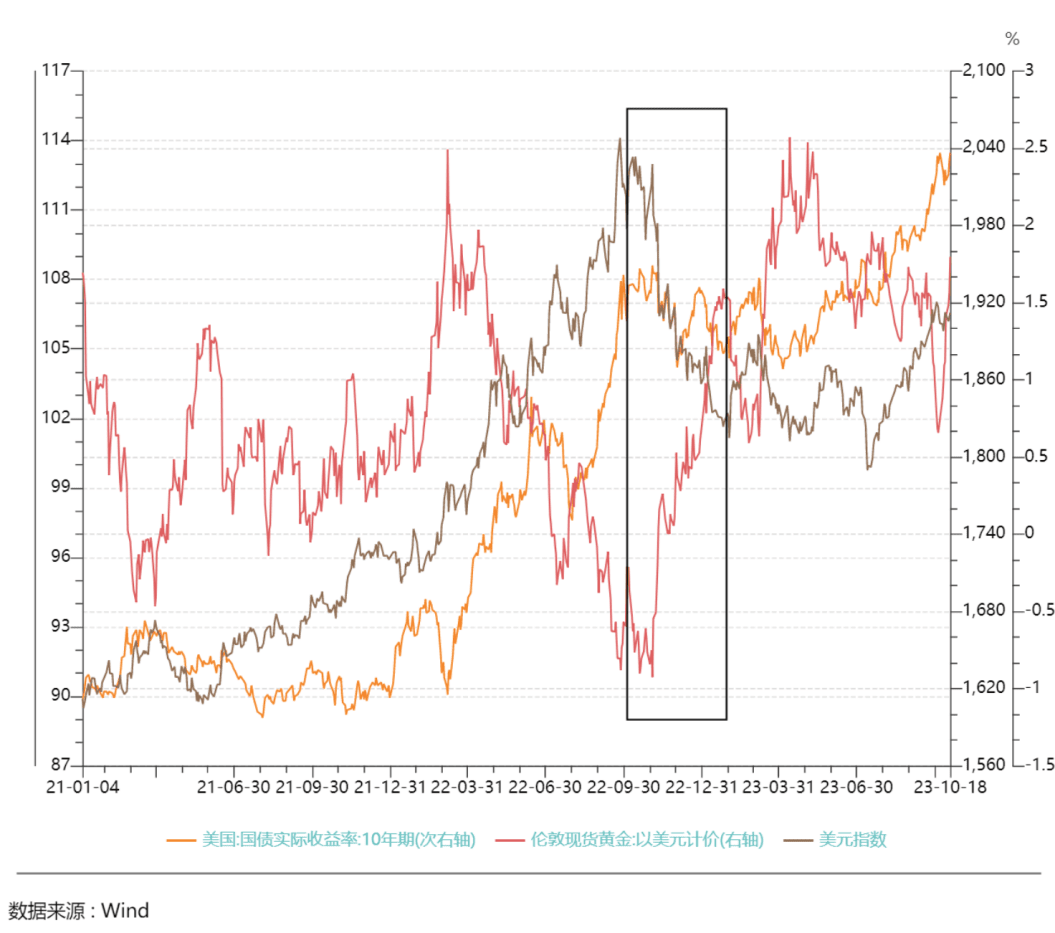
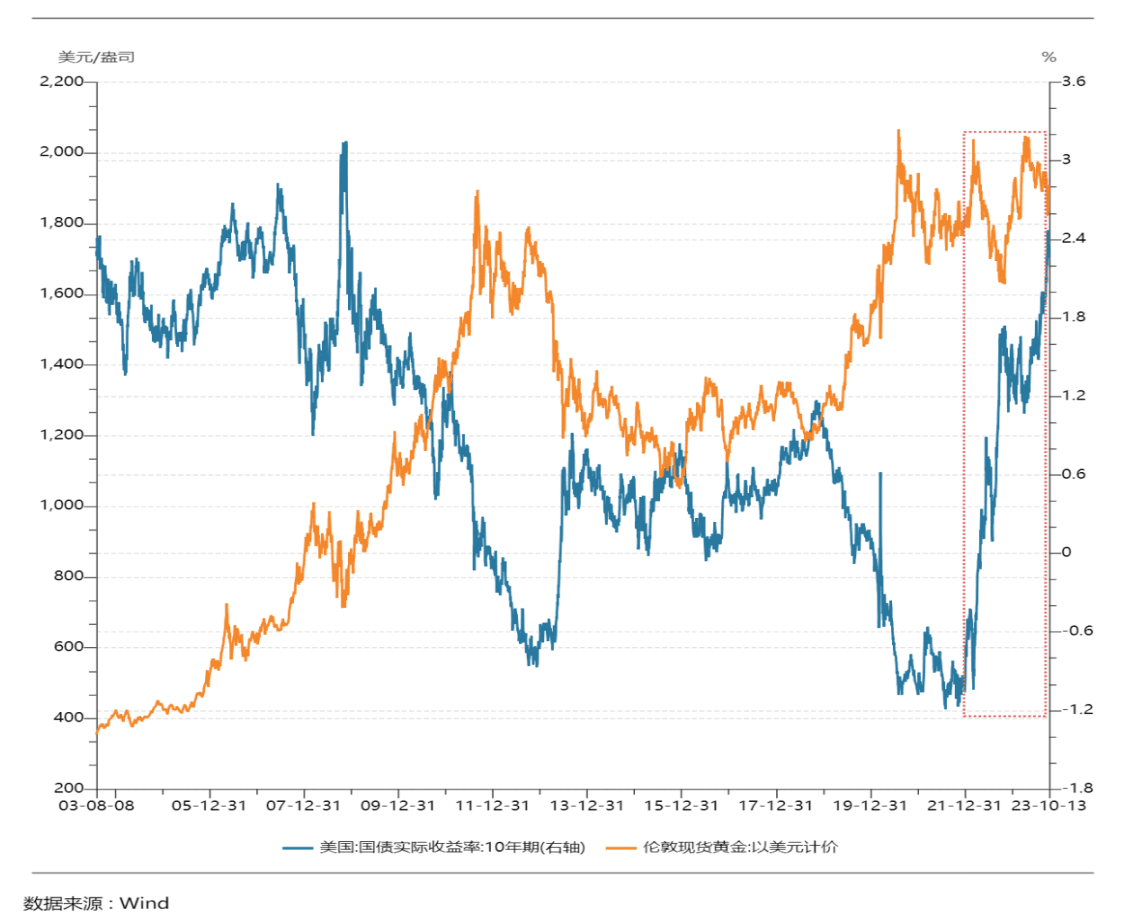
From the fourth quarter of 2022 to the beginning of 2023, the real yield of the US 10-year Treasury bond remained volatile without significant fluctuations, but the price of gold rose from a low of about $1,600 to $2,000 per ounce, and the price of gold deviated from the constraints of the long-term yield in the United States. From October 2022 to January 2023, due to the expectation of economic recovery after the release of the epidemic in China and the rebound of the European economy, the growth momentum outside the United States was stronger, causing the DXY to fall by nearly 9%. During this period, gold showed that it mainly followed the rise of the DXY.
U.S. Treasury real yield
Gold is an interest-free asset, while the U.S. dollar is an interest-bearing asset. The U.S. dollar yield and inflation expectations are the two forces driving the change in gold prices. The U.S. real interest rate (nominal interest rate - inflation expectations) is the opportunity cost of holding gold. In theory, the two are negatively correlated. From another perspective, the U.S. real interest rate represents the level of real rate of return that can be achieved in the U.S. dollar system, and is an indicator that can be used to measure the strength of the U.S. dollar credit.
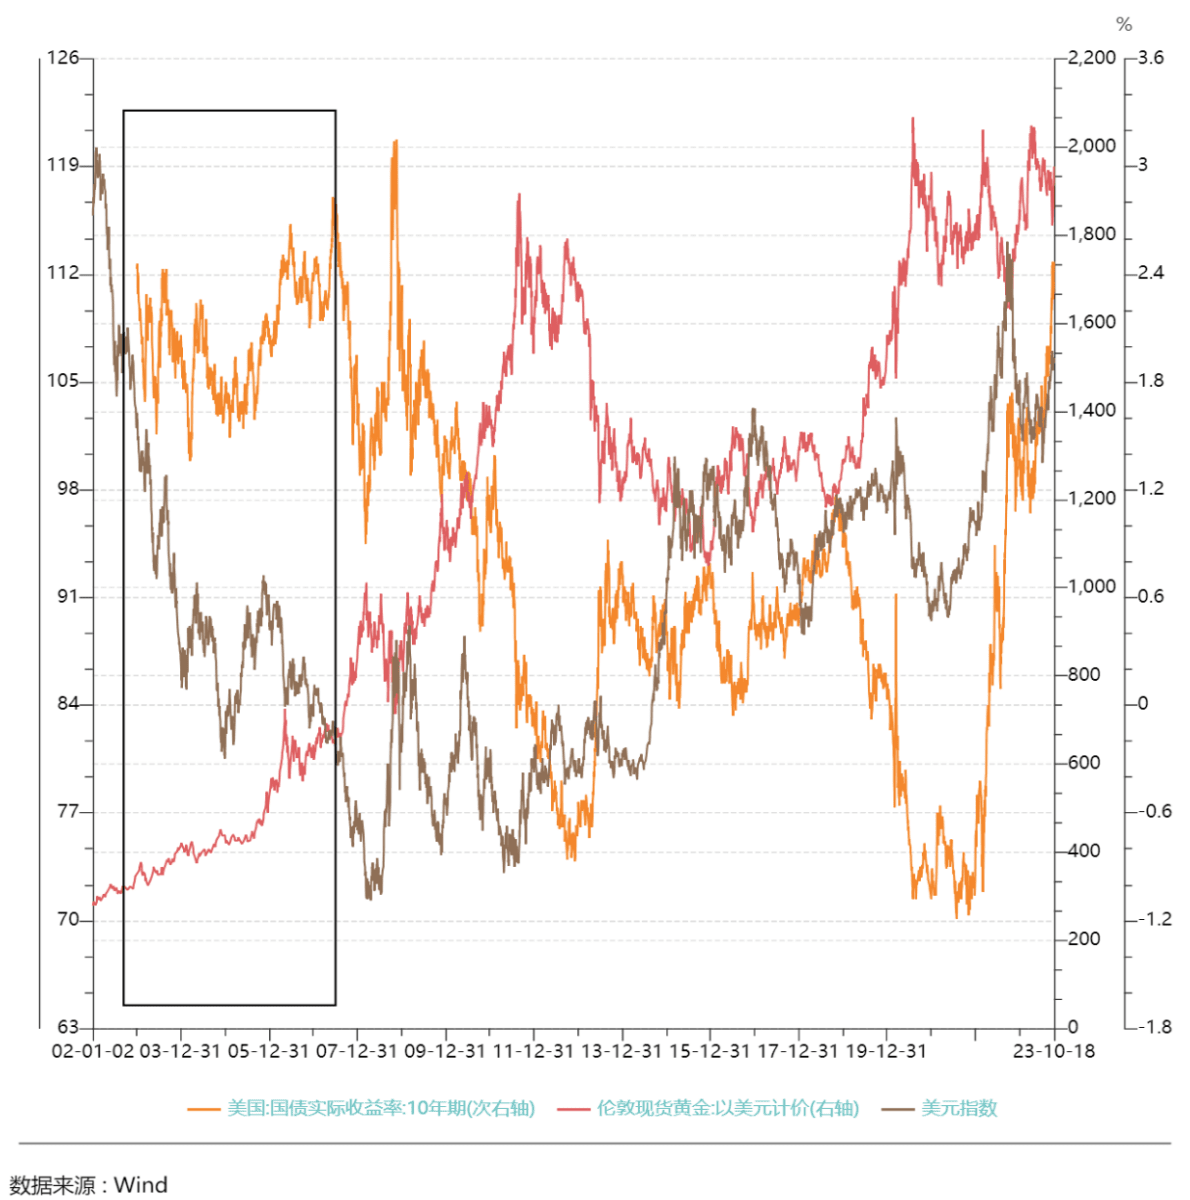
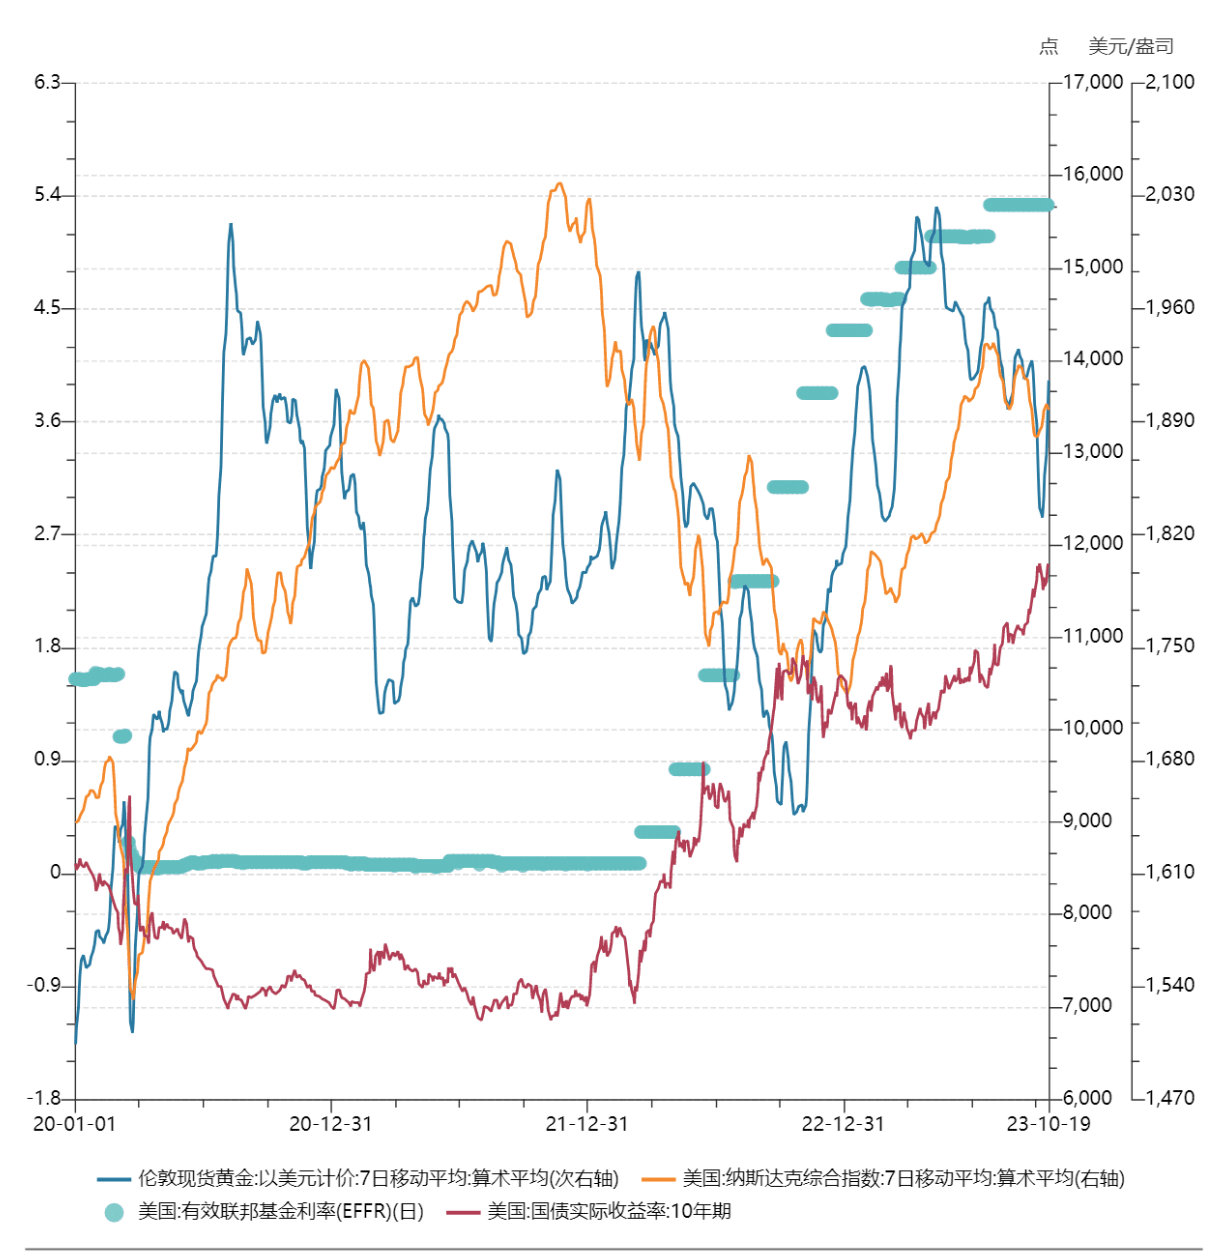
Both the U.S. dollar index and U.S. Treasury real yields can be used to explain changes in gold prices. The correlation between gold and the two is different in different periods. Since the 21st century, except for the period before 2005, most of the time, the price of gold has been significantly negatively correlated with the actual yield on 10-year U.S. Treasury bonds. The actual yield on U.S. Treasury bonds has dominated the gold price for a relatively longer period than the U.S. dollar index. In the longer term, it can be considered that real interest rates are the most important factor affecting the long-term price of gold.
Since 2022, the sensitivity of gold prices to real interest rates has declined. With the rapid rise in the real yield of U.S. Treasury bonds, the decline in gold prices has been lower than in history, reflecting good resilience. Neither the real yield nor the U.S. dollar index can fully explain the price changes of gold during this period. This may be mainly related to the central bank's gold buying boom starting in the second half of 2022. The World Gold Council released a report on October 9, saying that the total annual gold reserves of global central banks will maintain a strong growth trend. In August, global central bank gold reserves increased by 77 tons, an increase of 38% from July. Structural changes may be taking place on the demand side of the gold market.
3. Geopolitics
As the saying goes, buy gold in troubled times. The outbreak of geopolitical conflicts will increase the demand for safe-haven funds and stimulate a rapid short-term rise in gold prices. For example, after the Russia-Ukraine and Israel-Palestine conflicts in 2022, gold prices rose to around US$2,000 per ounce, which is the part that the US real yield and the US dollar cannot explain.
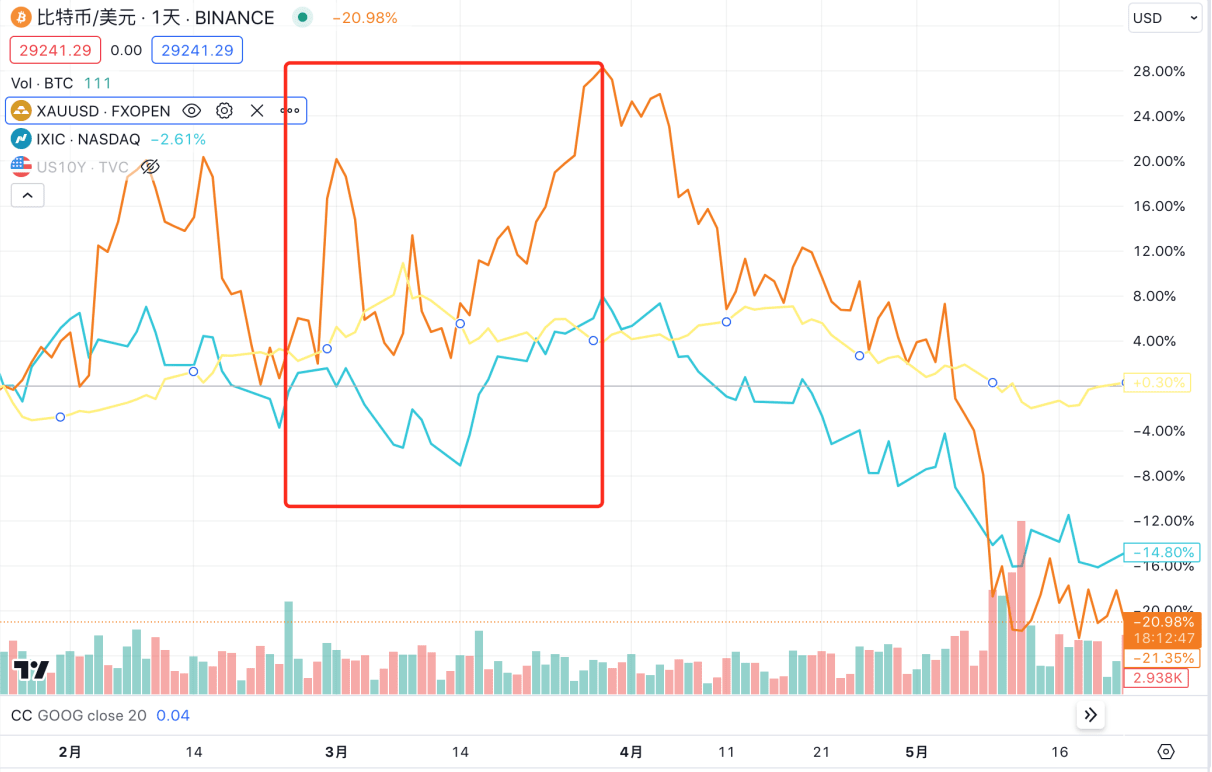
Changes in asset prices after the Russia-Ukraine war
On February 24, 2022, Russian President Vladimir Putin announced that the Russian army will conduct a military operation aimed at "demilitarizing and de-Nazifying Ukraine". The Russian army has no plans to occupy Ukrainian territory and supports the right of the Ukrainian people to self-determination. A few minutes after Putin's speech, the Russian army launched cruise missiles and ballistic missiles at military bases and airports in Kiev, Kharkiv and Dnipro, and the Ukrainian National Guard Command was destroyed. Subsequently, the Russian army launched an offensive against the Luhansk region, Sumy, Kharkiv, Chernigov, Zhytomyr and other places controlled by Ukraine. In the southern Ukrainian cities of Mariupol and Odessa, the Russian army carried out large-scale amphibious landings.
Between February 25 and March 8, gold continued to rise by about 8%. BTC did not show any obvious fluctuations in the three or four days after the war. It rose by 15% on March 1, but soon fell back to its position before the rise. As of March 8, when gold reached its highest point, BTC was reported at US$38,733, up 4% from the price before the conflict. The Nasdaq index fell by about 1.5%.
From March 9 to the end of March, as Europe, the United States and other countries announced sanctions against Russia, the market expected the worst outcome of the event to be realized, and the price of gold immediately fell from its historical high. After a brief fluctuation for a few days, BTC and the Nasdaq index began to rise together from March 14. During the rise of BTC and the Nasdaq, the price of gold fluctuated in situ. By the end of March, BTC rose by 20%, the increase in gold narrowed to 2% (compared to February 24), and the Nasdaq rose by 6%.
At the same time, the Federal Reserve started this round of interest rate hikes in March 2022. The impact of the Russia-Ukraine war on asset prices gradually weakened, and trading logic shifted to the Federal Reserve's interest rate hikes.
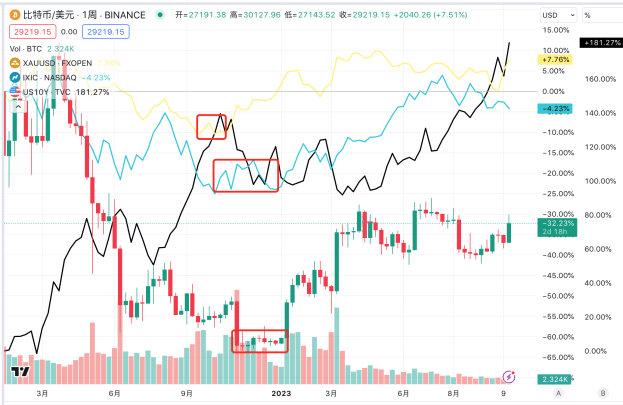
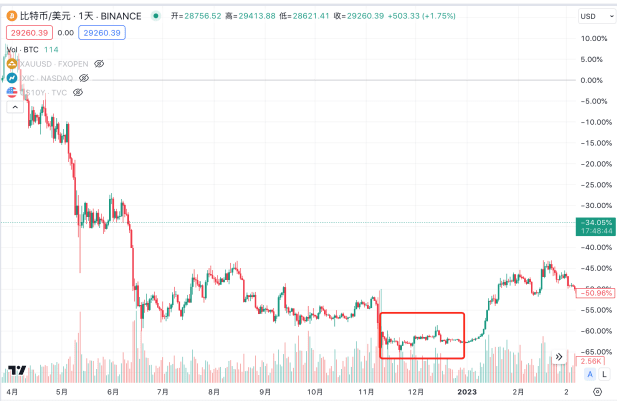
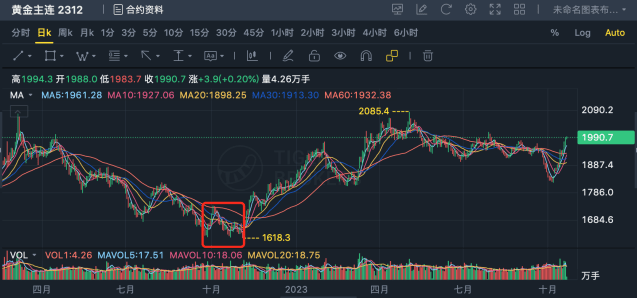
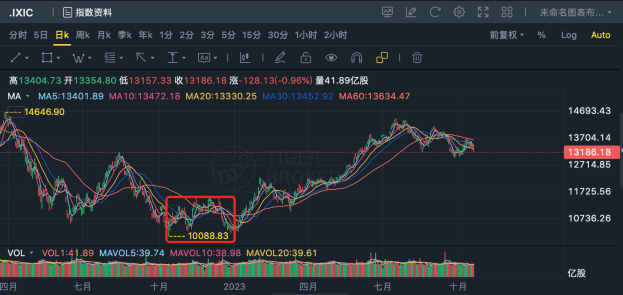
Starting from April, along with the interest rate hike, BTC and the Nasdaq index started a long period of decline at the same time. After a brief rise, the price of gold also started a long-term downward range on April 19. The Nasdaq index bottomed out at about 10,000 points in October 2022, with a cumulative decline of 28% since the interest rate hike; gold bottomed out at $1,615 in September and October, with a cumulative decline of 16% since the interest rate hike; BTC bottomed out at about $16,000 in November, with a cumulative decline of 66% since the interest rate hike.
After hitting the bottom, gold was the first to start a new round of market, and it has been rising continuously since early November, with the high point at $2,072 on May 4, up 28% from the low point. The market of BTC and Nasdaq index started 2 months later than gold. Since 2023, BTC and Nasdaq index have started to rise again synchronously. The high point of BTC and Nasdaq appeared synchronously in mid-July. BTC reached a high of around 31,500, up nearly 1 times from the low point, and the high point of Nasdaq reached 14,446, up 44% from the low point.
This wave of rise is mainly related to the peak of US Treasury bond interest rates in early November. Since early November, the downward trend of US Treasury bond interest rates has driven a significant rebound in risk asset prices. The main triggering factors are that the October CPI and core CPI data both fell beyond expectations, and the inversion of the 10Y-2Y US Treasury bond spread further deepened, reflecting that the market's expectations for the economy and inflation have been greatly revised down. The peak and decline of the US CPI and core CPI drove the peak and decline of the US 10-year Treasury yield, and also led to a slowdown in the pace of the Fed's interest rate hikes. Later, due to the AI boom in the Nasdaq, gold and BTC also had their own independent narratives to support the further upward movement of various markets.
Overall, judging from the degree of synchronization between BTC prices and gold after the Russia-Ukraine conflict, BTC does not demonstrate a strong safe-haven attribute.
Changes in asset prices since the Israeli-Palestinian conflict
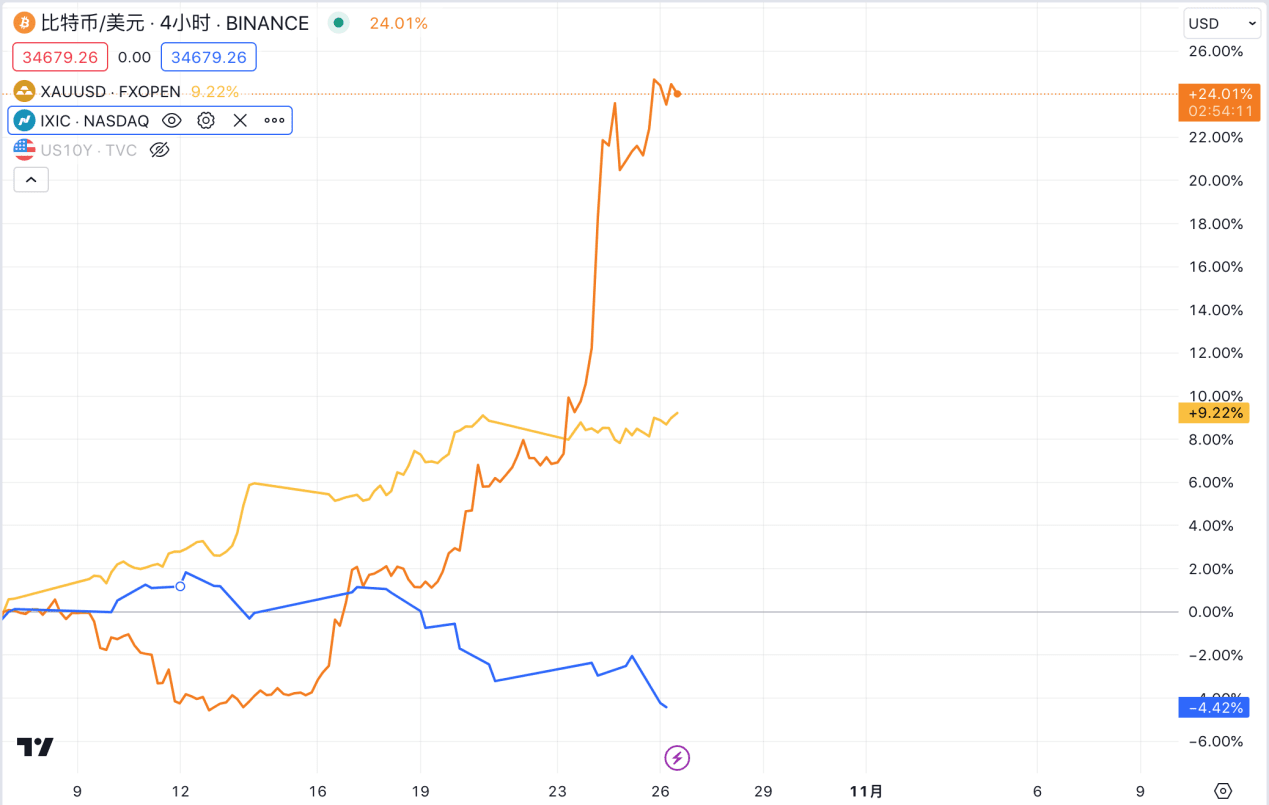
In the early morning of October 7, 2023, local time, the Palestinian Islamic Resistance Movement (Hamas) launched an operation codenamed "Al-Aqsa Flood", launching more than 5,000 rockets into Israel in a short period of time. Thousands of militants entered Israel from the Gaza Strip in a three-dimensional combat manner and clashed with the Israeli army. Israel subsequently launched multiple rounds of air strikes on the Gaza Strip, and Israeli Prime Minister Netanyahu announced that Israel had entered a "state of war", saying that the Israeli army would mobilize all its military forces to destroy Hamas.
Gold is the asset that has risen most significantly since the conflict, rising from 1,832 on October 9 to nearly 2,000 US dollars on October 26, an increase of about 8%, which coincidentally coincides with the increase during the Russia-Ukraine conflict; BTC fell from 28,000 to 26,770 from October 7 to 13, a drop of 4.4%, and began to rebound on the 13th. On the 16th, it experienced the BlackRock BTC ETF application approval oolong event. The daily line experienced a sharp rise and then a correction. It closed with half of the increase to 28,546. Later, the ETF continued to ferment as expected, and rose to 34,183 US dollars as of the 25th; the Nasdaq rose slightly from October 9 to 11, and began to fall from the 12th, falling from 13,672 points to 125,956 on October 20.
This time, the trends of BTC and Nasdaq are almost completely opposite, and they have developed independent trends. First of all, BTC's price performance is opposite to that of gold in nearly a week after the war broke out, which shows that BTC still does not reflect the attributes of a safe-haven asset. The subsequent rebound is because the market's confidence in the approval of BTC spot ETF has been rekindled and continues to ferment after the SEC did not appeal the Grayscale Bitcoin Trust case.
3. Is BTC a safe-haven asset?
BTC has a high degree of similarity with gold in terms of supply and demand, inflation, etc. From the perspective of model design and logic, BTC should have a safe-haven attribute. As Arthur Hayes explained in the article "For the War", war will lead to severe inflation. The common way for ordinary citizens to protect their property is to choose gold hard currency, but if a large-scale war breaks out on the homeland, the government may prohibit private ownership of precious metals, restrict precious metal transactions, and even force gold owners to sell their gold bars to the government at a low price. Holding strong currencies will also be subject to strict capital controls. Only Bitcoin's value and transmission network do not rely on government-chartered banking institutions, and it has no physical existence. Ordinary people can take it anywhere without being regulated. When facing a real war scenario, BTC is actually the best asset that is superior to gold and strong currencies.
However, judging from the actual price of the asset so far, BTC has not shown obvious safe-haven properties.
Supplement the asset price changes before the current round of the US dollar tide and the Russian-Ukrainian conflict to better understand the changes of various assets in a complete cycle. The outbreak of the new crown epidemic in early 2020 caused inflation expectations to fall sharply, forcing the Federal Reserve to slash interest rates to 0-0.25% and start unlimited QE in late March 2020. Asset prices rose collectively, with gold prices rising the fastest. In August 2020, the London gold price hit a record high of $2,075/ounce, and then began to retreat; from 6,631 on March 30, 2020 to 16,212 on November 21, 2021, the Nasdaq rose by 144%; during the same period, BTC rose from $6,850 to 58,716, a total increase of 757%.
Since 2020, with the influx of traditional funds, BTC prices have increasingly shown the characteristics of some major asset classes. During this period, the rise and fall of BTC is more in line with the trend of the Nasdaq. The difference in gold's price performance here is believed to reflect its function as a safe-haven asset during the special period of the epidemic. The spread of epidemic panic and concerns about severe economic deterioration are the reasons that have contributed to the rise in gold prices in addition to real interest rates. On the other hand, the COVID-19 epidemic has also caused layers of obstacles to the transportation of gold, prompting a rapid rise in gold prices.
We can find that whether from the long cycle of the rise and fall of the current round of US dollar tides or from the short-term geopolitical conflicts, BTC has not shown obvious safe-haven properties, but has shown a higher correlation with the Nasdaq index. It should be pointed out that the price of gold, a so-called safe-haven asset, shows very strong financial properties in the big cycle, and is also affected by interest rates in a longer period of time, maintaining the same price trend as the Nasdaq.
IV. Future Trend Outlook
In October, several Fed officials made dovish remarks. For example, the previously hawkish Dallas Fed President Logan said that rising U.S. Treasury yields may reduce the need for interest rate hikes; Fed Vice Chairman Jefferson said that the recent rise in bond yields will lead to a tightening of financial conditions when judging future monetary policy. In his speech at the New York Economic Club on Thursday, October 19, Federal Reserve Chairman Powell hinted that as long as recent efforts to reduce inflation continue to make progress, the rise in long-term U.S. Treasury yields may cause the central bank to continue to suspend interest rate hikes at the next meeting, but at the same time the Fed will continue to work to sustainably reduce inflation to 2%, and does not rule out the possibility of further rate hikes in the future. After Powell's speech, the probability of no rate hike in November implied by CME interest rate futures has risen to 99.9%, but the 10-year U.S. Treasury bond yield rose again last week and once broke through 5.0% during the session. The expectation of a rate hike in the short term is no longer a point of speculation for U.S. Treasury yield traders. The rise in interest rates on the day of the speech may be due to the interpretation of Powell's cautious remarks as hawkish arguments on the one hand, and on the other hand, it is also a concern that the U.S. fiscal policy may continue to expand and increase debt issuance.
In general, it is speculated that based on the current economic data, the 5% level of the 10-year US Treasury yield is the top position considered by the Fed. In the short term, the US Treasury yield will continue to run at a high level. In the long term, according to the dot chart and market forecasts, the Federal Reserve will most likely start to cut interest rates next year. At that time, the shift in the main axis of the Federal Reserve's monetary policy will change the most important underlying logic of global asset allocation in 2024. Overall, the configuration window for gold and BTC is near, and it is more a matter of timing.
1. Gold
The real yield of US Treasury bonds is still the main driving factor of gold prices. After the cycle reverses next year, the negative correlation between gold and the real yield of 10-year US Treasury bonds will be revived, and the real yield of US Treasury bonds will once again become the main and continuous price driver of gold prices; secondly, the multipolarization of the international monetary system is an inevitable trend. The promotion of "anti-globalization" and the rise of non-US currencies will hit the credit of the US dollar in the long term and support the central bank's continued gold purchases. Therefore, in the long run, gold is expected to usher in an upward cycle under the dual influence of cycle reversal and structural change forces, breaking through the previous historical highs.
In the short term, gold prices will remain volatile, and geopolitics will remain the main influencing factor. The price trend will depend on whether the Israeli-Palestinian conflict expands to other parts of the Middle East. The author believes that if the conflict is limited to the Israeli-Palestinian conflict, the growth of gold will most likely cease, and it will be difficult to break through the psychological pressure of $2,000 per ounce; if the Israeli-Palestinian conflict spreads to neighboring oil-producing countries such as Iran and Saudi Arabia, or even in extreme cases, triggers an oil embargo or a sharp drop in production, it may have a greater impact on the crude oil supply chain, prompting further increases in crude oil and gold. At the same time, the rise in energy prices and the transmission to other commodity prices will cause the CPI growth rate to rebound, making the macro environment more variable. Based on the current situation, the probability of the first situation may be higher.
2、BTC
Similarly, with the Fed starting the next cycle in 2024, the overall market liquidity will improve, the risk appetite of global investors will increase, and the unique market logic will be superimposed. Under the influence of ETF and halving, Bitcoin will reappear in the bull market and is expected to break through the previous high. The driving factor in the short term is still the SEC's approval of BTC ETF spot. The BTC price has recently risen sharply to more than US$34,000. Regarding the specific impact of spot ETFs on BTC prices and the prediction of BTC prices after approval, we will make an in-depth discussion in future research reports, so stay tuned.
This article only represents the author’s personal opinion and does not constitute investment advice to anyone.