
A. Market View
1. Macro liquidity
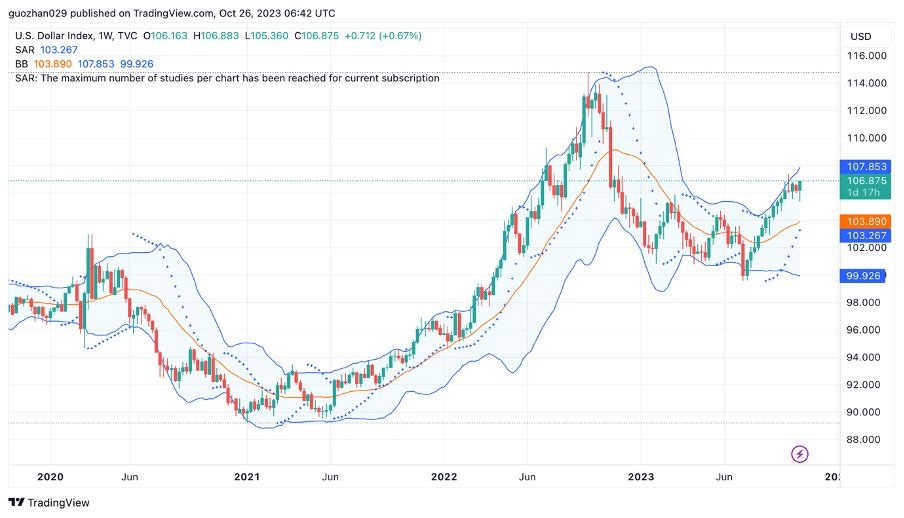
Monetary liquidity is tightening. Faced with macro and geopolitical uncertainties, market risk aversion has escalated, and the 10-year US Treasury yield is approaching the 5% mark. The US dollar index is upward, and the Fed's interest rate cut cycle is still far away. It is expected that there will be no interest rate hike in November, but there is a high probability of a rate hike in January next year. The US stock market has fallen continuously, hitting the lowest level in half a year. The crypto market has soared, and the linkage effect with the US stock market has weakened, and it has gone out of the annual high independent market.
2. Market conditions
The top 100 companies with the highest market capitalization:
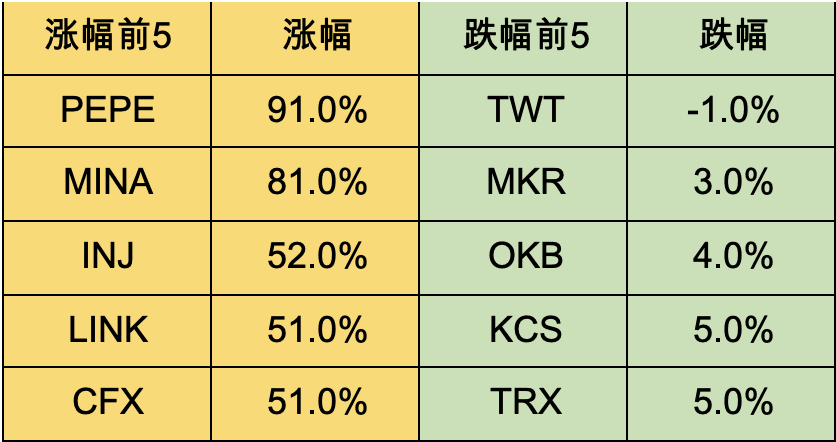
BTC surged this week, and the market has become more optimistic about the approval of spot ETFs. The altcoins have generally risen, and the hot spots are around public chains and meme concepts. The market automatically chose the direction with the least resistance. The public chains are mainly non-ETH related public chains, such as SOL, MINA, CFX, KUJI, etc., which are characterized by less ambush funds and easy for dealers to pull the market. However, ETH-related second layers such as ARB and OP were avoided by hype funds because of the large amount of funds ambushed in the Cancun upgrade in the early stage. At the same time, the life on the chain began to recover, and many new meme coins began to emerge, and the meme coin season is coming. Value investors like to invest in public chains, and retail investors like to invest in emotional memes. Everyone has a bright future.
1. PEPE: The team recently destroyed $7 million worth of tokens, and it feels like there will be some action later. PEPE broke through the weekly line, with large trading volume and high market recognition. The meme coin has the characteristics of 10 times and then halved, halved and then 10 times, which is suitable for buying at new highs and integers. Other memes such as Harry Potter bitcon and joe coin have also increased several times. 2. MINA: It is a lightweight ZK public chain, listed on the Korean exchange upbit. Recently, the expected effect of the Korean exchange listing is obvious, and there are generally several times of speculation increase, such as POLYX, CYBER, etc. 3. TRB: It is a domestic oracle project with poor fundamentals. The recent price broke through $100, and the speculation pulled the market more than 10 times. Several main addresses control 30% of the market, which is a typical market maker stock. There are also BLZ, INJ, etc. of the same type, pay attention to the risk of short squeeze.
3. BTC market
1) On-chain data
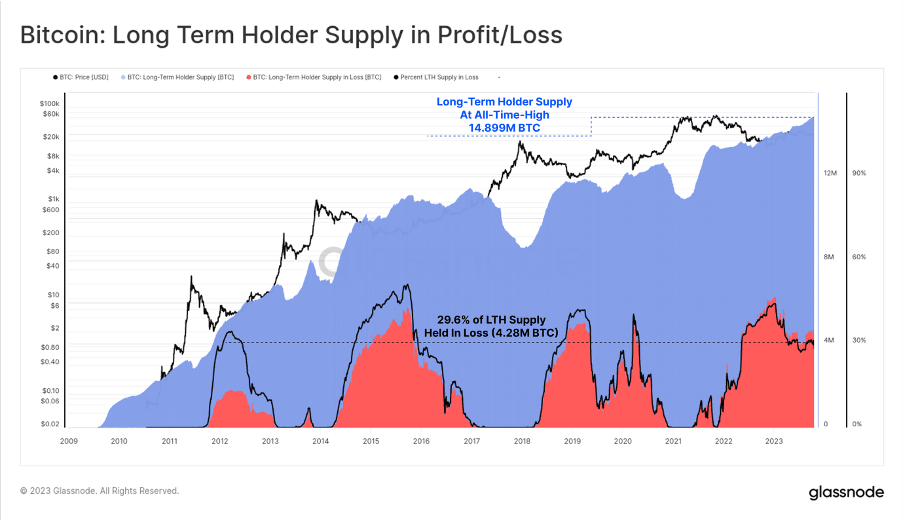
80% of BTC holding addresses have achieved profitability. From the trading volume of Binance Exchange, it can be seen that this is the second highest level since April since the end of the fee-free period. As the market approaches the high point of the year to date, a large part of the holding addresses have recovered from losses to profits.
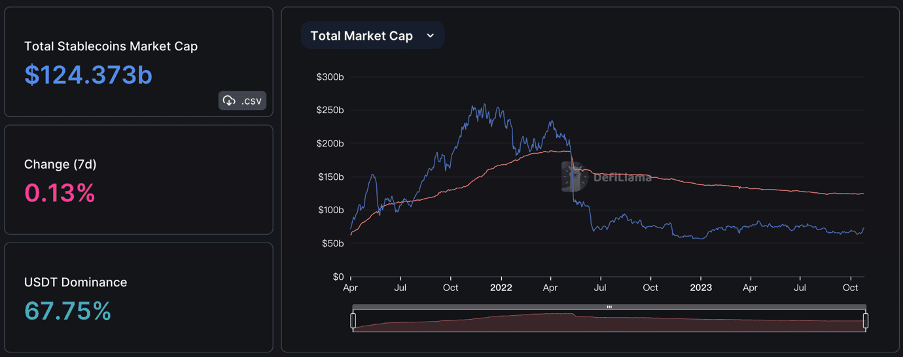
The total market value of stablecoins remained flat or slightly increased. In the past week, the market value of USDT, the main trading force, increased by more than 630 million US dollars, and the current market value has exceeded 84 billion US dollars. As long as the trend can continue, the market can get out of the bottom.
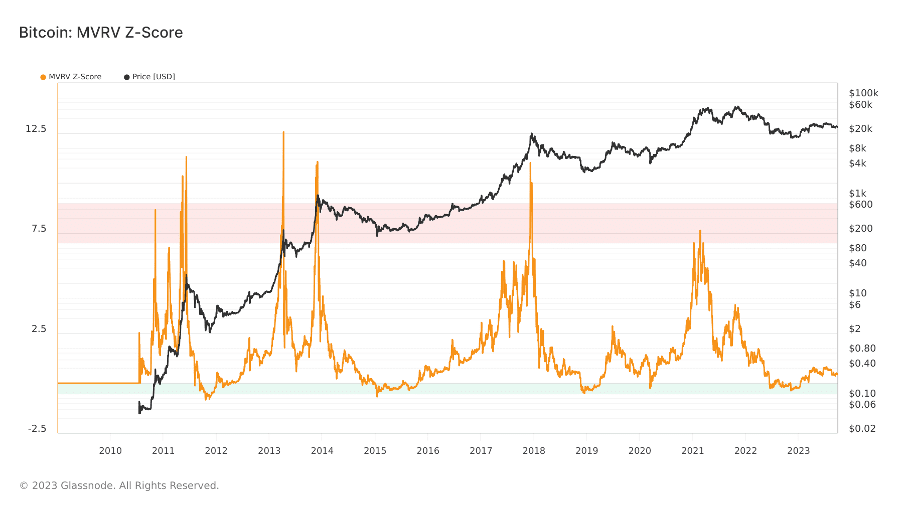
The long-term trend indicator MVRV-ZScore is based on the total market cost and reflects the overall profitability of the market. When the indicator is greater than 6, it is the top range; when the indicator is less than 2, it is the bottom range. MVRV falls below the key level of 1, and the holders are generally in a loss state. The current indicator is 1.03, entering the recovery stage.
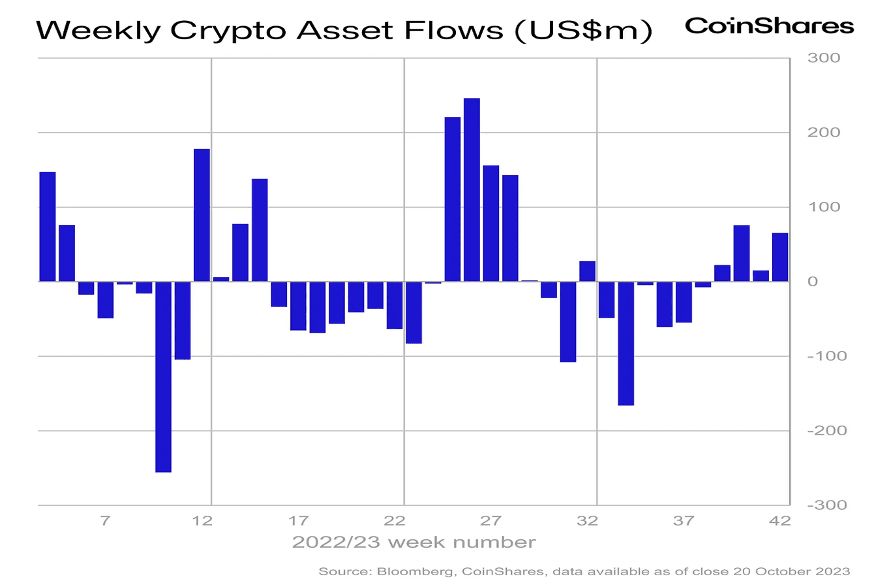
Crypto asset investment products have seen net inflows for four consecutive weeks. The recent inflows may be related to the news of the launch of a BTC spot ETF in the United States, with total funds reaching $66 million. SOL saw a further inflow of $15 million last week, making it the most popular altcoin so far this year. The continued concerns about ETH led to an outflow of $7 million, which was the only altcoin to experience outflows last week, in stark contrast to SOL.
2) Futures market
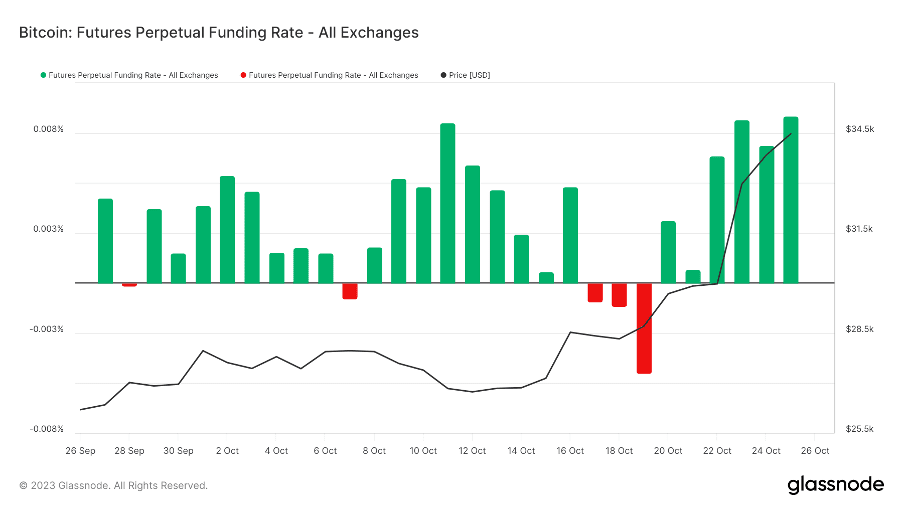
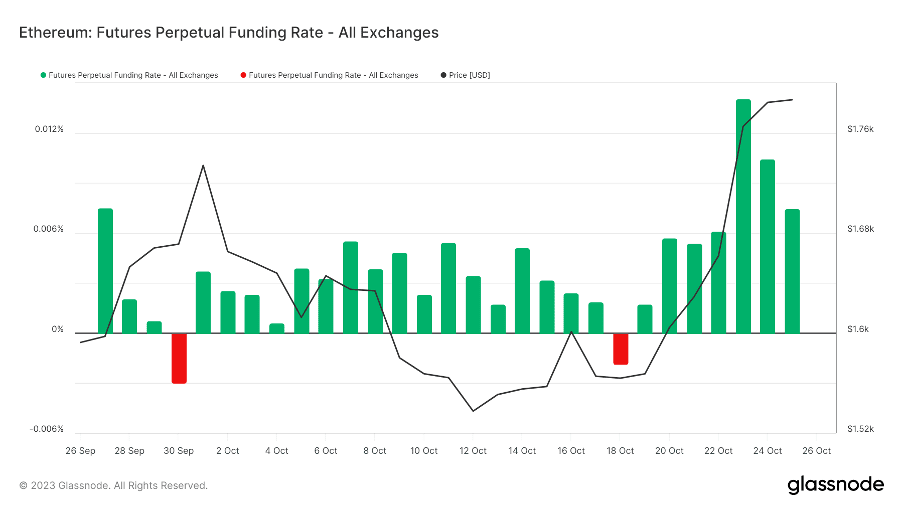
Futures funding rate: This week's rate is positive, and the main funds choose to go long. The rate is 0.05-0.1%, and there is more long leverage, which is the short-term top of the market; the rate is -0.1-0%, and there is more short leverage, which is the short-term bottom of the market.
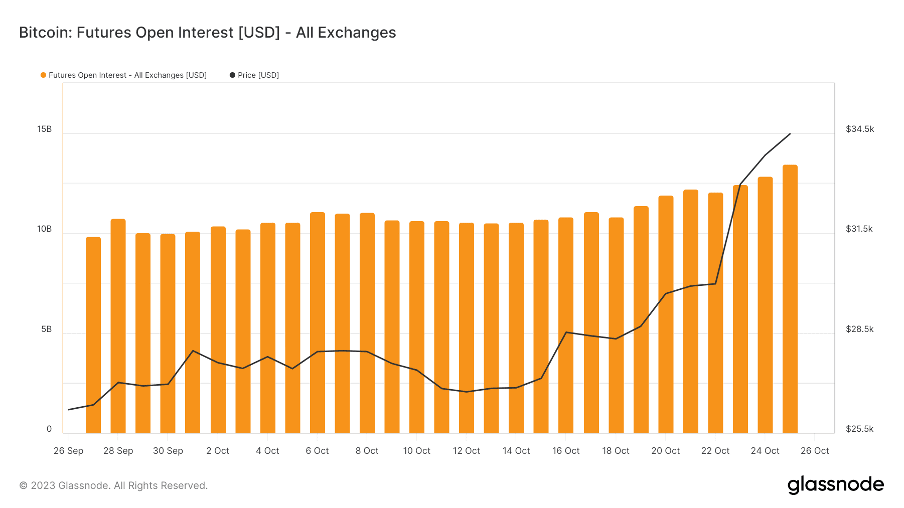
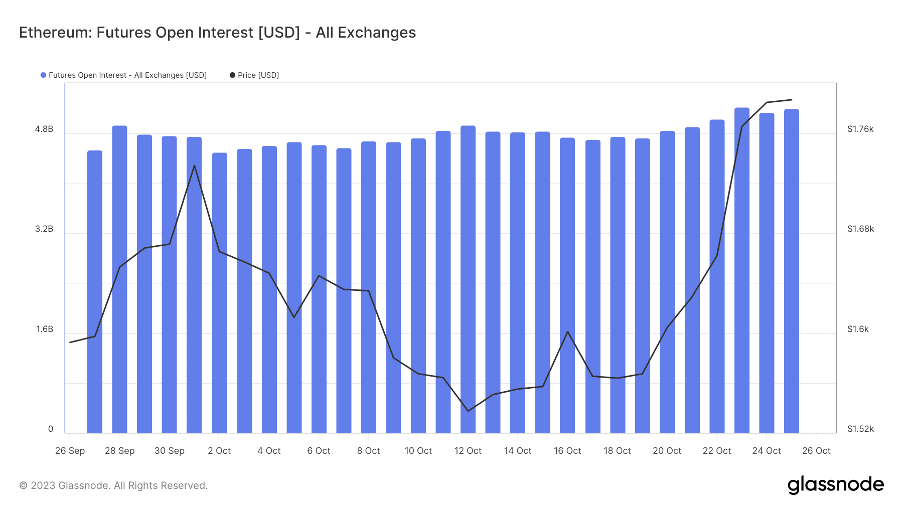
Futures open interest: This week, total BTC open interest increased significantly, in sync with prices, with major funds entering the market and optimistic about the future market.
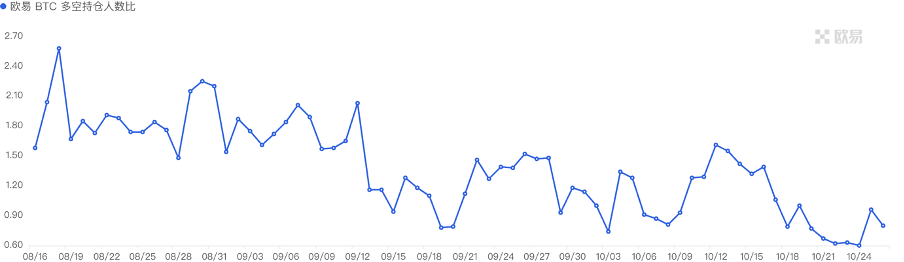
Futures long-short ratio: 0.9. Retail investor sentiment is bearish. Retail investor sentiment is often a reverse indicator. Below 0.7, it is more panic, and above 2.0, it is more greedy. The long-short ratio data fluctuates greatly, and its reference value is weakened.
3) Spot market
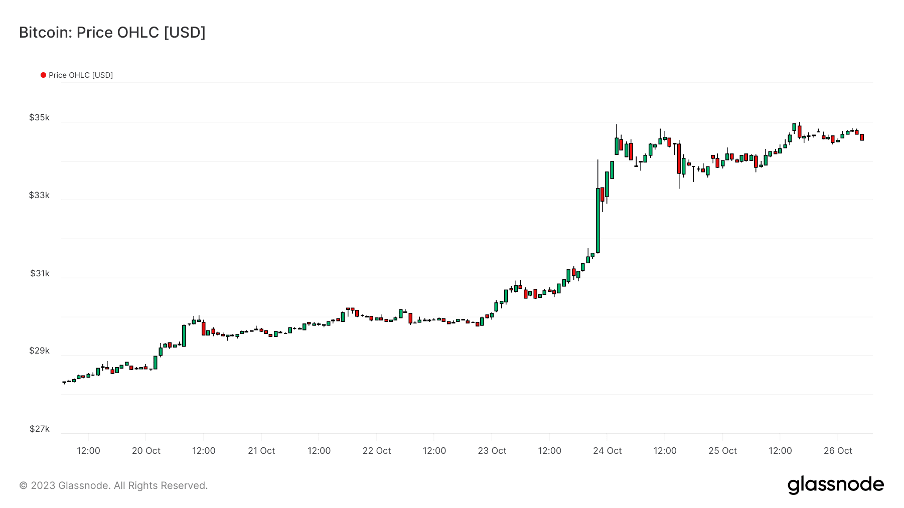
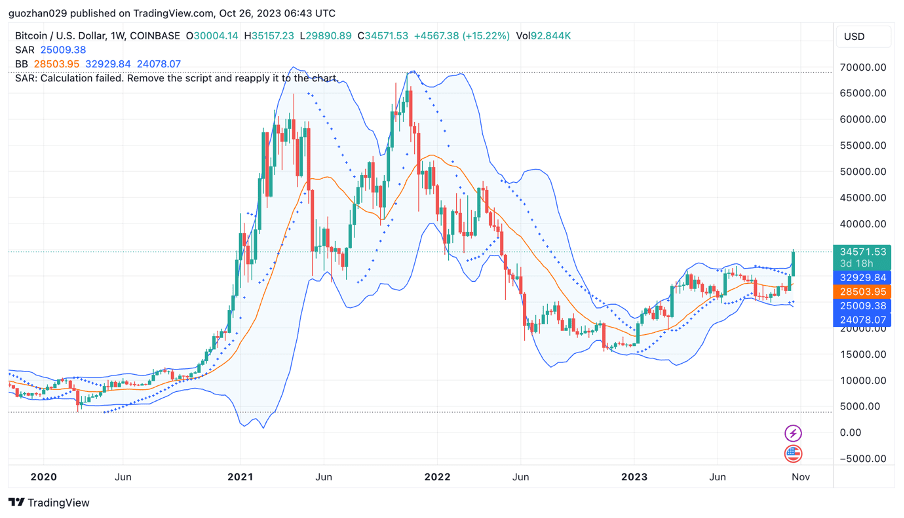
BTC breaks the annual high. Short positions were liquidated in a series, and the price of BTC rose rapidly from $30,000 to $35,000 in just a few hours. On the news front, BlackRock's spot ETF has obtained pre-listing preparations. Technically, BTC stands firm on the BOLL weekly bull-bear dividing line of 28,000, and the upward trend is expected to continue. The RSI indicator is 85 and enters the overbought range. The short-term market sentiment is greedy, so beware of the risk of a pullback. BTC's market share has reached 53%, and 55% is an important threshold. If it goes down from 55% in the future, altcoins may rotate to more opportunities.
B. Market Data
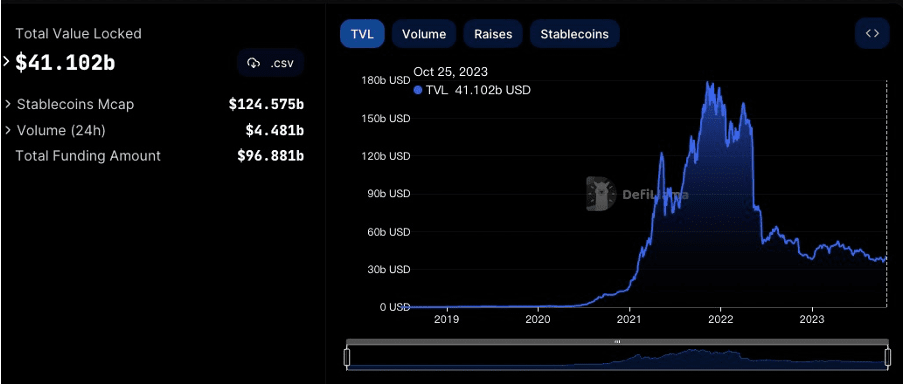
1. Total locked-up amount of public chains
2. TVL Proportion of Each Public Chain
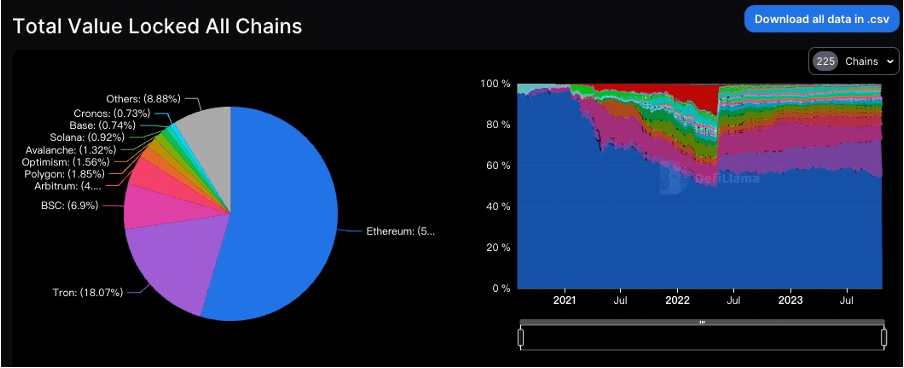
This week, TVL rose by nearly 500 million USD, with an increase of nearly 13%. Last week, BTC broke through the resistance levels and reached a price close to 36,000. Although this bottom rebound has brought infinite possibilities and hope to the market, it is still impossible to judge whether the bear market is about to end. This week, TVL, ETH chain rose by nearly 15%, ARB chain rose by 9.2%, OP chain rose by 6.8%, TRON and POLYGON chain rose by more than 10%, and SOLANA chain rose by more than 20%. Except for the BASE chain, which fell by 1.3%, the remaining mainstream public chains all rose.
3. Locked Amount of Each Chain Protocol
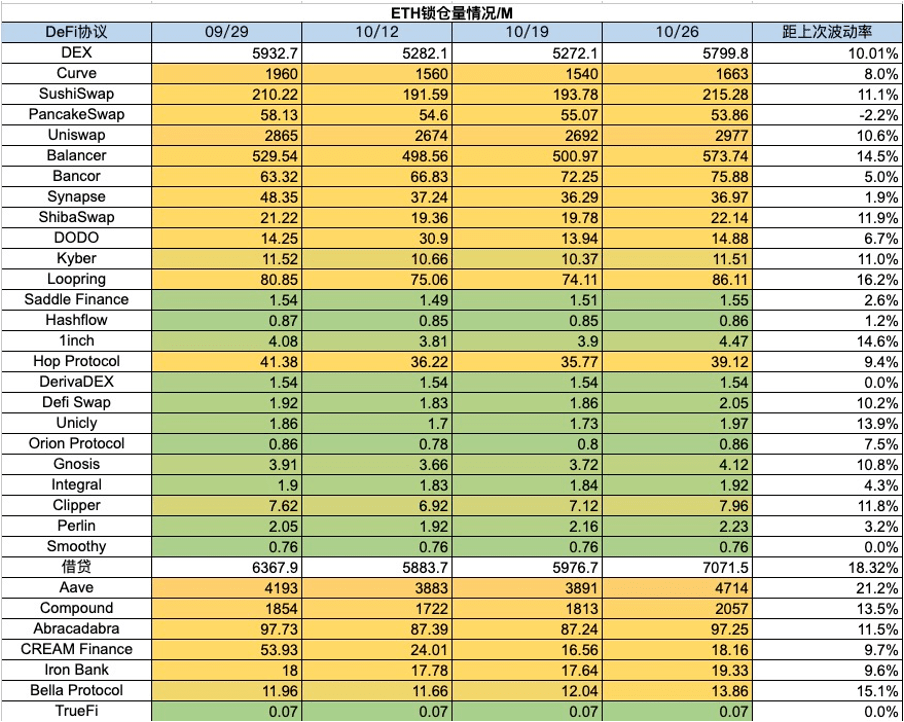
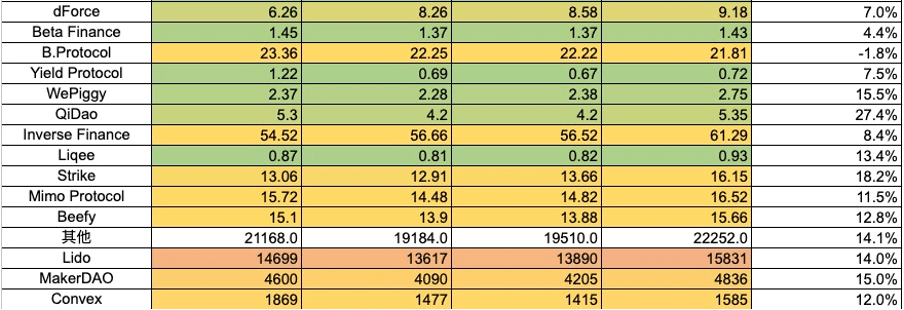
1) ETH locked amount
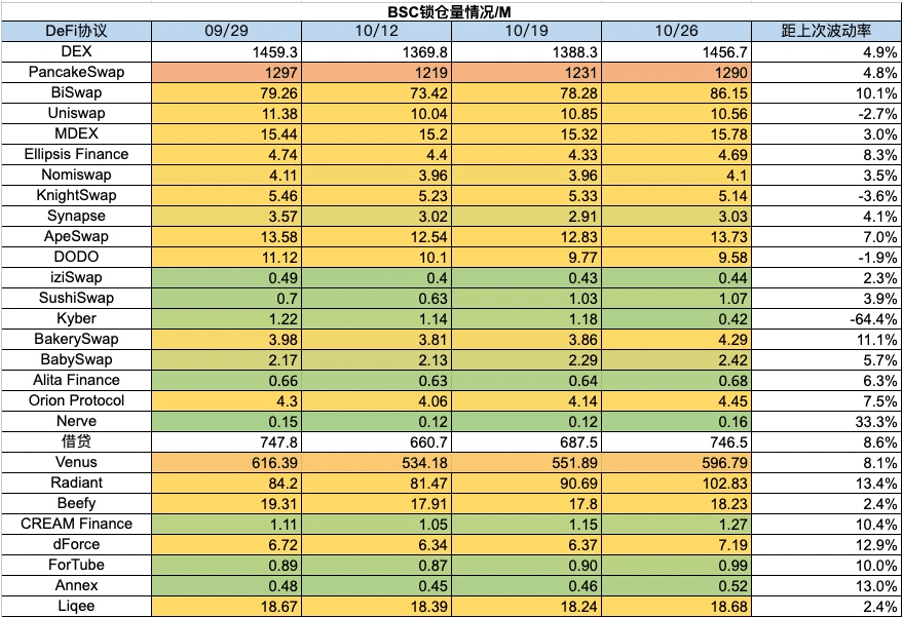
2) BSC locked amount
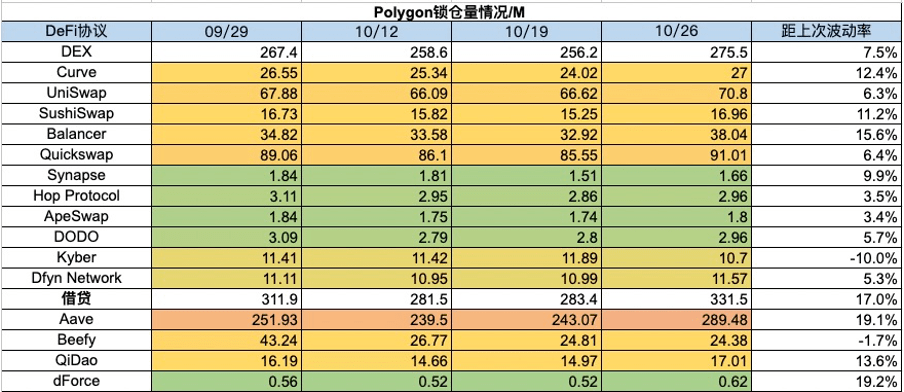
3) Polygon locked-up amount
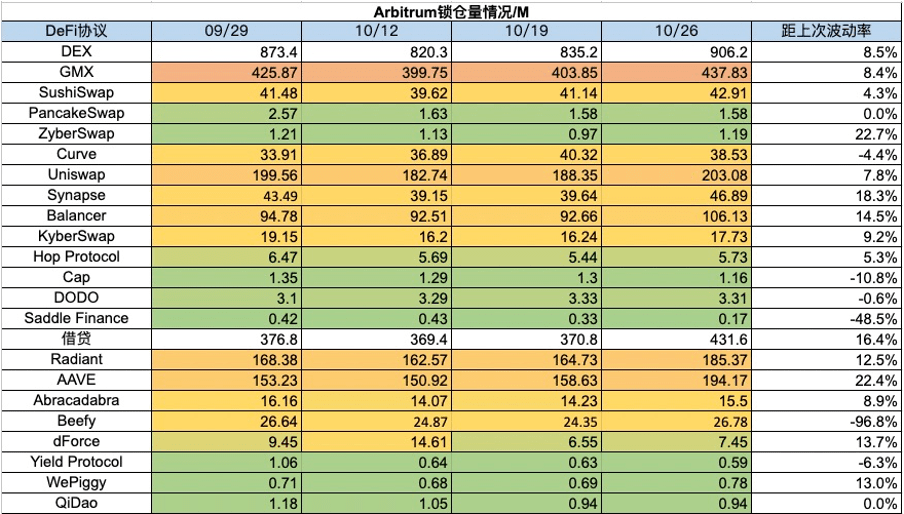
4) Arbitrum locked amount
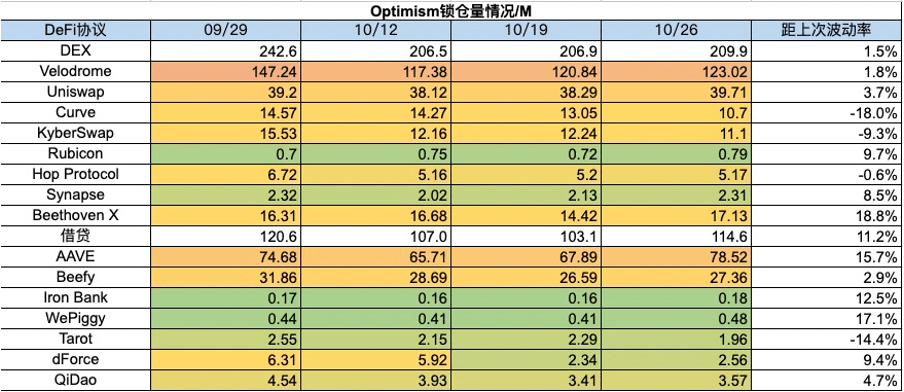
5) Optimism locked amount
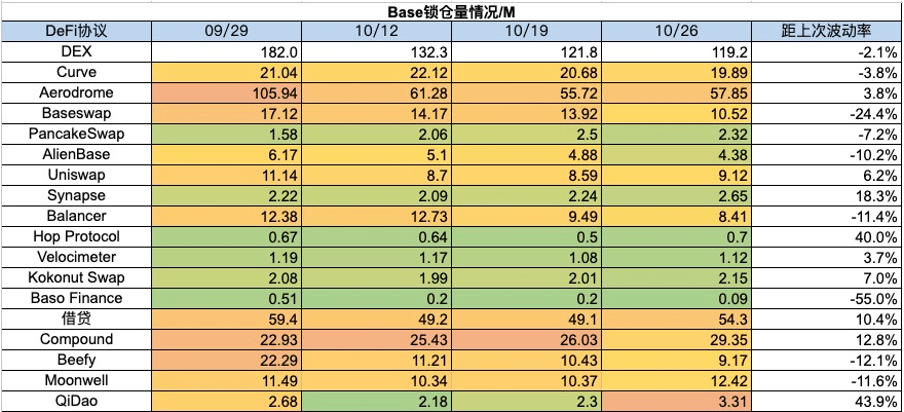
6) Base lock-up amount
IV. ETH Gas Fee History
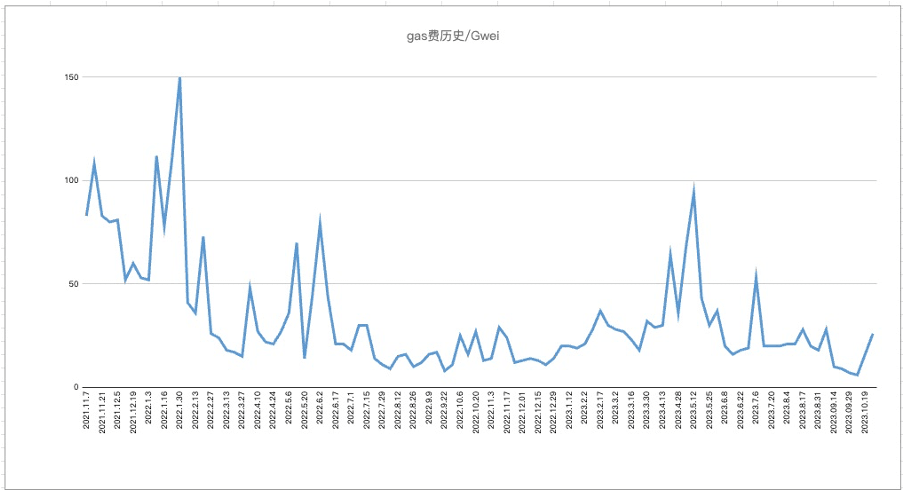
The on-chain transfer fee is about $2.43, the Uniswap transaction fee is about $8.27, and the OpenSea transaction fee is about $3.21. Gas usage and transaction fees have risen sharply this week. In terms of gas consumption, Uniswap occupies the top position, accounting for 12.82% of the entire market. The bottom rebound of the market has brought signs and possibilities of recovery to on-chain applications.
5. Changes in NFT market data
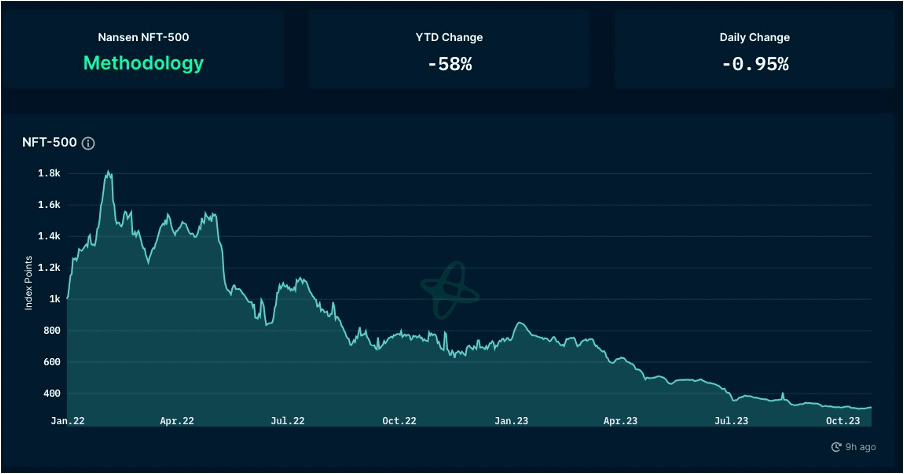
1) NFT-500 Index
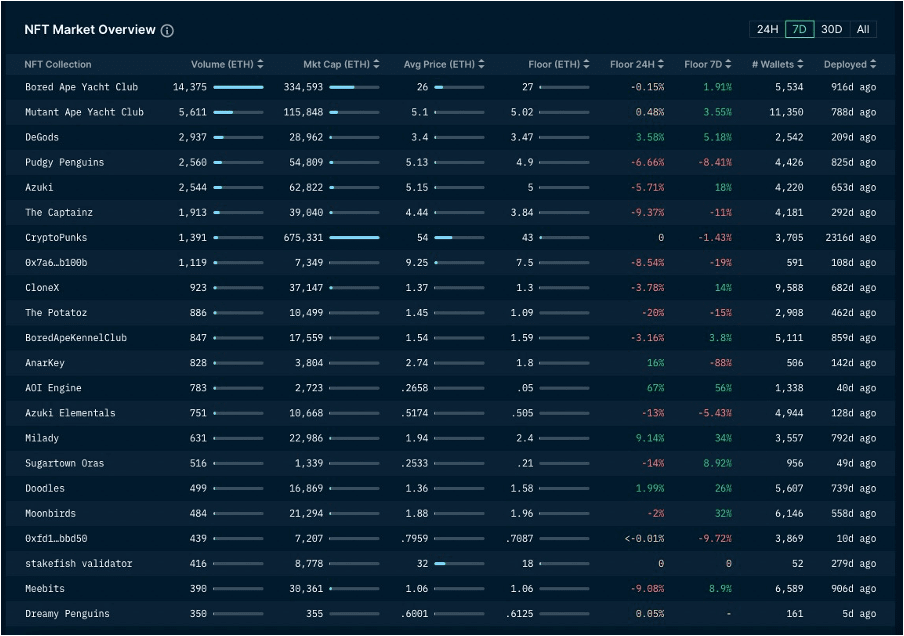
2) NFT market situation
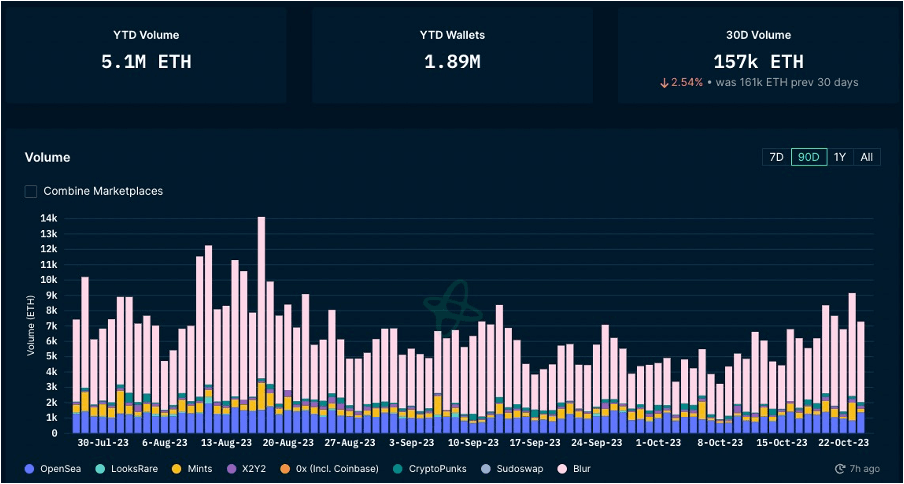
3) NFT trading market share
4) NFT Buyer Analysis
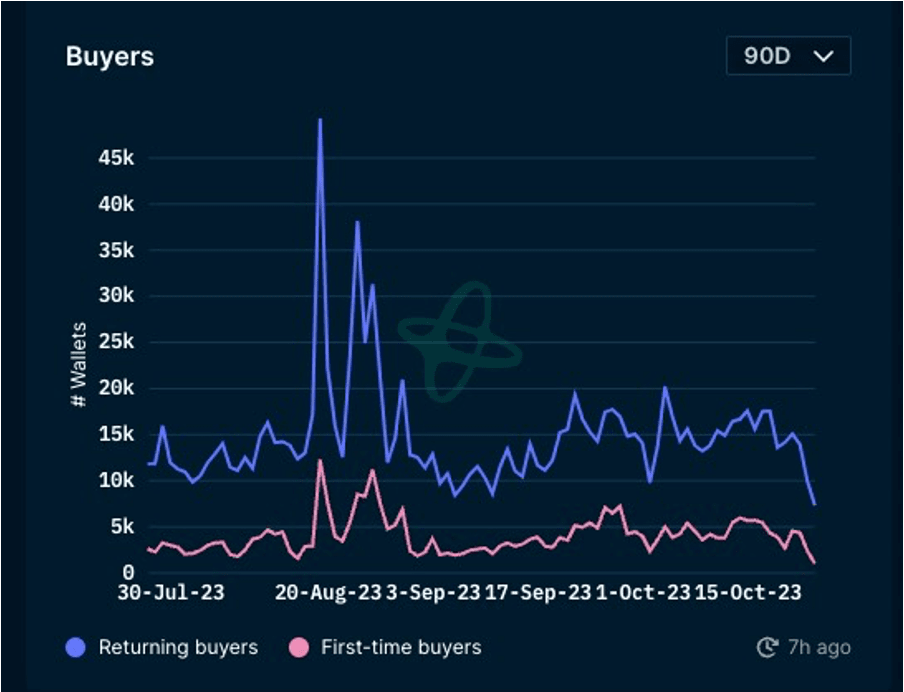
This week, the floor prices of the top blue-chip projects rose and fell. BAYC and MAYC both rose by more than 5%, except Azuki, which rose by 15%, and CloneX and AOI Engine, which rose by more than 20%. Yawanawa, which rose by more than 50% last week, fell by more than 30% this week. The NFT market transaction volume has increased significantly in the past week, but the number of repeat buyers and the number of first-time NFT users continue to decline. The NFT market has not yet been brought about by the bottom rebound of the market. Significant signs of recovery.


